index.vue
<template>
<div class="myDiagram">
<ScoreDiagram :data="data"></ScoreDiagram>
</div>
</template>
<script setup>
import ScoreDiagram from "./scoreDiagram.vue"
import {reactive} from "vue"
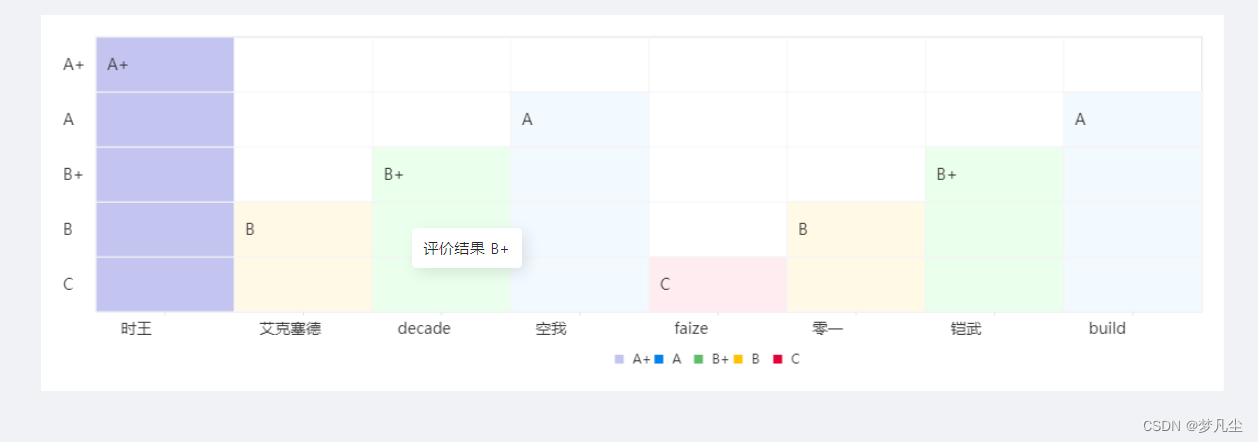
const data = reactive({
axisX: [
"时王",
"艾克塞德",
"decade",
"空我",
"faize",
"零一",
"铠武",
"build"
],
axisY: ["A+","A", "B+", "B", "C"],
relation: {
时王: "A+",
艾克塞德: "B",
decade: "B+",
空我: "A",
faize: "C",
零一: "B",
铠武: "B+",
build: "A"
},
colorRelation: {
"A+":"rgb(185 186 237 / 85%)",
A: "#f2f9ff",
"B+": "#eaffec",
B: "#fff9e6",
C: "#ffecf1"
},
legendColor: {
"A+":"rgb(185 186 237 / 85%)",
A: "#0081eb",
"B+": "#5ebe67",
B: "#ffc200",
C: "#e60039"
}
});
</script>
<style lang="less" >
</style>
scoreDiagram.vue
<template>
  <div id="zyq-showGrade" ref="showGrade" class="zyq-diagram-score">
    <canvas
      id="score-canvas"
      ref="canvasDom"
      :width="canvasSize.width"
      :height="canvasSize.height"
      @mouseleave="canvasMouseOut"
      @mousemove="canvasMouseMove"
    ></canvas>
    <div
      ref="tooltip"
      :style="{ visibility: showTooltip ? 'visible' : 'hidden' }"
      class="score-canvas-tooltip"
      @mouseenter="tooltipMouseEnter"
    >
      <span>评价结果</span><span style="margin-left: 5px">{{ result }}</span>
    </div>
  </div>
</template>
<script setup>
import {
  onBeforeUnmount,
  defineProps,
  ref,
  reactive,
  toRefs,
  computed,
  onMounted,
  nextTick,
  watch
} from "vue";
const props = defineProps({
  //1,数据源
  data: {
    type: Object,
    default: () => {}
  },
  //2,xy轴坐标字体大小
  fontSize: {
    type: Number,
    default: 14
  },
  //3,文字颜色
  fontColor: {
    type: String,
    default: "#383838"
  },
  //4,外边框颜色
  borderColor: {
    type: String,
    default: "#dee1e7"
  },
  //5,内边框颜色
  innerBorderColor: {
    type: String,
    default: "#f5f5f5"
  },
  //6,边框基础宽度
  baseWidth: {
    type: Number,
    default: 80
  },
  //7,边框基础高度
  baseHeight: {
    type: Number,
    default: 50
  },
  //8,canvas绘图边缘部分距离
  outerEdge: {
    type: Number,
    default: 20
  },
  //9,y轴文字基础宽度
  yTextBaseWidth: {
    type: Number,
    default: 30
  },
  //10,x轴坐标两端绘制间隔
  axisXInterval: {
    type: Number,
    default: 10
  },
  //11,y轴坐标文本距离表格间隔
  axisYInterval: {
    type: Number,
    default: 10
  },
  //12,坐标轴字体
  canvasFontFamily: {
    type: String,
    default: "Microsoft YaHei"
  },
  //13,下方文字据x轴坐标轴的垂直距离
  axisXTextEdge: {
    type: Number,
    default: 20
  }
});
const canvasDom = ref();
const showGrade = ref();
const tooltip = ref();
const showTooltip = ref(false);

const canvasSize = reactive({
  width: 0,
  height: 0
});
const {
  data,
  fontSize,
  fontColor,
  borderColor,
  innerBorderColor,
  baseWidth,
  baseHeight,
  outerEdge,
  axisXTextEdge,
  yTextBaseWidth,
  axisXInterval,
  axisYInterval,
  canvasFontFamily
} = toRefs(props);

//经计算之后的边框真实宽度:用于canvas绘制的宽度
const realWidth = ref(baseWidth.value);
//x轴数据的长度
const axLength = computed(() => {
  return data.value.axisX.length;
});
//y轴数据的长度
const ayLength = computed(() => {
  return data.value.axisY.length;
});

//用于保存所有x轴坐标文本计算精确宽度
const realXBorderWidth = ref(new Array(axLength.value).fill(baseWidth.value));
//y轴坐标文本真实宽度
const yRealWidth = ref(yTextBaseWidth.value);
//左边预留宽度 = 外边框+y轴坐标文本真实宽度
const leftOutWidth = ref(outerEdge.value + yRealWidth.value + axisYInterval.value);
//canvas画布最小宽度 初始值 = 左边预留宽度+单侧外边框宽度
const minCanvasWidth = ref(leftOutWidth.value + outerEdge.value);
//评价结果
const result = ref("A");

//当鼠标进入边界禁移区域时tooltip的回弹距离
const springbackDistanceX = ref(60);
const springbackDistanceY = ref(40);
//tooltip同鼠标错位距离
const dislocation = ref(15);

//计算所需的坐标对象
const state = reactive({
  clientX: 0, //鼠标在窗口的x轴坐标
  clientY: 0, //鼠标在窗口上的y轴坐标
  tLeft: "", //tooltip元素的左偏移量
  tTop: "", //tooltip元素的上偏移量
  canvasX: 0, //鼠标在canvas画布上的x轴坐标
  canvasY: 0, //鼠标在canvas画布上的y轴坐标
  endX: 0, //网格绘制区域在canvas上的截至x坐标
  endY: 0, //网格绘制区域在canvas上的截至Y坐标
  axisXindex: 0, //当前鼠标所在网格位置上对应的x轴元素集合中的坐标
  newWindowWidth: 0 //获取当前窗口宽度
});

//计算字符串在canvas画布中绘制的长度
const getBorderWidth = (minWidth, strData, wordSize) => {
  let wordWidth = 0;
  for (let i = 0; i < strData.length; i++) {
    if (strData.charCodeAt(i) > 255) {
      //当前字符是汉字
      wordWidth += wordSize;
    } else if (strData.charCodeAt(i) > 47 && strData.charCodeAt(i) < 58) {
      //当前字符是数字
      wordWidth += wordSize - 6;
    } else if (strData.charCodeAt(i) >= 65 && strData.charCodeAt(i) <= 90) {
      //当前是大写英文字符
      wordWidth += wordSize - 5;
    } else if (strData.charCodeAt(i) > 96 && strData.charCodeAt(i) < 123) {
      //当前是小写英文字符
      wordWidth += wordSize - 6.5;
    } else {
      //特殊字符
      wordWidth += wordSize - 6;
    }
  }
  if (wordWidth < minWidth) {
    wordWidth = minWidth;
  }

  return wordWidth;
};
//绘制直线
const drawLine = (ctx, startX, startY, endX, endY, color) => {
  if (ctx) {
    ctx.beginPath();
    ctx.strokeStyle = color;
    ctx.moveTo(startX, startY);
    ctx.lineTo(endX, endY);
    ctx.stroke();
  }
};
//循环计算y轴文本真实宽度
const setYRealWidth = () => {
  let realWidth = 0;
  for (let i = 0; i < ayLength.value; i++) {
    realWidth = getBorderWidth(yTextBaseWidth.value, data.value.axisY[i], fontSize.value);
    if (yTextBaseWidth.value !== realWidth && realWidth > yRealWidth.value) {
      yRealWidth.value = realWidth + axisYInterval.value;
    }
  }
  leftOutWidth.value = outerEdge.value + yRealWidth.value;
};

const canvasMouseOut = () => {
  showTooltip.value = false;
};
const tooltipMouseEnter = () => {
  if (Object.keys(data.value.relation).length > 0) {
    showTooltip.value = true;
  }
};

const canvasMouseMove = (e) => {
  state.endX = leftOutWidth.value + realWidth.value * axLength.value;
  state.endY = outerEdge.value + baseHeight.value * ayLength.value;
  const showGradeRect = showGrade.value.getBoundingClientRect();
  const canvasDomRect = canvasDom.value.getBoundingClientRect();
  state.clientX = e.clientX;
  state.clientY = e.clientY;
  state.tLeft = state.clientX - showGradeRect.x + showGrade.value.scrollLeft + dislocation.value;
  state.tTop = state.clientY - showGradeRect.y + showGrade.value.scrollTop + dislocation.value;
  //处理右边界问题,防止撑起canvas父元素横向滚动条
  //主要处理当鼠标向下方向右侧移动至边界时的tooltip标签回弹计算处理
  //判断state.tLeft是否在横向禁移区域中,进行回弹处理
  //计算此时tooltip标签右边界相对于canvas上的坐标
  const tooltipRightX = state.tLeft + 100;
  if (
    tooltipRightX >= canvasSize.width &&
    tooltipRightX !== canvasSize.width - springbackDistanceX.value - 100
  ) {
    //当tooltip横向进入回弹区域时使其进行左向回弹
    state.tLeft = canvasSize.width - springbackDistanceX.value - 100;
  }
  //处理纵向回弹效果
  const tooltipBottomY = state.tTop + 36;
  if (
    tooltipBottomY >= outerEdge.value + ayLength.value * baseHeight.value &&
    tooltipBottomY !==
      outerEdge.value + ayLength.value * baseHeight.value - springbackDistanceY.value - 36
  ) {
    //当tooltip纵向进入回弹区域时使其进行向上回弹
    state.tTop =
      outerEdge.value + ayLength.value * baseHeight.value - springbackDistanceY.value - 36;
  }
  tooltip.value.style.left = state.tLeft + "px";
  tooltip.value.style.top = state.tTop + "px";

  state.canvasX = state.clientX - canvasDomRect.x;
  state.canvasY = state.clientY - canvasDomRect.y;
  //判断toolTip元素的显示或隐藏
  if (
    state.canvasX > leftOutWidth.value &&
    state.canvasX < state.endX &&
    state.canvasY > outerEdge.value &&
    state.canvasY < state.endY
  ) {
    if (Object.keys(data.value.relation).length > 0) {
      showTooltip.value = true;
    }
  } else {
    showTooltip.value = false;
  }
  //根据鼠标元素在canvas画布上的坐标去得到当前选择的公司的评分

  state.axisXindex = Math.floor((state.canvasX - leftOutWidth.value) / realWidth.value);
  if (state.axisXindex < 0) {
    state.axisXindex = 0;
  }
  if (state.axisXindex > axLength.value - 1) {
    state.axisXindex = axLength.value - 1;
  }
  if (Object.keys(data.value.relation).length > 0) {
    result.value = data.value.relation[data.value.axisX[state.axisXindex]];
  }
};

//绘制主体方法
const drawDiagram = () => {
  //更新真实方格宽度
  realWidth.value = 0;
  //更新画布最小宽度初始值
  minCanvasWidth.value = leftOutWidth.value + outerEdge.value;
  //获取canvasDom对象,canvas父元素Dom对象,tooltip元素dom
  const showGradeRect = showGrade.value.getBoundingClientRect();
  const ctx = canvasDom.value.getContext("2d");
  //更新canvas宽度
  canvasSize.width = showGradeRect.width;
  //计算画布真实高度=2*外边框+方格总高+下方文字据x轴坐标的距离下方文字尺寸+文字距色块距离10+下方色块标识8
  const canvasHeight =
    2 * outerEdge.value +
    baseHeight.value * ayLength.value +
    axisXTextEdge.value +
    fontSize.value +
    10 +
    8;
  canvasSize.height = canvasHeight;

  //清除画布
  ctx.clearRect(0, 0, canvasSize.width, canvasSize.height);
  //计算子边框元素的宽度,并保存每个x轴坐标文本所占最小宽度,以便进行中心绘制
  for (let i = 0; i < axLength.value; i++) {
    const realRealWidth = getBorderWidth(baseWidth.value, data.value.axisX[i], fontSize.value);
    if (
      baseWidth.value !== realRealWidth &&
      realRealWidth + axisXInterval.value * 2 > realWidth.value
    ) {
      realWidth.value = realRealWidth + axisXInterval.value * 2;
    }
    realXBorderWidth.value[i] = realRealWidth;
  }
  minCanvasWidth.value += realWidth.value * axLength.value;
  //将canvas当前画布大小同minCanvasWidth数值进行比对,根据比对结果进行对canvas.width进行调整,或者调整realWidth的宽度
  if (canvasSize.width > minCanvasWidth.value) {
    //当canvasWidth大于canvas画布所需的最小宽度,则将多余的宽度分配给reamWidth
    realWidth.value += (canvasSize.width - minCanvasWidth.value) / axLength.value;
  } else {
    canvasSize.width = minCanvasWidth.value;
  }
  //此时已经获取真实子集边框元素的宽度
  //绘制正方形线框
  ctx.lineWidth = 2;
  nextTick(() => {
    ctx.strokeStyle = borderColor.value;
    ctx.strokeRect(
      leftOutWidth.value,
      outerEdge.value,
      realWidth.value * axLength.value,
      baseHeight.value * ayLength.value
    );
    //绘制网格
    //循环绘制横线 //顺便绘制Y轴文字,y轴文字宽度没有进行计算,默认不是很宽,50px
    ctx.lineWidth = 1;
    let drawChildStartY = outerEdge.value;
    for (let i = 0; i < ayLength.value; i++) {
      if (i >= 1) {
        drawChildStartY += baseHeight.value;
        drawLine(
          ctx,
          leftOutWidth.value,
          drawChildStartY,
          realWidth.value * axLength.value + leftOutWidth.value,
          drawChildStartY,
          innerBorderColor.value
        );
      }
      //绘制Y轴文字
      ctx.font = "normal " + fontSize.value + "px " + canvasFontFamily.value;
      ctx.fillStyle = fontColor.value;
      ctx.fillText(
        data.value.axisY[i],
        outerEdge.value,
        drawChildStartY + baseHeight.value / 2 + 5
      );
    }

    //循环绘制纵线 顺便进行绘制X轴文字,x轴文字宽度已经进行计算过了,追加中心绘制
    let drawChildStartX = leftOutWidth.value;
    let theInterval = axisXInterval.value;
    for (let i = 0; i < axLength.value; i++) {
      theInterval = axisXInterval.value;
      if (theInterval < (realWidth.value - realXBorderWidth.value[i]) / 2) {
        theInterval = (realWidth.value - realXBorderWidth.value[i]) / 2;
      }

      if (i >= 1) {
        drawChildStartX += realWidth.value;
        drawLine(
          ctx,
          drawChildStartX,
          outerEdge.value,
          drawChildStartX,
          outerEdge.value + baseHeight.value * ayLength.value,
          innerBorderColor.value
        );
      }
      ctx.font = "normal " + fontSize.value + "px " + canvasFontFamily.value;
      ctx.fillStyle = fontColor.value;
      //绘制x轴文字
      ctx.fillText(
        data.value.axisX[i],
        drawChildStartX + theInterval,
        outerEdge.value + baseHeight.value * ayLength.value + axisXTextEdge.value
      );
    }

    let scoreStartX = leftOutWidth.value;
    let scoreStartY = outerEdge.value + baseHeight.value * (ayLength.value - 1);
    let middleStartX = 0; //x轴坐标中心点纵线起始x坐标
    const middleStartY = outerEdge.value + baseHeight.value * ayLength.value; //x轴坐标中心点纵线起始y坐标
    //从下往上 循环绘制填充方格
    for (let i = 0; i < axLength.value; i++) {
      //获取每个x坐标对应的y轴格数
      let gridNum;
      let gridColor;
      if (
        Object.keys(data.value.relation).length > 0 &&
        data.value.relation[`${data.value.axisX[i]}`]
      ) {
        gridNum =
          ayLength.value - data.value.axisY.indexOf(data.value.relation[`${data.value.axisX[i]}`]);
        gridColor = data.value.colorRelation[data.value.relation[data.value.axisX[i]]];
      }

      if (gridNum) {
        for (let j = 0; j < gridNum; j++) {
          middleStartX = scoreStartX + realWidth.value / 2;
          //绘制x轴坐标中心点,长度默认3
          if (j === 0) {
            drawLine(
              ctx,
              middleStartX,
              middleStartY,
              middleStartX,
              middleStartY + 3,
              borderColor.value
            );
          }
          ctx.fillStyle = gridColor;
          ctx.fillRect(scoreStartX, scoreStartY, realWidth.value, baseHeight.value);
          //绘制能量格边框
          ctx.strokeStyle = innerBorderColor.value;
          ctx.strokeRect(scoreStartX, scoreStartY, realWidth.value, baseHeight.value);

          if (j === gridNum - 1) {
            //如果当前绘制的是最后一个方格,则要绘制得分标识
            ctx.fillStyle = fontColor.value;
            ctx.font = "normal " + fontSize.value + "px " + canvasFontFamily.value;
            ctx.fillText(
              data.value.relation[`${data.value.axisX[i]}`],
              scoreStartX + 10,
              scoreStartY + baseHeight.value / 2 + 5
            );
          }
          scoreStartY -= baseHeight.value;
        }
      }
      scoreStartX += realWidth.value;
      scoreStartY = outerEdge.value + baseHeight.value * (ayLength.value - 1);
    }
    drawLegend();
  });
};

const drawLegend = () => {
  const showGradeRect = showGrade.value.getBoundingClientRect();
  const ctx = canvasDom.value.getContext("2d");
  //绘制表格底部Y轴色块标识 默认一个绘制元素尺寸为8px,元素间距也是8px,默认x轴内容文字高度占据文字高度+文字据下色块标识的距离,
  let bottomStartX =
    outerEdge.value +
    showGradeRect.width / 2 -
    ((ayLength.value * 2 - 1) * 8) / 2 +
    showGrade.value.scrollLeft; //表格底部色块标识起始x坐标
  const bottomStartY =
    outerEdge.value + baseHeight.value * ayLength.value + axisXTextEdge.value + fontSize.value + 5;
  ctx.clearRect(0, bottomStartY - 1, canvasSize.width, 12);
  let boGridColor = "";
  //循环绘制底部Y轴色块标识
  for (let i = 0; i < ayLength.value; i++) {
    //获取当前绘制色块yanse
    boGridColor = data.value.legendColor[data.value.axisY[i]];
    ctx.fillStyle = boGridColor;
    ctx.fillRect(bottomStartX, bottomStartY, 8, 8);
    bottomStartX += 16;
    ctx.fillStyle = fontColor.value;
    ctx.font = "normal 12px " + canvasFontFamily.value;
    ctx.fillText(data.value.axisY[i], bottomStartX, bottomStartY + 8);
    bottomStartX += 20;
  }
};
setYRealWidth();
watch(
  () => data.value.axisX,
  () => {
    if (data.value.axisX.length > 0) {
      drawDiagram();
    }
  }
);

onMounted(() => {
  drawDiagram();
  window.addEventListener("resize", drawDiagram);
  showGrade.value.addEventListener("scroll", drawLegend);
});
onBeforeUnmount(() => {
  window.removeEventListener("resize", drawDiagram);
  showGrade.value.removeEventListener("scroll", drawLegend);
});
</script>
<style scoped>
.zyq-diagram-score {
  width: 100%;
  overflow: auto;
  /* height:100%; */
  display: flex;
  justify-content: flex-start;
  align-items: center;
  position: relative;
  background-color: rgb(251, 252, 252);
}

.score-canvas-tooltip {
  width: 100px;
  box-sizing: border-box;
  height: 36px;
  line-height: 36px;
  background: white;
  position: absolute;
  left: 0px;
  top: 0px;
  font-size: 14px;
  /* display: none; */
  padding: 0 10px;
  box-sizing: border-box;
  border-radius: 4px;
  box-shadow: 4px 4px 14px 0px rgba(0, 0, 0, 0.1);
  cursor: default;
  transition: all 100ms 0ms ease;
  visibility: hidden;
  /* transition: top .5s; */
}
canvas {
  background: white;
}
</style>
效果图:


 1560
1560


 被折叠的 条评论
为什么被折叠?
被折叠的 条评论
为什么被折叠?
 到【灌水乐园】发言


