


最近做钉钉小程序需要使用到图表展示的功能,刚开始想到antd/f2,但是放在钉钉小程序里是有各种问题的,支付宝官方网上推荐使用antd/my-f2,用了之后还是会存在一些问题,比如环形图图上的点击事件是拿不到的,点击某区域放大效果也是不生效,索性放弃了它,找到uCharts。
在用uCharts时,用组件工具时有问题,建议还是用原生工具好

直接上业务代码吧
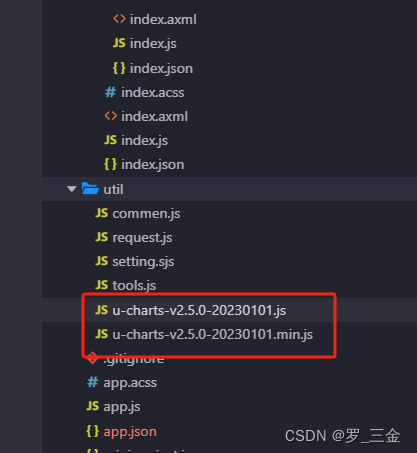
先下载uCharts相关图表的js库(下载代码时需要登录充值会员,可以开通一天的 1元钱)
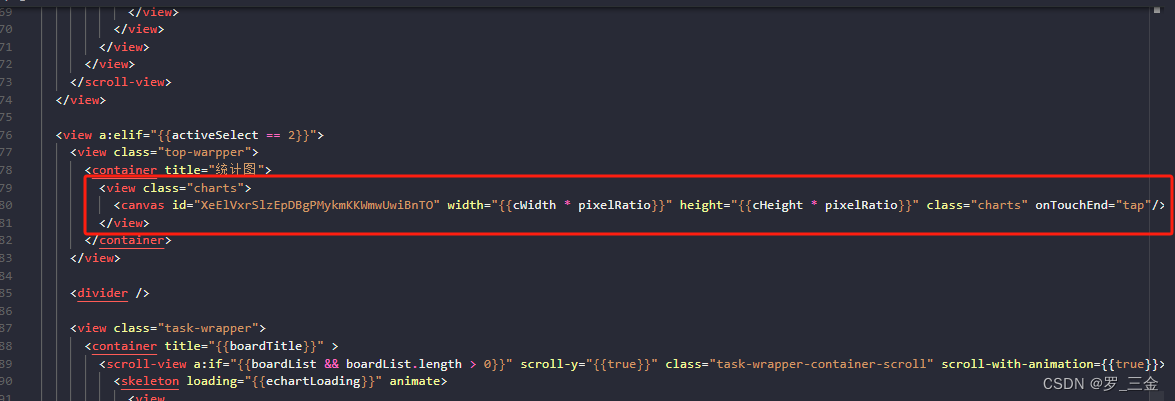
axml
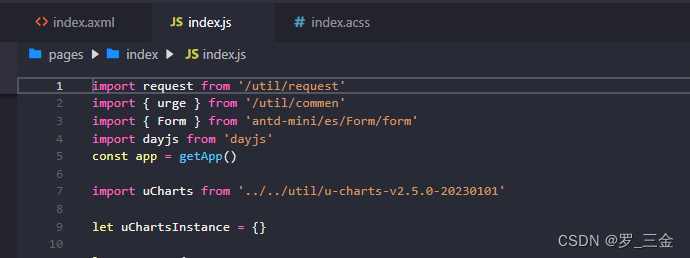
js
js代码 部分为业务代码,可根据自己的业务进行修改(比如数据请求)
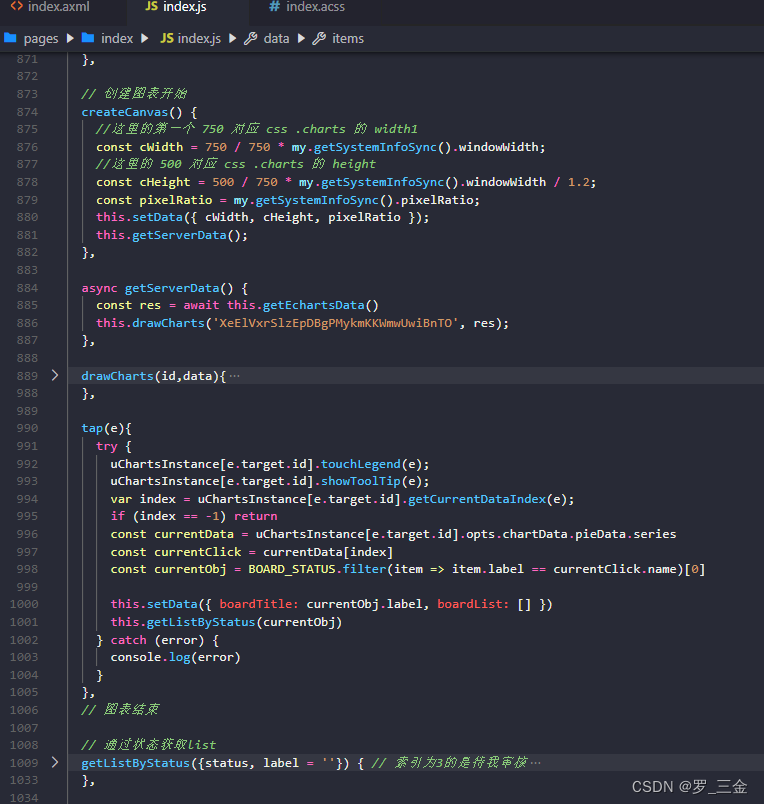
// 创建图表开始
createCanvas() {
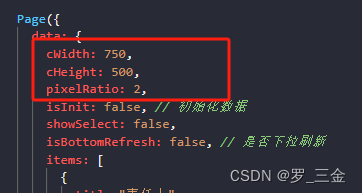
//这里的第一个 750 对应 css .charts 的 width1
const cWidth = 750 / 750 * my.getSystemInfoSync().windowWidth;
//这里的 500 对应 css .charts 的 height
const cHeight = 500 / 750 * my.getSystemInfoSync().windowWidth / 1.2;
const pixelRatio = my.getSystemInfoSync().pixelRatio;
this.setData({ cWidth, cHeight, pixelRatio });
this.getServerData();
},
async getServerData() {
const res = await this.getEchartsData()
this.drawCharts('XeElVxrSlzEpDBgPMykmKKWmwUwiBnTO', res);
},
drawCharts(id,data){
const ctx = my.createCanvasContext(id);
uChartsInstance[id] = new uCharts({
type: "ring",
context: ctx,
width: this.data.cWidth * this.data.pixelRatio,
height: this.data.cHeight * this.data.pixelRatio,
series: data.series,
pixelRatio: this.data.pixelRatio,
animation: true,
timing: "easeOut",
duration: 1000,
rotate: false,
rotateLock: false,
background: "#FFFFFF",
color: ["#1890FF","#91CB74","#FAC858","#EE6666","#73C0DE","#3CA272","#FC8452","#9A60B4","#ea7ccc"],
// color: ['#89BD56', '#9F07E6', '#F8C568', '#F18D07', '#ED0D0D'],
padding: [1,1,1,1],
fontSize: 15,
fontColor: "#666666",
dataLabel: true,
dataPointShape: true,
dataPointShapeType: "solid",
touchMoveLimit: 60,
enableScroll: false,
enableMarkLine: false,
legend: {
show: true,
position: "right",
lineHeight: 28,
float: "center",
padding: 5,
margin: 5,
backgroundColor: "rgba(0,0,0,0)",
borderColor: "rgba(0,0,0,0)",
borderWidth: 0,
fontSize: 15,
fontColor: "#666666",
hiddenColor: "#CECECE",
itemGap: 10
},
// title: {
// name: "收益率",
// fontSize: 15,
// color: "#666666",
// offsetX: 0,
// offsetY: 0
// },
// subtitle: {
// name: "70%",
// fontSize: 25,
// color: "#7cb5ec",
// offsetX: 0,
// offsetY: 0
// },
extra: {
ring: {
ringWidth: 20,
activeOpacity: 0.5,
activeRadius: 10,
offsetAngle: 0,
// customRadius: 200, // 自定义半径
labelWidth: 20,
border: true,
borderWidth: 3,
borderColor: "#FFFFFF",
centerColor: "#FFFFFF",
customRadius: 0,
linearType: "none"
},
tooltip: {
showBox: true,
showArrow: true,
showCategory: false,
borderWidth: 0,
borderRadius: 0,
borderColor: "#000000",
borderOpacity: 0.7,
bgColor: "#000000",
bgOpacity: 0.7,
gridType: "solid",
dashLength: 4,
gridColor: "#CCCCCC",
boxPadding: 3,
fontSize: 13,
lineHeight: 20,
fontColor: "#FFFFFF",
legendShow: true,
legendShape: "auto",
splitLine: true,
horizentalLine: false,
xAxisLabel: false,
yAxisLabel: false,
labelBgColor: "#FFFFFF",
labelBgOpacity: 0.7,
labelFontColor: "#666666"
}
}
});
},
// 点击某个区域 切换下面列表数据,如最后面的完整图所示
tap(e){
try {
uChartsInstance[e.target.id].touchLegend(e);
uChartsInstance[e.target.id].showToolTip(e);
var index = uChartsInstance[e.target.id].getCurrentDataIndex(e);
if (index == -1) return
const currentData = uChartsInstance[e.target.id].opts.chartData.pieData.series
const currentClick = currentData[index]
const currentObj = BOARD_STATUS.filter(item => item.label == currentClick.name)[0]
this.setData({ boardTitle: currentObj.label, boardList: [] })
this.getListByStatus(currentObj)
} catch (error) {
console.log(error)
}
},
// 通过状态获取list
getListByStatus({status, label = ''}) { // 索引为3的是待我审核
const params = {
pageNum: 1,
pageSize: 99999999,
ddingId: this.data.currentId,
taskStatus: status
}
this.setData({ echartLoading: true })
request.post('/kds-serve/tasks/query', params)
.then(res => {
let _tempData = []
if (status == '4') { // 待审核
if (label == '待我审核') { // 待我审核
_tempData = res.result && res.result.length > 0 && res.result.filter(item => item.verifyerId == this.data.currentId) || []
} else if (label == '待他人审核') { // 待他人审核
_tempData = res.result && res.result.length > 0 && res.result.filter(item => item.verifyerId != this.data.currentId) || []
}
} else {
_tempData = res.result || []
}
this.setData({ boardList: _tempData, echartLoading: false })
}).catch((error) => {
this.setData({ echartLoading: false })
})
},
最终结果


 546
546


 被折叠的 条评论
为什么被折叠?
被折叠的 条评论
为什么被折叠?
 到【灌水乐园】发言


