Matplotlib基础入门
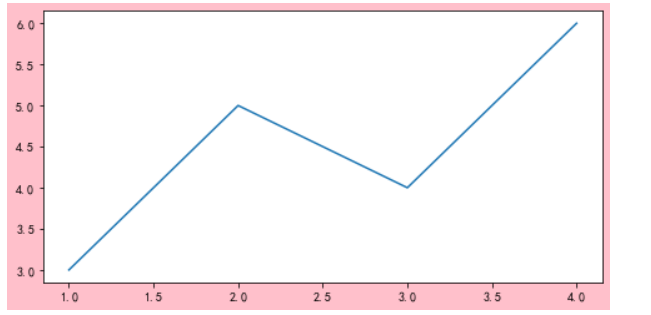
折线图
import matplotlib.pyplot as plt
plt.rcParams['font.sans-serif']='SimHei'
plt.rcParams['axes.unicode_minus']=False
plt.figure(figsize=(8,4),facecolor='pink')
plt.plot([1,2,3,4],[3,5,4,6])
plt.show()
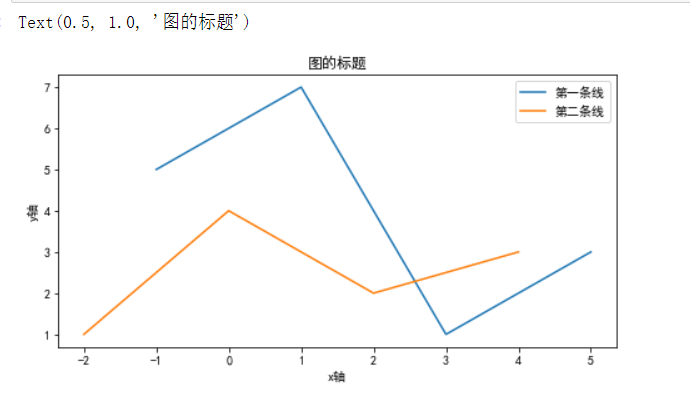
细化折线图
plt.figure(figsize=(8,4))
x=[-1,1,3,5]
y=[5,7,1,3]
x1=list(zip(*[(-2,1),(0,4),(2,2),(4,3)]))[0]
y1=list(zip(*[(-2,1),(0,4),(2,2),(4,3)]))[1]
plt.plot(x,y,label='第一条线')
plt.plot(x1,y1,label='第二条线')
plt.legend()
plt.xlabel('x轴')
plt.ylabel('y轴')
plt.title('图的标题')
Matplotlib进阶
import matplotlib.pyplot as plt
plt.rcParams['font.sans-serif']='SimHei'
plt.rcParams['axes.unicode_minus']=False
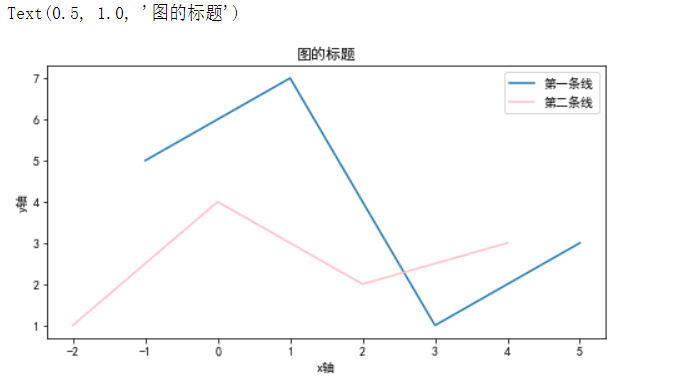
折线图 plt.plot
plt.figure(figsize=(8,4))
x=[-1,1,3,5]
y=[5,7,1,3]
x1=list(zip(*[(-2,1),(0,4),(2,2),(4,3)]))[0]
y1=list(zip(*[(-2,1),(0,4),(2,2),(4,3)]))[1]
plt.plot(x,y,label='第一条线')
plt.plot(x1,y1,label='第二条线',color='pink')
plt.legend()
plt.xlabel('x轴')
plt.ylabel('y轴')
plt.title('图的标题')
柱状图 plt.bar
print(x,y,x1,y1)
plt.bar(x,y,label='柱状图-01',color='yellow')
plt.bar(x1,y1,label='柱状图-02',color='pink')
plt.legend()
plt.xlabel('x轴')
plt.ylabel('y轴')
plt.title('图的标题')
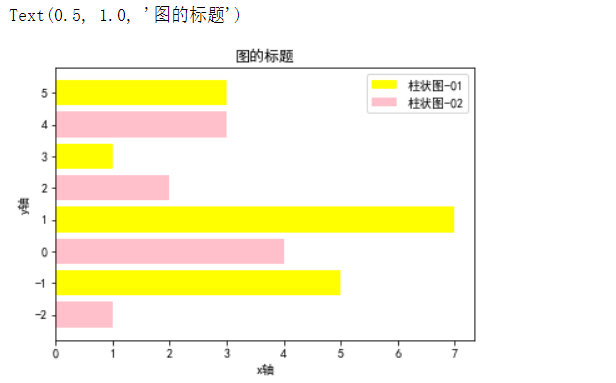
水平柱状图 plt.barth
plt.barh(x,y,label='柱状图-01',color='yellow')
plt.barh(x1,y1,label='柱状图-02',color='pink')
plt.legend()
plt.xlabel('x轴')
plt.ylabel('y轴')
plt.title('图的标题')
直方图 plt.hist
import numpy as np
ages=np.random.randint(18,75,200)
ages
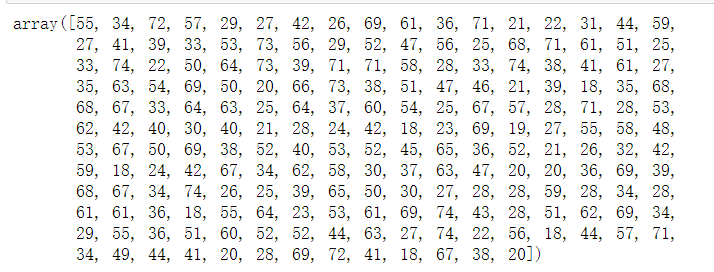
bins=np.arange(1,9)*10
bins

list(range(1,9))
plt.hist(ages,bins,histtype='bar',label='年龄直方图',rwidth=0.8)
plt.show()
饼图 plt.pie
slices=[2,7,12,3]
activites=['eat','sleep','study','play']
colors=['red','blue','purple','pink']
plt.pie(
slices,
labels=activites,
colors=colors,
startangle=45,
shadow=True,
explode=(0.1,0,0,0),
autopct='%.2f%%',
labeldistance=1.1,
pctdistance=0.6,
radius=1.5,
)
plt.show()
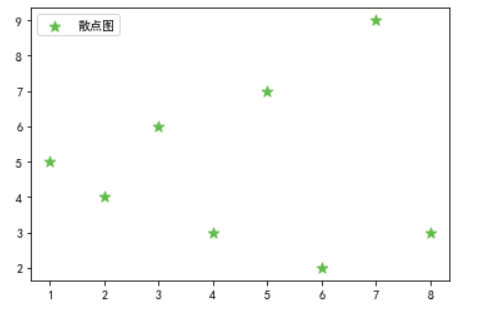
散点图 plt.scatter
x = [1,2,3,4,5,6,7,8]
y = [5,4,6,3,7,2,9,3]
plt.scatter(x,y,label='散点图',color='#62BC4A',s=80,marker='*')
plt.legend()
plt.show()
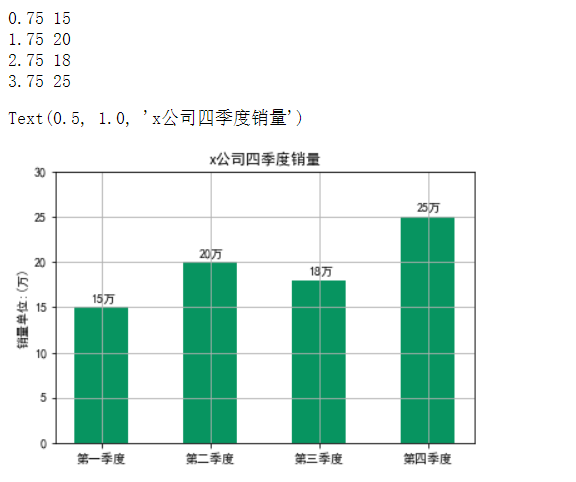
柱状图标记
plt.figure()
ax1=plt.subplot(1,1,1)
data=np.array([15,20,18,25])
rect=ax1.bar([1,2,3,4],data,width=0.5,color='#079460')
for each in rect:
x=each.get_x()
height=each.get_height()
print(x,height)
ax1.text(x+0.15,height+0.5,f'{height}万')
ax1.set_xticks([1,2,3,4])
ax1.set_xticklabels([f'第{i}季度' for i in '一二三四'])
ax1.set_ylabel('销量单位:(万)')
ax1.set_ylim(0,30)
ax1.grid(True)
ax1.set_title('x公司四季度销量')
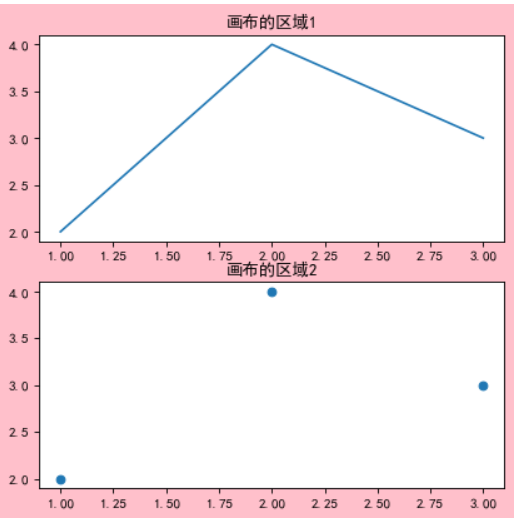
一个画布画多个图
plt.figure(figsize=(6,6),dpi=80,facecolor='pink')
plt.subplot(2,1,1)
plt.plot([1,2,3],[2,4,3])
plt.title('画布的区域1')

plt.subplot(2,1,2)
plt.scatter([1,2,3],[2,4,3])
plt.title('画布的区域2')

plt.show()
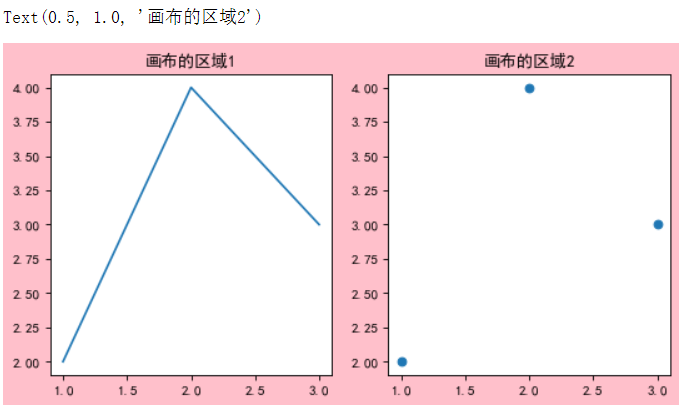
plt.figure(figsize=(8,4),dpi=80,facecolor='pink')
ax2=plt.subplot(1,2,1)
ax2.plot([1,2,3],[2,4,3])
ax2.set_title('画布的区域1')

ax3=plt.subplot(1,2,2)
ax3.scatter([1,2,3],[2,4,3])
ax3.set_title('画布的区域2')


 419
419

 被折叠的 条评论
为什么被折叠?
被折叠的 条评论
为什么被折叠?
 到【灌水乐园】发言


