


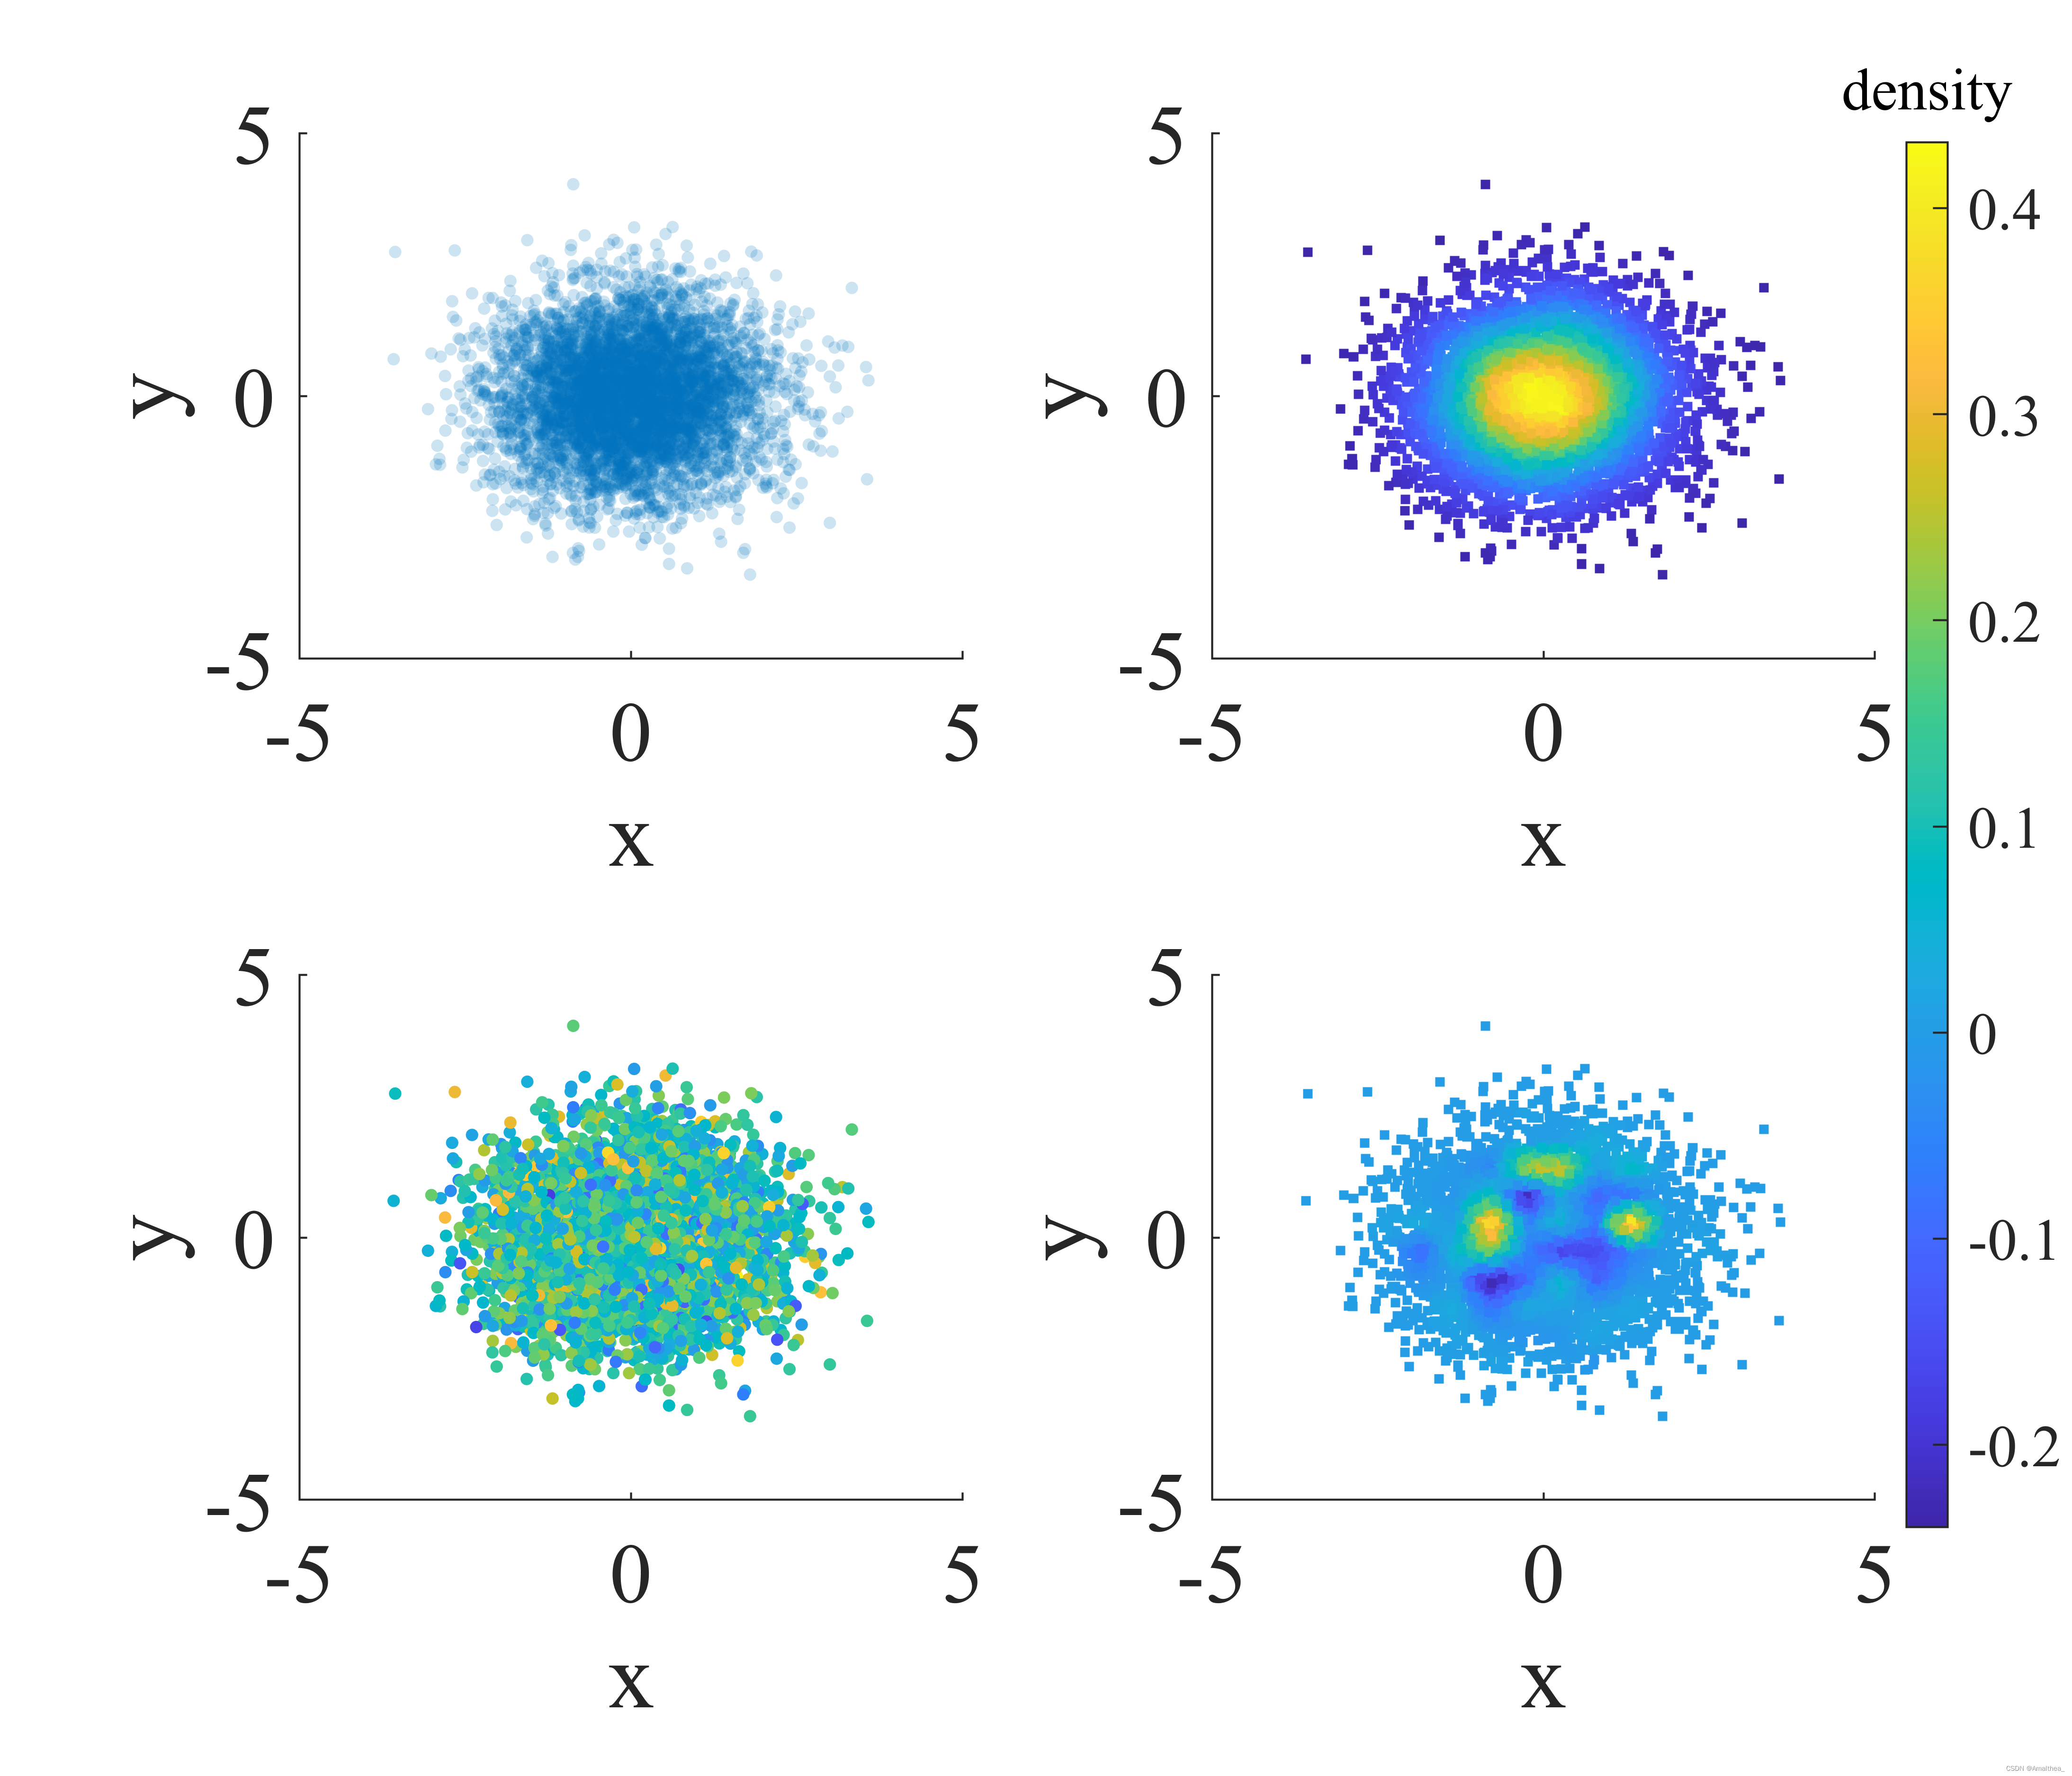
信息:有一个矩阵,每一列分别为每个粒子x、y二维坐标、权重。
目标:形成散点密度图,颜色代表散点的密度。
clear;
M = randn(5000,3);    %生成矩阵
x = M(:,1);
y = M(:,2);
weight = M(:,3);
figure;

subplot(2,2,1);
scatter(x,y,10,'filled','MarkerEdgeAlpha',.2,'MarkerFaceAlpha',.2);
xlim([-5 5]);ylim([-5 5]);
xlabel('x');ylabel('y');

subplot(2,2,3);
scatter(x,y,10,weight,'filled');
% colorbar;
xlim([-5 5]);ylim([-5 5]);
xlabel('x');ylabel('y');

subplot(2,2,2);
n = 20;    %把空间划分为20*20的网格计算核密度
XList=linspace(-5,5,n);
YList=linspace(-5,5,n);
[XMesh,YMesh]=meshgrid(XList,YList);
F=ksdensity([x,y],[XMesh(:),YMesh(:)]);
ZMesh=reshape(F,size(XMesh));
H=interp2(XMesh,YMesh,ZMesh,x,y);
scatter(x,y,'s','filled','SizeData',10,'CData',H);
xlim([-5 5]);ylim([-5 5]);
xlabel('x');ylabel('y');

subplot(2,2,4);
n = 20;    %把空间划分为20*20的网格计算核密度
XList=linspace(-5,5,n);
YList=linspace(-5,5,n);
[XMesh,YMesh]=meshgrid(XList,YList);
dx = 10/100;
count = 1;
M1 = [];M2 = [];M3 = [];
for i = 1:n
    row = find(M(:,1)>=XList(i)-0.5*dx & M(:,1)<XList(i)+0.5*dx);
    for j = 1:n
        [m2,n2] = find(M([row],2)>= YList(j)-0.5*dx & M([row],2)<YList(j)+0.5*dx);
        M1(j) = sum(M(m2,3));
    end
    M2(count,:) = M1;
    count = count+1;
end

F=ksdensity([x,y],[XMesh(:),YMesh(:)]);
ZMesh=reshape(F,size(XMesh)).*M2.';
H=interp2(XMesh,YMesh,ZMesh,x,y);
scatter(x,y,'s','filled','SizeData',10,'CData',H);
xlim([-5 5]);ylim([-5 5]);
xlabel('x');ylabel('y');

h=colorbar('eastoutside','fontsize',15);
set(get(h,'Title'),'string','density','fontsize',15);
set(h,'Position', [0.92 0.14 0.02 0.78]);
set(gcf,'Position',[100 100 700 600]);

print(gcf, '-dpng', '-r600','density.jpg')


 1万+
1万+


 被折叠的 条评论
为什么被折叠?
被折叠的 条评论
为什么被折叠?
 到【灌水乐园】发言


