


话不多说,能进来看我这篇文章的,肯定都知道凸包问题是啥问题,我就不仔细介绍了,这是它的百度百科。
然后说说这玩意怎么搞:
说说我的思路:
既然说是蛮力法,那么就不考虑那么多花里胡哨的东西,直接暴力上:
先随机生成N点集:
def rand_point_set(n, range_min=0, range_max=101):
    """
    随机生成具有 n 个点的点集
    :param range_max: 生成随机点最小值,默认 0
    :param range_min: 生成随机点最大值,默认 100
    :param n: int
    :return: list [(x1,y1)...(xn,yn)]
    """
    try:
        return list(zip([random.uniform(range_min, range_max) for _ in range(n)],
                        [random.uniform(range_min, range_max) for _ in range(n)]))
    except IndexError as e:
        print("\033[31m" + ''.join(e.args) + "\n输入范围有误!" + '\033[0m')
将这个点集[(x1,y1),(x2,y2)…(xn,yn)]中的所有点两两连线,判断除了这两个点之外的所有点是否在这条直线的一侧,如果在,就说明这条直线是边界。

利用numpy可以计算这种行列式,
np.linalg.det([[x1, y1, 1],
               [x2, y2, 1],
               [x3, y3, 1]])
但是这种方法是有问题的,我不知道为啥。请看:

这块我是一脸懵逼啊…
不知道咋回事,如果有大佬知道,也可以评论或私聊教教渣渣我…
所以我就用了最直接的方法判断一个点在一条直线的👈还是👉:
def is_one_side(a, b, c):
    """
    判断一个点在一条直线的左边还是右边
    判断点 C(x3,y3) 在直线 AB 的左边还是右边
                     [ 其中 A(x1,y1), B(x2,y2) ]
    计算此三阶行列式:
    | x1 y1 1 |
    | x2 y2 1 | = x1y2 + x3y1 + x2y3 - x3y2 - x2y1 - x1y3
    | x3 y3 1 |
    当上式结果为正时, C 在 AB 左侧
             为负时, C 在 AB 右侧
    :return: 如果点 C 在直线 AB 左侧,返回 True
             否则  返回 False
    """
    x1, y1 = a
    x2, y2 = b
    x3, y3 = c
    number = x1 * y2 + x3 * y1 + x2 * y3 - x3 * y2 - x2 * y1 - x1 * y3
    if x1 == x2 == x3 or y1 == y2 == y3 or a == c or b == c:
        number = 0
    return number
如果说这个点集有N个点,那么将个点集中的点两两组合可以连出 N*(N-1)/2 种线,然后我们就按照上面诉说的方法进行遍历得出边界线集合:
def combin_line(lists):
    """
    蛮力法输出边界边集
    :param lists:
    :return: list [( , )...( , )]
    """
    lists.sort()
    list_border_line = []  # 边集
    for i in lists:
        for j in lists[lists.index(i) + 1:]:
            count_left = 0
            count_right = 0
            for k in lists:
                if k == i or k == j:
                    continue
                else:
                    if is_one_side(i, j, k) > 0:
                        count_left += 1
                    if is_one_side(i, j, k) < 0:
                        count_right += 1
                    if is_one_side(i, j, k) == 0:
                        pass
            if count_right != 0 and count_left != 0:
                pass
            else:
                list_border_line.append((i, j))
    return list_border_line
注意到那三重循环了吗,这就是蛮力法的精髓:一言不合就循环 …(简单粗暴,不多BB)
不过这也是它的可怕之处,正因为这三重循环,凸包问题蛮力法的时间复杂度达到了 O(n3)!
言归正传,
接下来我们利用上面得出来的边集得出点集并顺时针输出:
def combine_point(list_border_line):
    """
    返回顺时针边界点集
    !!!注意,这个函数和matplotlib画图完全没关系!!!
    只是为了让大家方便看到顺时针输出的点集
    不要这个函数完全没问题
    因为我用matplotlib画图是根据上一个函数直接画线的,没有用到这个点集
    :param list_border_line: 边集
    :return: list [( , )...( , )]
    """
    list_border_point = []
    for _ in list_border_line:
        a, b = _
        list_border_point.append(a)
        list_border_point.append(b)
    list_border_point = sorted(list(set(list_border_point)))  # 有序边界点
    first_x, first_y = list_border_point[0]  # 最左边的点
    last_x, last_y = list_border_point[-1]  # 最右边的点
    list_border_up = []  # 上半边界
    for item in list_border_point:
        x, y = item
        if y > max(first_y, last_y):
            list_border_up.append(item)
        if min(first_y, last_y) < y < max(first_y, last_y):
            if is_one_side(list_border_point[0], list_border_point[-1], item) > 0:
                list_border_up.append(item)
            else:
                continue
    list_border_down = [_ for _ in list_border_point if _ not in list_border_up]  # 下半边界
    list_end = list_border_up + list_border_down[::-1]  # 最终顺时针输出的边界点
    return list_end
然后根据所得的边集、点集用matplotlib画图:
def draw(list_all, list_border):
    """
    画图
    :param list_all: 所有点集
    :param list_border: 所有边集
    :return: picture
    """
    list_all_x = []
    list_all_y = []
    for item in list_all:
        a, b = item
        list_all_x.append(a)
        list_all_y.append(b)
    for item in list_border:
        item_1, item_2 = item
    #  横坐标,纵坐标
        one_, oneI = item_1
        two_, twoI = item_2
        plt.plot([one_, two_], [oneI, twoI])
    plt.scatter(list_all_x, list_all_y)
    plt.show()
最后写一个输入函数:
因为我的随机点集生成函数 rand_point_set(n, range_min=0, range_max=101) 指定的后两个参数是用来选择生成点集范围的,所以,这是我的输入函数:
def main():
    """
    :return: 所有点
    """
    inputs = list(map(int, input().split()))
    if len(inputs) == 1:
        return rand_point_set(inputs[0])
    elif len(inputs) == 2:
        return rand_point_set(inputs[0], inputs[1])
    elif len(inputs) == 3:
        return rand_point_set(inputs[0], inputs[1], inputs[2])
    else:
        print("\033[31m输入数据太多,请重新输入!\033[0m")
        main()
好啦,完啦!
最后把这些函数组合起来,
我把完整代码(复制可用的那种)贴到这里:
import random
import numpy as np
import matplotlib.pyplot as plt


def is_one_side(a, b, c):
    """
    判断一个点在一条直线的左边还是右边
    判断点 C(x3,y3) 在直线 AB 的左边还是右边
                     [ 其中 A(x1,y1), B(x2,y2) ]
    计算此三阶行列式:
    | x1 y1 1 |
    | x2 y2 1 | = x1y2 + x3y1 + x2y3 - x3y2 - x2y1 - x1y3
    | x3 y3 1 |
    当上式结果为正时, C 在 AB 左侧
             为负时, C 在 AB 右侧
    :return: 如果点 C 在直线 AB 左侧,返回 True
             否则  返回 False
    """
    x1, y1 = a
    x2, y2 = b
    x3, y3 = c
    number = x1 * y2 + x3 * y1 + x2 * y3 - x3 * y2 - x2 * y1 - x1 * y3
    if x1 == x2 == x3 or y1 == y2 == y3 or a == c or b == c:
        number = 0
    return number
    """
    return np.linalg.det([[x1, y1, 1],
                          [x2, y2, 1],
                          [x3, y3, 1]])
    这种方法按理说也可以,但是不知道为啥,有问题...比如:
    np.linalg.det([[1, 1, 1],
                   [2, 2, 1],
                   [3, 3, 1]])
    这种方法算这个玩意是不等于 0 的,不知道为啥...
    """


def rand_point_set(n, range_min=0, range_max=101):
    """
    随机生成具有 n 个点的点集
    :param range_max: 生成随机点最小值,默认 0
    :param range_min: 生成随机点最大值,默认 100
    :param n: int
    :return: list [(x1,y1)...(xn,yn)]
    """
    try:
        return list(zip([random.uniform(range_min, range_max) for _ in range(n)],
                        [random.uniform(range_min, range_max) for _ in range(n)]))
    except IndexError as e:
        print("\033[31m" + ''.join(e.args) + "\n输入范围有误!" + '\033[0m')


def combine_line(lists):
    """
    蛮力法输出边界边集
    :param lists:
    :return: list [( , )...( , )]
    """
    lists.sort()
    list_border_line = []  # 边集
    for i in lists:
        for j in lists[lists.index(i) + 1:]:
            count_left = 0
            count_right = 0
            for k in lists:
                if k == i or k == j:
                    continue
                else:
                    if is_one_side(i, j, k) > 0:
                        count_left += 1
                    if is_one_side(i, j, k) < 0:
                        count_right += 1
                    if is_one_side(i, j, k) == 0:
                        pass
            if count_right != 0 and count_left != 0:
                pass
            else:
                list_border_line.append((i, j))
    return list_border_line


def combine_point(list_border_line):
    """
    返回顺时针边界点集
    !!!注意,这个函数和matplotlib画图完全没关系!!!
    只是为了让大家方便看到顺时针输出的点集
    不要这个函数完全没问题
    因为我用matplotlib画图是根据上一个函数直接画线的,没有用到这个点集
    :param list_border_line: 边集
    :return: list [( , )...( , )]
    """
    list_border_point = []
    for _ in list_border_line:
        a, b = _
        list_border_point.append(a)
        list_border_point.append(b)
    list_border_point = sorted(list(set(list_border_point)))  # 有序边界点
    first_x, first_y = list_border_point[0]  # 最左边的点
    last_x, last_y = list_border_point[-1]  # 最右边的点
    list_border_up = []  # 上半边界
    for item in list_border_point:
        x, y = item
        if y > max(first_y, last_y):
            list_border_up.append(item)
        if min(first_y, last_y) < y < max(first_y, last_y):
            if is_one_side(list_border_point[0], list_border_point[-1], item) > 0:
                list_border_up.append(item)
            else:
                continue
    list_border_down = [_ for _ in list_border_point if _ not in list_border_up]  # 下半边界
    list_end = list_border_up + list_border_down[::-1]  # 最终顺时针输出的边界点
    return list_end


def draw(list_all, list_border):
    """
    画图
    :param list_all: 所有点集
    :param list_border: 所有边集
    :return: picture
    """
    list_all_x = []
    list_all_y = []
    for item in list_all:
        a, b = item
        list_all_x.append(a)
        list_all_y.append(b)
    for item in list_border:
        item_1, item_2 = item
        #  横坐标,纵坐标
        one_, oneI = item_1
        two_, twoI = item_2
        plt.plot([one_, two_], [oneI, twoI])
    plt.scatter(list_all_x, list_all_y)
    plt.show()


def main():
    """
    :return: 所有点
    """
    inputs = list(map(int, input().split()))
    if len(inputs) == 1:
        return rand_point_set(inputs[0])
    elif len(inputs) == 2:
        return rand_point_set(inputs[0], inputs[1])
    elif len(inputs) == 3:
        return rand_point_set(inputs[0], inputs[1], inputs[2])
    else:
        print("\033[31m输入数据太多,请重新输入!\033[0m")
        main()


if __name__ == "__main__":
    print("""输入规则:
最少一个最多三个
后面可以跟数字用来指定生成区间(默认[0,100]),中间用空格隔开
例如:
    输入 10   ---即为在默认区间[0,100]生成10个随机点
    输入 10 50   ---即为在区间[50,100]生成10个随机点
    输入 10 50 200   ---即为在区间[50,200]生成10个随机点
请输入:\t""")
    list_points = main()  # 所有点
    # print(combine_point(combine_line(list_points)))  # 顺时针输出边界点
    draw(list_points, combine_line(list_points))
最后的话…再…
本来打算发布文章了,但是一看代码,咦,结果跑出来了?!
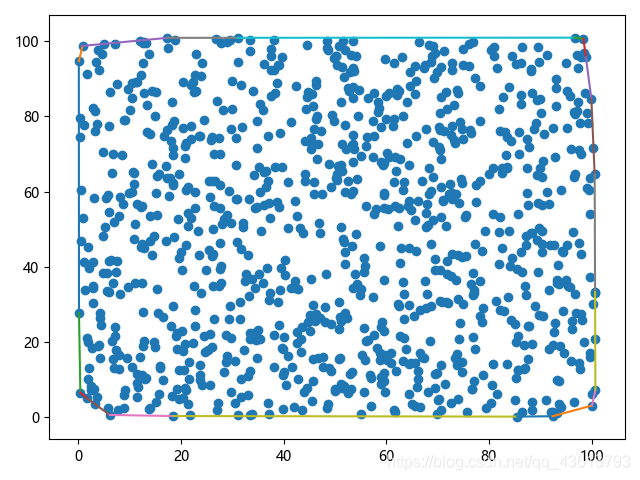
其实吧…本来我也没想着写这篇文章的,主要是因为我写完这个程序后闲的,想让它跑一个1000个点的,结果等了一会发现还没跑完…等着太无聊了,我就开始写这篇博客,中间还上了个厕所…刚写完准备发布文章时,回去一看,正好,我目睹了它出结果的一瞬间!😄 那就把1000个点的结果贴出来吧(PS:粗略计算,这1000个点的例子在我电脑上大概跑了20分钟(正因为那恐怖的 O(n3))! 所以一个良好的算法的重要性从这里也可窥一斑)
PS:
写了这篇文章之后,第二天我又写了一个蛮力法姊妹篇 | Python分治法解决凸包问题并用matplotlib实现可视化以及与蛮力法的对比的,顺便测了一下蛮力法1000个点到底需要多长时间,于是就出现了:…🌚

嗯,确实差不多20分钟了…
然后再看一下同样时间的分治算法:

哦豁!么的说!


 2077
2077


 被折叠的 条评论
为什么被折叠?
被折叠的 条评论
为什么被折叠?
 到【灌水乐园】发言


