


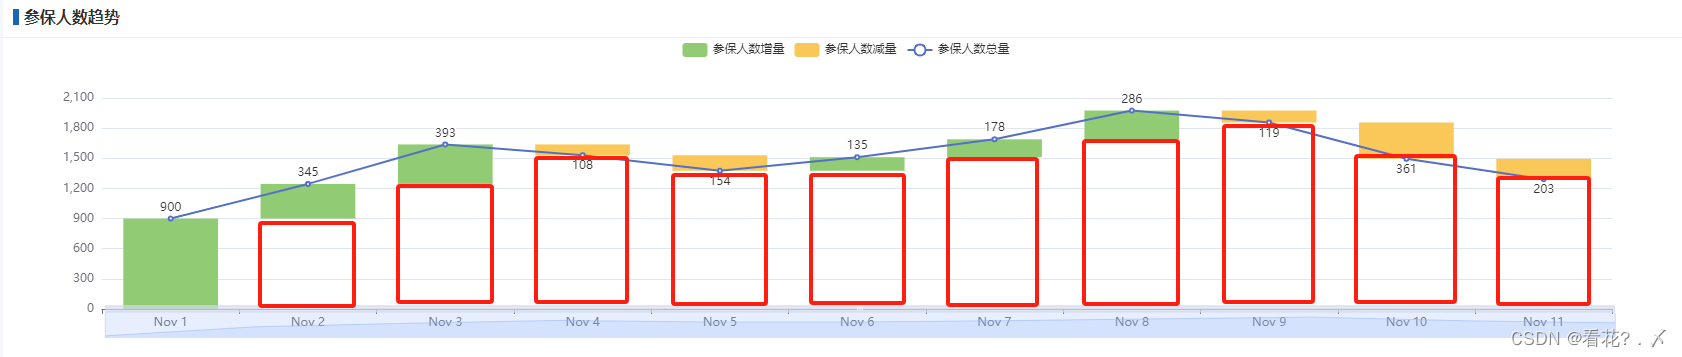
实现了瀑布图趋势图表的可视化展示,包括堆叠柱状图和线图的组合。该组件能够展示数据的增减变化趋势,并通过配置项支持自定义显示方式和交互效果。此外,还提供了数据缩放和平滑滚动的功能。
效果展示
组件代码示例
<template>
  <div class="chart" style="height: 300px;width: 100%">
    <v-chart :option="option" autoresize/>
  </div>
</template>
<script>

export default {
  data() {
    return {
      option: {
        tooltip: {
          trigger: 'axis',
          axisPointer: {
            type: 'shadow'
          },
          formatter: function (params) {
            let tar;
            if (params[1] && params[1].value !== '-') {
              tar = params[1];
            } else {
              tar = params[2];
            }
            return tar && tar.name + '<br/>' + tar.seriesName + ' : ' + tar.value;
          }
        },
        legend: {
          data: [this.addName, this.subName,this.totalName]
        },
        grid: {
          left: '3%',
          right: '4%',
          bottom: '3%',
          containLabel: true
        },
        xAxis: {
          type: 'category',
          data: this.xAxisData
        },
        yAxis: {
          type: 'value'
        },
        dataZoom: [
          {
            // 设置滚动条的隐藏与显示
            show: true,
            // 设置滚动条类型
            type: "slider",
            // 设置背景颜色
            // backgroundColor: "rgb(19, 63, 100)",
            // 设置选中范围的填充颜色
            // fillerColor: "rgb(16, 171, 198)",
            // 设置边框颜色
            // borderColor: "rgb(19, 63, 100)",
            // 是否显示detail,即拖拽时候显示详细数值信息
            showDetail: false,
            // 数据窗口范围的起始数值
            // startValue: 0,
            // 数据窗口范围的结束数值(一页显示多少条数据)
            // endValue: 5,
            // empty:当前数据窗口外的数据,被设置为空。
            // 即不会影响其他轴的数据范围
            filterMode: "empty",
            // 设置滚动条宽度,相对于盒子宽度
            // width: "50%",
            // 设置滚动条高度
            // height: 8,
            // 设置滚动条显示位置
            // left: "center",
            // 是否锁定选择区域(或叫做数据窗口)的大小
            zoomLoxk: true,
            // 控制手柄的尺寸
            handleSize: 0,
            // dataZoom-slider组件离容器下侧的距离
            bottom: 3,
          },
          {
            // 没有下面这块的话,只能拖动滚动条,
            // 鼠标滚轮在区域内不能控制外部滚动条
            type: "inside",
            // 滚轮是否触发缩放
            zoomOnMouseWheel: false,
            // 鼠标滚轮触发滚动
            moveOnMouseMove: true,
            moveOnMouseWheel: true,
          },
        ],
        series: [
          {
            name: 'Placeholder',
            type: 'bar',
            stack: 'Total',
            silent: true,
            itemStyle: {
              borderColor: 'transparent',
              color: 'transparent'
            },
            emphasis: {
              itemStyle: {
                borderColor: 'transparent',
                color: 'transparent'
              }
            },
            data: this.getChartData(this.seriesData).placeholderData
          },
          {
            name: this.totalName,
            type: 'line',
            // label: {
            //   show: true,
            //   position: 'top'
            // },
            data: this.seriesData
          },
          {
            name: this.addName,
            type: 'bar',
            stack: 'Total',
            label: {
              show: true,
              position: 'top'
            },
            data: this.getChartData(this.seriesData).addData
          },
          {
            name: this.subName,
            type: 'bar',
            stack: 'Total',
            label: {
              show: true,
              position: 'bottom'
            },
            data: this.getChartData(this.seriesData).subData
          }
        ]
      }
    }
  },
  props:{
  	// 增量数据名称
    addName:{
      type:String,
      default:''
    },
    // 减量数据名称
    subName:{
      type:String,
      default:''
    },
    // 总量数据名称
    totalName:{
      type:String,
      default:''
    },
    // echarts series数据 传入数组为总量数据数组
    seriesData:{
      type:Array,
      default(){
        return [900, 1245, 1638, 1530, 1376, 1511, 1689, 1975, 1856, 1495, 1292]
      }
    },
    // x轴数据
    xAxisData:{
      type:Array,
      default(){
        let list = [];
        for (let i = 1; i <= 11; i++) {
          list.push('Nov ' + i);
        }
        return list;
      }
    }
  },
  computed:{

  },
  methods:{
    getChartData(originData) {
      const placeholderData = [0];   // 占位的透明柱子即红色框框区域
      const addData = [originData[0]]; // 增量绿色区域
      const subData = ['-']; // 减量黄色区域
      originData.forEach((item, inx) => {
        if (inx !== originData.length -1){
          const diffVal = originData[inx + 1] - item;
          if (diffVal > 0) {
            placeholderData.push(item);
            addData.push(diffVal);
            subData.push('-');
          } else {
            placeholderData.push(item + diffVal)
            addData.push('-');
            subData.push(Math.abs(diffVal));
          }
        }
      })
      return {placeholderData, addData, subData}
    }
  }
}
</script>
更改后代码
经过调试发现从接口获取数据后,调用子组件,发现echarts图表不展示,后台接口数据是有的,但是图表还是空,经过排查,echarts在获取动态数据之后需要重新加载,更改后代码如下
<template>
  <div style="height: 300px;width: 100%" ref="echartsRef">
    <v-chart autoresize/>
  </div>
</template>
<script>
import * as echarts from 'echarts'
export default {
  data() {
    return {

    }
  },
  props:{
    addName:{
      type:String,
      default:''
    },
    subName:{
      type:String,
      default:''
    },
    totalName:{
      type:String,
      default:''
    },
    seriesData:{
      type:Array,
      default(){
        return []
      }
    },
    xAxisData:{
      type:Array,
      default(){
        let list = [];
        // for (let i = 1; i <= 11; i++) {
        //   list.push('Nov ' + i);
        // }
        return list;
      }
    }
  },
  watch:{
    chartData(val){
      if(val){
        this.getReData()
      }
    }
  },
  mounted(){
    this.getReData();
  },
  computed:{
    chartData(){
      const {xAxisData, seriesData} = this
      return{
        xAxisData, seriesData
      }
    }
  },
  methods:{
    getChartData(originData) {
      const placeholderData = [0];
      const addData = [originData[0]];
      const subData = ['-'];
      originData.forEach((item, inx) => {
        if (inx !== originData.length -1){
          const diffVal = originData[inx + 1] - item;
          if (diffVal > 0) {
            placeholderData.push(item);
            addData.push(diffVal);
            subData.push('-');
          } else {
            placeholderData.push(item + diffVal)
            addData.push('-');
            subData.push(Math.abs(diffVal));
          }
        }
      })
      return {placeholderData, addData, subData}
    },
    /**
     * 解决父组件传值,echarts不能渲染回显的问题
     */
    getReData(){
      let myChart = echarts.init(this.$refs.echartsRef);
      myChart.clear()
      myChart.setOption({
        tooltip: {
          trigger: 'axis',
          axisPointer: {
            type: 'shadow'
          },
          formatter: function (params) {
            let tar;
            if (params[1] && params[1].value !== '-') {
              tar = params[1];
            } else {
              tar = params[2];
            }
            return tar && tar.name + '<br/>' + tar.seriesName + ' : ' + tar.value;
          }
        },
        legend: {
          data: [this.addName, this.subName,this.totalName]
        },
        grid: {
          left: '3%',
          right: '4%',
          bottom: '3%',
          containLabel: true
        },
        xAxis: {
          type: 'category',
          data: this.xAxisData
        },
        yAxis: {
          type: 'value'
        },
        dataZoom: [
          {
            // 设置滚动条的隐藏与显示
            show: true,
            // 设置滚动条类型
            type: "slider",
            // 设置背景颜色
            // backgroundColor: "rgb(19, 63, 100)",
            // 设置选中范围的填充颜色
            // fillerColor: "rgb(16, 171, 198)",
            // 设置边框颜色
            // borderColor: "rgb(19, 63, 100)",
            // 是否显示detail,即拖拽时候显示详细数值信息
            showDetail: false,
            // 数据窗口范围的起始数值
            // startValue: 0,
            // 数据窗口范围的结束数值(一页显示多少条数据)
            // endValue: 5,
            // empty:当前数据窗口外的数据,被设置为空。
            // 即不会影响其他轴的数据范围
            filterMode: "empty",
            // 设置滚动条宽度,相对于盒子宽度
            // width: "50%",
            // 设置滚动条高度
            // height: 8,
            // 设置滚动条显示位置
            // left: "center",
            // 是否锁定选择区域(或叫做数据窗口)的大小
            zoomLoxk: true,
            // 控制手柄的尺寸
            handleSize: 0,
            // dataZoom-slider组件离容器下侧的距离
            bottom: 3,
          },
          {
            // 没有下面这块的话,只能拖动滚动条,
            // 鼠标滚轮在区域内不能控制外部滚动条
            type: "inside",
            // 滚轮是否触发缩放
            zoomOnMouseWheel: false,
            // 鼠标滚轮触发滚动
            moveOnMouseMove: true,
            moveOnMouseWheel: true,
          },
        ],
        series: [
          {
            name: 'Placeholder',
            type: 'bar',
            stack: 'Total',
            silent: true,
            itemStyle: {
              borderColor: 'transparent',
              color: 'transparent'
            },
            emphasis: {
              itemStyle: {
                borderColor: 'transparent',
                color: 'transparent'
              }
            },
            data: this.getChartData(this.seriesData).placeholderData
          },
          {
            name: this.totalName,
            type: 'line',
            // label: {
            //   show: true,
            //   position: 'top'
            // },
            data: this.seriesData
          },
          {
            name: this.addName,
            type: 'bar',
            stack: 'Total',
            label: {
              show: true,
              position: 'top'
            },
            data: this.getChartData(this.seriesData).addData
          },
          {
            name: this.subName,
            type: 'bar',
            stack: 'Total',
            label: {
              show: true,
              position: 'bottom'
            },
            data: this.getChartData(this.seriesData).subData
          }
        ]
      })
      this.$nextTick(()=>{
          myChart.resize();
      })
    }
  }
}
</script>
调用示例
<waterfall-trend-chart :add-name="'缴费金额增量'" :sub-name="'缴费金额减量'" :total-name="'缴费金额总量'"/>```


 1692
1692

 被折叠的 条评论
为什么被折叠?
被折叠的 条评论
为什么被折叠?
 到【灌水乐园】发言


