


简介
golang性能分析工具pprof的8个指标
1.性能分析的5个方面:CPU、内存、I/O、goroutine(协程使用情况和泄漏检查)、死锁检测以及数据竟态分析
	runtime.SetMutexProfileFraction(1) //开启对锁调用的跟踪 mutex
	runtime.SetBlockProfileRate(1)     //开启对阻塞操作的跟踪
2.两种程序性能指标采集
runtime/pprof:采集工具型应用运行数据进行分析
net/http/pprof:采集服务型应用运行时数据进行分析
pprof开启后,每隔一段时间(10ms)就会收集下当前的堆栈信息,获取各个函数占用的CPU以及内存资源;最后通过对这些采样数据进行分析,形成一个性能分析报告。
3.交互式终端性能分析
不管是工具型应用还是服务型应用,我们使用相应的pprof库获取数据之后,下一步的都要对这些数据进行分析,我们可以使用go tool pprof命令行工具。
go tool pprof [binary] [source]
#binary是应用的二进制文件,用来解析各种符号
#source标识profile数据的来源,可以是本地的文件,也可以是http地址
4.web网页性能分析
如果你的应用程序是一直运行的,比如 web 应用,那么可以使用net/http/pprof库,它能够在提供   HTTP 服务进行分
析。
如果使用了默认的http.DefaultServeMux(通常是代码直接使用 http.ListenAndServe(“0.0.0.0:8000”,  nil)),只需要
在你的web server端代码中按如下方式导入net/http/pprof
如果你使用自定义的 Mux,则需要手动注册一些路由规则:
r.HandleFunc("/debug/pprof/", pprof.Index)
r.HandleFunc("/debug/pprof/cmdline", pprof.Cmdline)
r.HandleFunc("/debug/pprof/profile", pprof.Profile)
r.HandleFunc("/debug/pprof/symbol", pprof.Symbol)
r.HandleFunc("/debug/pprof/trace", pprof.Trace)
如果你使用的是gin框架,那么推荐使用github.com/gin-contrib/pprof,在代码中通过以下命令注册pprof相关路由。
pprof.Register(router)
访问地址:http://host:port/debug/pprof会出现性能分析的网页
这个路径下还有几个子页面:
/debug/pprof/profile:访问这个链接会自动进行 CPU profiling,持续 30s,并生成一个文件供下载
/debug/pprof/heap: Memory Profiling 的路径,访问这个链接会得到一个内存 Profiling 结果的文件
/debug/pprof/block:block Profiling 的路径
/debug/pprof/goroutines:运行的 goroutines 列表,以及调用关系
runtime/pprof的使用
代码:
package main

import (
	"flag"
	"fmt"
	"os"
	"runtime/pprof"
	"time"
)

func logicCode() {
	var c chan int
	for {
		select {
		case v := <-c:
			fmt.Printf("recv from chan, value:%v\n", v)
		default:

		}
	}
}

func main() {
	var isCPUPprof bool
	var isMemPprof bool

	flag.BoolVar(&isCPUPprof, "cpu", false, "turn cpu pprof on")
	flag.BoolVar(&isMemPprof, "mem", false, "turn mem pprof on")
	flag.Parse()

	if isCPUPprof {
		file, err := os.Create("./cpu.pprof")
		if err != nil {
			fmt.Println("create cpu pprof failed,err:", err)
			return
		}
		pprof.StartCPUProfile(file)
		defer file.Close()
		defer pprof.StopCPUProfile()
	}
	for i := 0; i < 8; i++ {
		go logicCode()
	}
	time.Sleep(20 * time.Second)
	if isMemPprof {
		file, err := os.Create("./mem.pprof")
		if err != nil {
			fmt.Println("create mem pprof failed,err:", err)
			return
		}
		pprof.WriteHeapProfile(file)
		file.Close()
	}
}
命令行交互
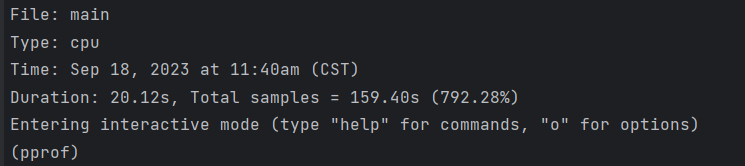
使用go工具链里的pprof来进行分析
go tool pprof cpu.pprof
#go tool pprof http://127.0.0.1:8000/debug/pprof/profile
topN来获取占用CPU前几位的函数:
top3 #获取占用CPU前3位的函数
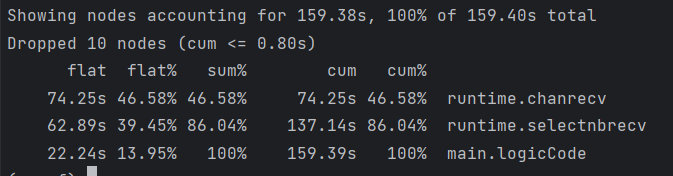
flat:当前函数占用CPU的耗时
flat%:当前函数占用CPU耗时占总CPU耗时的百分比
sum%:函数占用CPU的耗时累计百分比
cum:当前函数加上当前函数调用函数占用CPU的总耗时
cum %:当前函数加上当前函数调用函数占用CPU总耗时百分比
最后一列:函数的名称
list 函数名,查看具体的函数分析
list logicCode
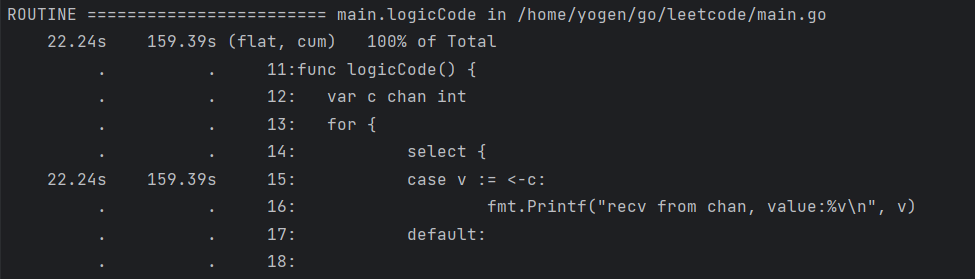
可以看出函数的所有耗时都在 case v:=<-c这条语句的执行中。
网络服务性能分析
package main

import (
	"fmt"
	"net/http"
	_ "net/http/pprof"
	"strings"
)

func main() {
	http.HandleFunc("/hello", func(w http.ResponseWriter, r *http.Request) {
		r.ParseForm()
		fmt.Println(r.Form)
		fmt.Println("path:", r.URL.Path)
		fmt.Println("scheme:", r.URL.Scheme)
		for k, v := range r.Form {
			fmt.Println("key:", k)
			fmt.Println("val:", strings.Join(v, ""))
		}
		w.Write([]byte("hello world"))
	})
	http.ListenAndServe("127.0.0.1:8080", nil)
}
第一种方式:
#分析5s内对应服务的性能
go tool pprof -seconds=5 http://127.0.0.1:8080/debug/pprof/profile
#go tool pprof -seconds=5 http://127.0.0.1:8080/debug/pprof/heap
第二种方式:
下载原始数据文件到XXX-X.out目录,对于一些需要累计到一些时间才能采集的指标,我们可以使用?seconds=X来设置
curl -o XXX-X.out http://127.0.0.1:8080/debug/pprof/XXX?seconds=X
#获取10s内内存的使用情况
curl -o profile.out http://127.0.0.1:8080/debug/pprof/heap?seconds=10
go tool pprof profile.out
对gin服务进行性能分析
package main

import (
	"fmt"
	"github.com/gin-contrib/pprof"
	"github.com/gin-gonic/gin"
)

func main() {
	r := gin.Default()
	r.GET("/hello", func(c *gin.Context) {
		var ch chan int
		select {
		case v := <-ch:
			fmt.Println(v)
		default:

		}
	})
	pprof.Register(r)
	r.Run()
}
访问网址:http://localhost:8080/debug/pprof
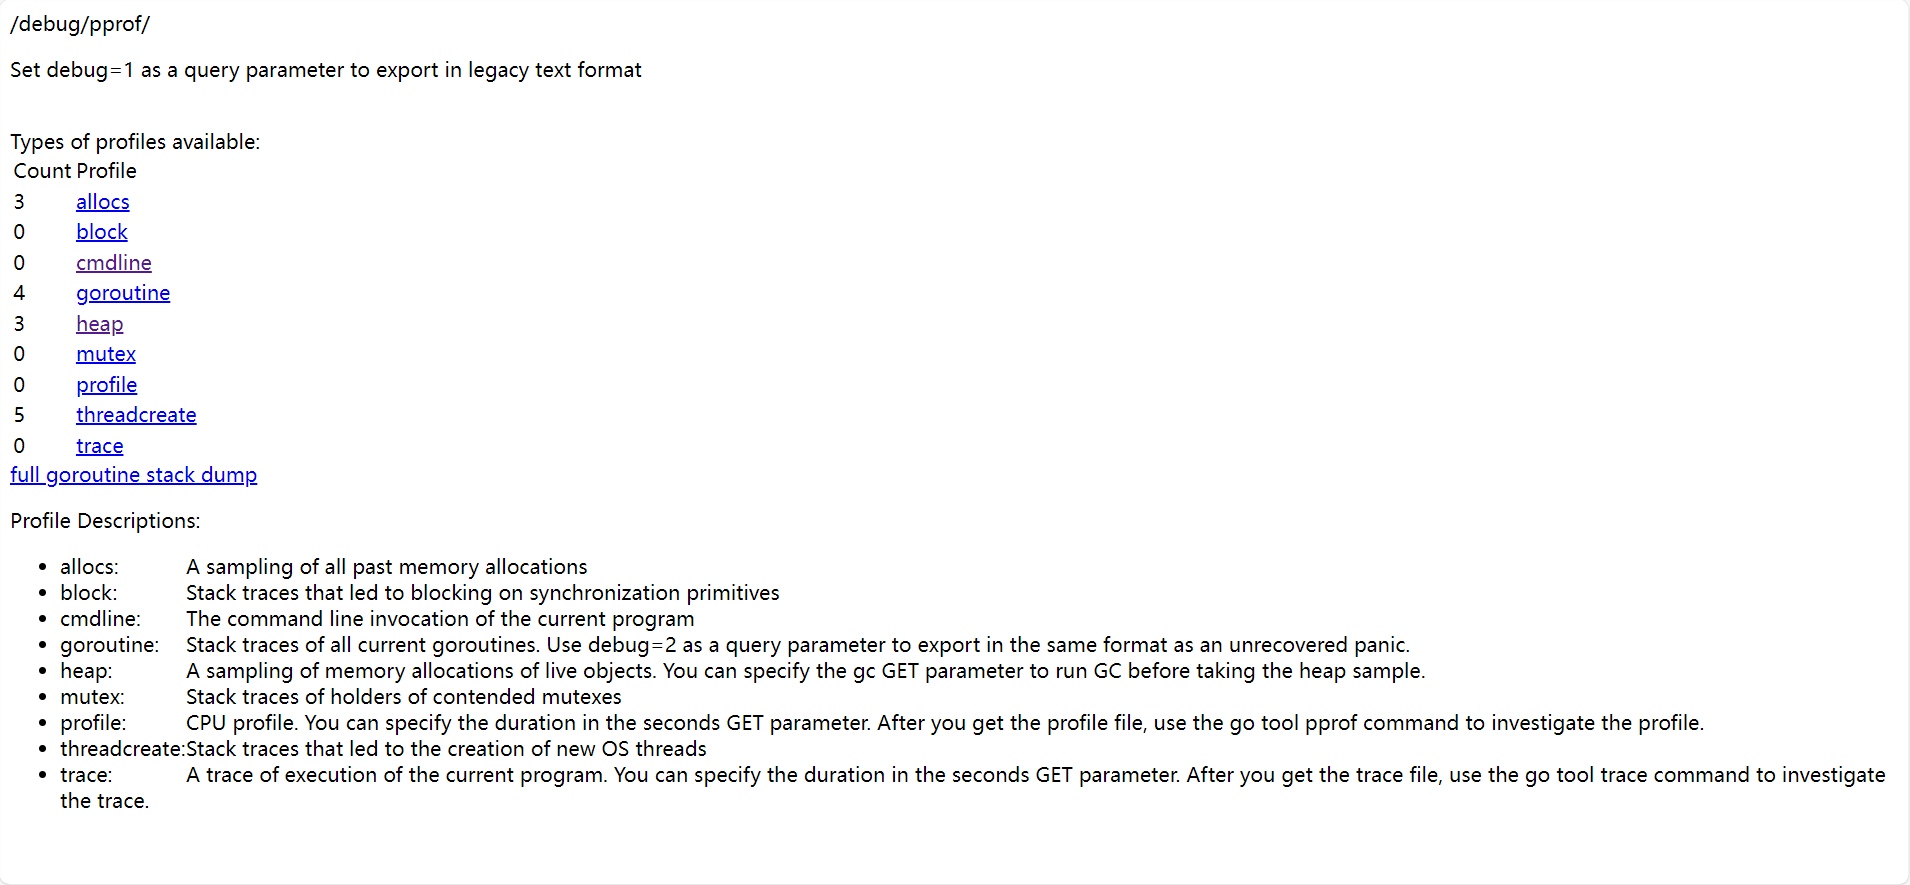
3 allocs:表示过去进行过3次内存分配
0 block:表示0个阻塞
0 cmdline:执行的命令行
4 goroutine:创建的goroutine数量
3 heap:3个活动中的对象内存分配情况
0 mutex:当前锁竞争的数量
0 profile:cpu使用情况进行采用,默认采样30s,后面加参数seconds=60来指定时间
5 threadcreate:线程的创建数
0 trace:整个程序的运行过程的跟踪
pprof与性能测试结合
go test命令有两个参数和pprof相关,它们分别指定生成的CPU和Memory profiling保存的文件
-cpuprofile: cpu profiling数据要保存的文件地址
-memprofile:memory profiling数据要保存的文件地址
go test -bench . -cpuprofile=cpu.prof

go test -bench . -memprofile=./mem.prof


go test -bench . -blockprofile=./block.prof
压测工具go-wrk
go-wrk的包的下载
go get github.com/adeven/go-wrk
go-wrk的使用格式
go-wrk [flags] url
常用参数:
-H="User-Agent: go-wrk 0.1 bechmark\nContent-Type: text/html;": 由'\n'分隔的请求头
-c=100: 使用的最大连接数
-k=true: 是否禁用keep-alives
-i=false: if TLS security checks are disabled
-m="GET": HTTP请求方法
-n=1000: 请求总数
-t=1: 使用的线程数
-b="" HTTP请求体
-s="" 如果指定,它将计算响应中包含搜索到的字符串s的频率
go-wrk -t=8 -c=100 -n=10000 "http://127.0.0.1:8080/api/v1/posts?size=10"
输出结果
==========================BENCHMARK==========================
URL:                            http://127.0.0.1:8080/api/v1/posts?size=10

Used Connections:               100
Used Threads:                   8
Total number of calls:          10000

===========================TIMINGS===========================
Total time passed:              2.74s
Avg time per request:           27.11ms
Requests per second:            3644.53
Median time per request:        26.88ms
99th percentile time:           39.16ms
Slowest time for request:       45.00ms

=============================DATA=============================
Total response body sizes:              340000
Avg response body per request:          34.00 Byte
Transfer rate per second:               123914.11 Byte/s (0.12 MByte/s)
==========================RESPONSES==========================
20X Responses:          10000   (100.00%)
30X Responses:          0       (0.00%)
40X Responses:          0       (0.00%)
50X Responses:          0       (0.00%)
Errors:                 0       (0.00%)


 146
146


 被折叠的 条评论
为什么被折叠?
被折叠的 条评论
为什么被折叠?
 到【灌水乐园】发言


