<!-- 卫星地图 -->
<template>
<div class="app">
<div id="containerMap"></div>
</div>
</template>
<script>
import AMapLoader from "@amap/amap-jsapi-loader";
export default {
name: "Map",
data() {
return {
// feature: [],
feature: [
{
geometry: {
type: "Point",
coordinates: [121.413718,31.452154]
},
properties: {
avg: 14.685,
lnglat: "121.413718,31.452154"
}
},
{
geometry: {
type: "Point",
coordinates: [121.42243,31.456456]
},
properties: {
avg: 19.375,
lnglat: "121.42243,31.456456"
}
},
{
geometry: {
type: "Point",
coordinates: [121.417044,31.451752]
},
properties: {
avg: 20.483,
lnglat: "121.417044,31.451752"
}
},
{
geometry: {
type: "Point",
coordinates: [121.413346,31.452939]
},
properties: {
avg: 17.761,
lnglat: "121.413346,31.452939"
}
},
{
geometry: {
type: "Point",
coordinates: [121.427368,31.446047]
},
properties: {
avg: 17.999,
lnglat: "121.427368,31.446047"
}
},
],
// 区域限线数据
wireData: [
[121.420502,31.457726],
[121.422476,31.4593],
[121.426853,31.455127],
[121.432561,31.450001],
[121.427368,31.446047],
[121.421746,31.4511],
[121.416468,31.446963],
[121.42209,31.441617],
[121.428956,31.443777],
[121.421746,31.4511],
[121.424965,31.453589],
[121.420459,31.45758],
[121.420459,31.45758]
],
// 点数据
formsInfo: [
[121.413718,31.452154],
[121.42243,31.456456],
[121.417044,31.451752],
[121.427368,31.446047],
],
stateInfo: [{
code:"123456",
area:"南山区",
type:"监控",
plan:"方案",
site:"站点",
}
],
personnelInfo:{
// name: "张三",
// tel:18846449118,
// gh: 10010,
// areas:"宝山"
}
}
},
created(){ this.initMap() },
mounted() {
this.map();
},
methods: {
async initMap() {
// 热力图层数据
const{ data: res }= await this.$http.get('/main/hetmap')
// this.feature = JSON.parse(res.data.data);
// 信息窗体-设备信息
const { data: resd } = await this.$http.get('/admin/device')
// var list = res.data.data.list;
// var stateInfo=[];
// for(var i in list){
// stateInfo.push( list[i] )
// }
// 信息窗体-人员信息
const { data: rest } = await this.$http.get('/admin/site_edit')
this.personnelInfo = rest.data.data.detail;
console.log(rest)
},
map() {
AMapLoader.load({
key: "输入您的key值",
version: "2.0",
plugins: [],
AMapUI: {
version: "1.1",
plugins: ["overlay/SimpleMarker"],
},
Loca: {
version: "2.0.0",
},
})
.then((AMap) => {
var map = new AMap.Map("containerMap", {
resizeEnable: true,
expandZoomRange:true,
zoom: 20,
pitch: 40,
// rotation: 80,
// scale: 3,
viewMode: "3D",
center: [121.420606,31.451056],
layers: [
new AMap.TileLayer.Satellite(),
new AMap.TileLayer.RoadNet()
],
});
// 信息窗体区域
var lnglats = this.formsInfo;
var infoWindow = new AMap.InfoWindow({offset: new AMap.Pixel(0, -30)});
for (var i = 0, marker; i < lnglats.length; i++) {
var marker = new AMap.Marker({
position: lnglats[i],
map: map
});
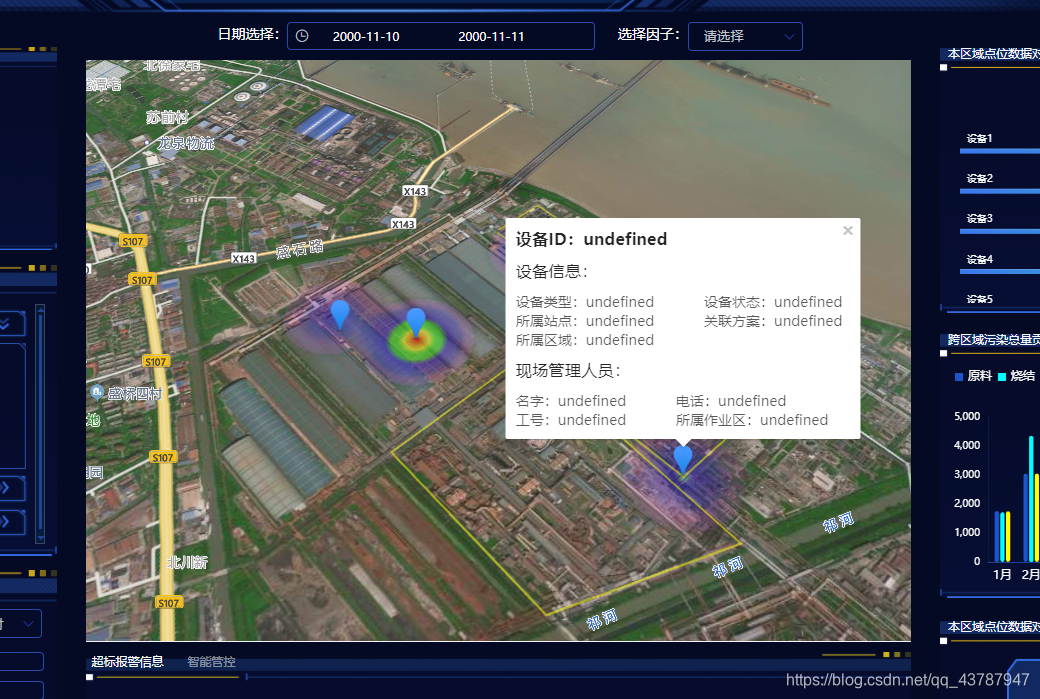
marker.content = '<h3><b>设备ID:' + this.stateInfo.code + '</b></h3>' +
'<h3 style=\"padding:10px 0 10px 0;\">设备信息:</h3><div><span>设备类型:</span>' + this.stateInfo.type + '<span style=\"margin-left:50px;\">设备状态:</span>' + this.stateInfo.status +
'</div><div><span>所属站点:</span>' + this.stateInfo.site + '<span style=\"margin-left:50px;\">关联方案:</span>' + this.stateInfo.plan +
'</div><div><span>所属区域:' + this.stateInfo.area + '</span></div>' +
'<h3 style=\"padding:10px 0 10px 0;\">现场管理人员:</h3>' + '<div><span>名字:</span>' + this.personnelInfo.name + '<span style=\"margin-left:50px;\">电话:</span>' + this.personnelInfo.tel + '</div>' +
'<div><span>工号:</span>' + this.personnelInfo.gh + '<span style=\"margin-left:50px;\">所属作业区:</span>' + this.personnelInfo.area + '</div>'
marker.on('click', markerClick);
marker.emit('click', {target: marker});
}
function markerClick(e) {
infoWindow.setContent(e.target.content);
infoWindow.open(map, e.target.getPosition());
// console.log(e)
}
map.setFitView();
// 线区域
var path = this.wireData;
var polyline = new AMap.Polyline({
path: path,
strokeColor: '#f9f909',
});
map.add(polyline)
// 热力图层区域
var loca = new Loca.Container({
map,
});
var geo = new Loca.GeoJSONSource({
data: {
"type": "FeatureCollection",
"features": this.feature
},
});
var heatmap = new Loca.HeatMapLayer({
loca,
zIndex: 10,
opacity: 0.7,
visible: true,
zooms: [2, 22],
blend: 'lighter',
});
heatmap.setSource(geo, {
radius: 300,
unit: "meter",
height: 0,
gradient: {
0.1: '#d625ff',
0.2: '#d625ff',
0.3: '#2300f4',
0.5: '#2300f4',
0.6: '#31ff13',
0.7: '#31ff13',
0.8: '#ecff1d',
1: '#e81c00',
},
value: function (index, feature) {
return feature.properties.avg;
},
heightBezier: [0, 0.53, 0.37, 0.98],
});
loca.add(heatmap);
})
.catch((e) => {
console.log(e);
});
}
}
};
</script>
<style lang='scss' scoped>
#containerMap {
width: 100%;
height: 60vh;
}
</style>


 被折叠的 条评论
为什么被折叠?
被折叠的 条评论
为什么被折叠?
 到【灌水乐园】发言


