taro-vue和小程序原生的一些方法对比

view遍历数据
taro-vue
v-for=“site in giftList” v-bind:key=“site.index”

v-for=“site in giftList” :key=“site.index”
v-for="(item,i) in giftList" v-bind:key=“i”
原生
wx:for="{{ giftList}}"
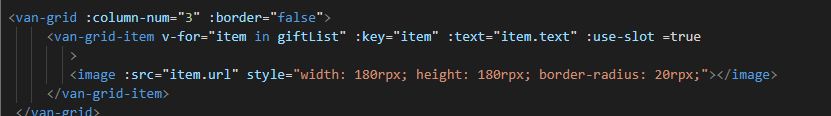
van-weapp组件遍历数据
v-for=“item in giftList” :key=“item”
在这里插入图片描述

绑定样式
taro-vue
:class=“grid_indexindex?Active:notActive"
:style="{color:item.luckyNum >0 ?colorRed:colorGreen}"
原生
class="{{grid_index
index?Active:notActive}}”
vue绑定内联样式:
方法1:

data: { activeColor: 'red', fontSize: 30 } 方法2:
data: { styleObject: { color: 'red', fontSize: '13px' } } 参考:https://cn.vuejs.org/v2/guide/class-and-style.html

显示隐藏
taro-vue
v-if=“index!=4”

原生
wx:if

点击事件

taro-vue
@tap
@close=“onClose”
@change"=“onChange”
原生
catchTap
bind:close=“onClose”
bind:change="onChange

全局变量
taro-vue
新建文件global_data.js

const globalData = {}
export function set (key, val) {
globalData[key] = val
}
export function get (key) {
return globalData[key]
}
在使用页面
import { set as setGlobalData, get as getGlobalData } from ‘…/…/global_data’
setGlobalData(‘test’, 3)
getGlobalData(‘test’)

原生
在app.js里面
globalData: {
}
在使用页面
const app = getApp()
app.globalData

  • 0
    点赞
  • 0
    收藏
    觉得还不错? 一键收藏
  • 0
    评论
首先,你需要安装 TaroVue.js。然后,你可以使用 F2 库来绘制基金净值走势图。 以下是一个基本的示例: 1. 在 Taro 项目中创建一个名为 Chart 的组件 ```jsx import Taro, { Component } from '@tarojs/taro' import { View } from '@tarojs/components' import F2 from '@antv/f2' import './chart.scss' class Chart extends Component { componentDidMount() { // 绘制图表 this.drawChart() } drawChart = () => { const chart = new F2.Chart({ el: this.refs.chart, width: Taro.pxTransform(750), height: Taro.pxTransform(300) }) const data = this.props.data // 传递基金净值数据 chart.source(data, { time: { type: 'timeCat', tickCount: 3, mask: 'MM-DD' } }) chart.axis('time', { label: function label(text, index, total) { const textCfg = {} if (index === 0) { textCfg.textAlign = 'left' } else if (index === total - 1) { textCfg.textAlign = 'right' } return textCfg } }) chart.line().position('time*value') chart.render() } render() { return ( <View className='chart'> <canvas ref='chart'></canvas> </View> ) } } export default Chart ``` 2. 在 Taro 页面中使用 Chart 组件 ```jsx import Taro, { Component } from '@tarojs/taro' import { View } from '@tarojs/components' import Chart from '../../components/Chart' class Fund extends Component { config = { navigationBarTitleText: '基金净值走势' } state = { data: [ { time: '2019-01-01', value: 1.0 }, { time: '2019-02-01', value: 1.2 }, { time: '2019-03-01', value: 1.5 }, { time: '2019-04-01', value: 1.8 }, { time: '2019-05-01', value: 1.7 }, { time: '2019-06-01', value: 1.9 } ] } render() { return ( <View className='fund'> <Chart data={this.state.data} /> </View> ) } } export default Fund ``` 3. 将 Taro 项目构建为原生 APP 和小程序 你可以使用 Taro 提供的命令将 Taro 项目构建为原生 APP 和小程序。例如,要将 Taro 项目构建为微信小程序,你可以运行以下命令: ``` npm run build:weapp ``` 这将生成一个 dist/weapp 目录,其中包含用于微信小程序的代码。 对于原生 APP,你需要使用 Taro 提供的其他命令和工具来构建和打包应用程序。具体细节请参考 Taro 的文档。

“相关推荐”对你有帮助么?

  • 非常没帮助
  • 没帮助
  • 一般
  • 有帮助
  • 非常有帮助
提交
评论
添加红包

请填写红包祝福语或标题

红包个数最小为10个

红包金额最低5元

当前余额3.43前往充值 >
需支付:10.00
成就一亿技术人!
领取后你会自动成为博主和红包主的粉丝 规则
hope_wisdom
发出的红包
实付
使用余额支付
点击重新获取
扫码支付
钱包余额 0

抵扣说明:

1.余额是钱包充值的虚拟货币,按照1:1的比例进行支付金额的抵扣。
2.余额无法直接购买下载,可以购买VIP、付费专栏及课程。

余额充值