echarts设置竖向不同区间范围颜色,并且x轴自定义轴线刻度范围

需求:设置竖向范围区间,不同范围区间颜色不同并且提示信息不同,之后修改x轴的固定间距范围,让0-200-400-600改为0-340-476-754这种,在这我是markLine的方式实现的,这边我还用到x轴的翻转所以显示的是镜像的。

1.效果
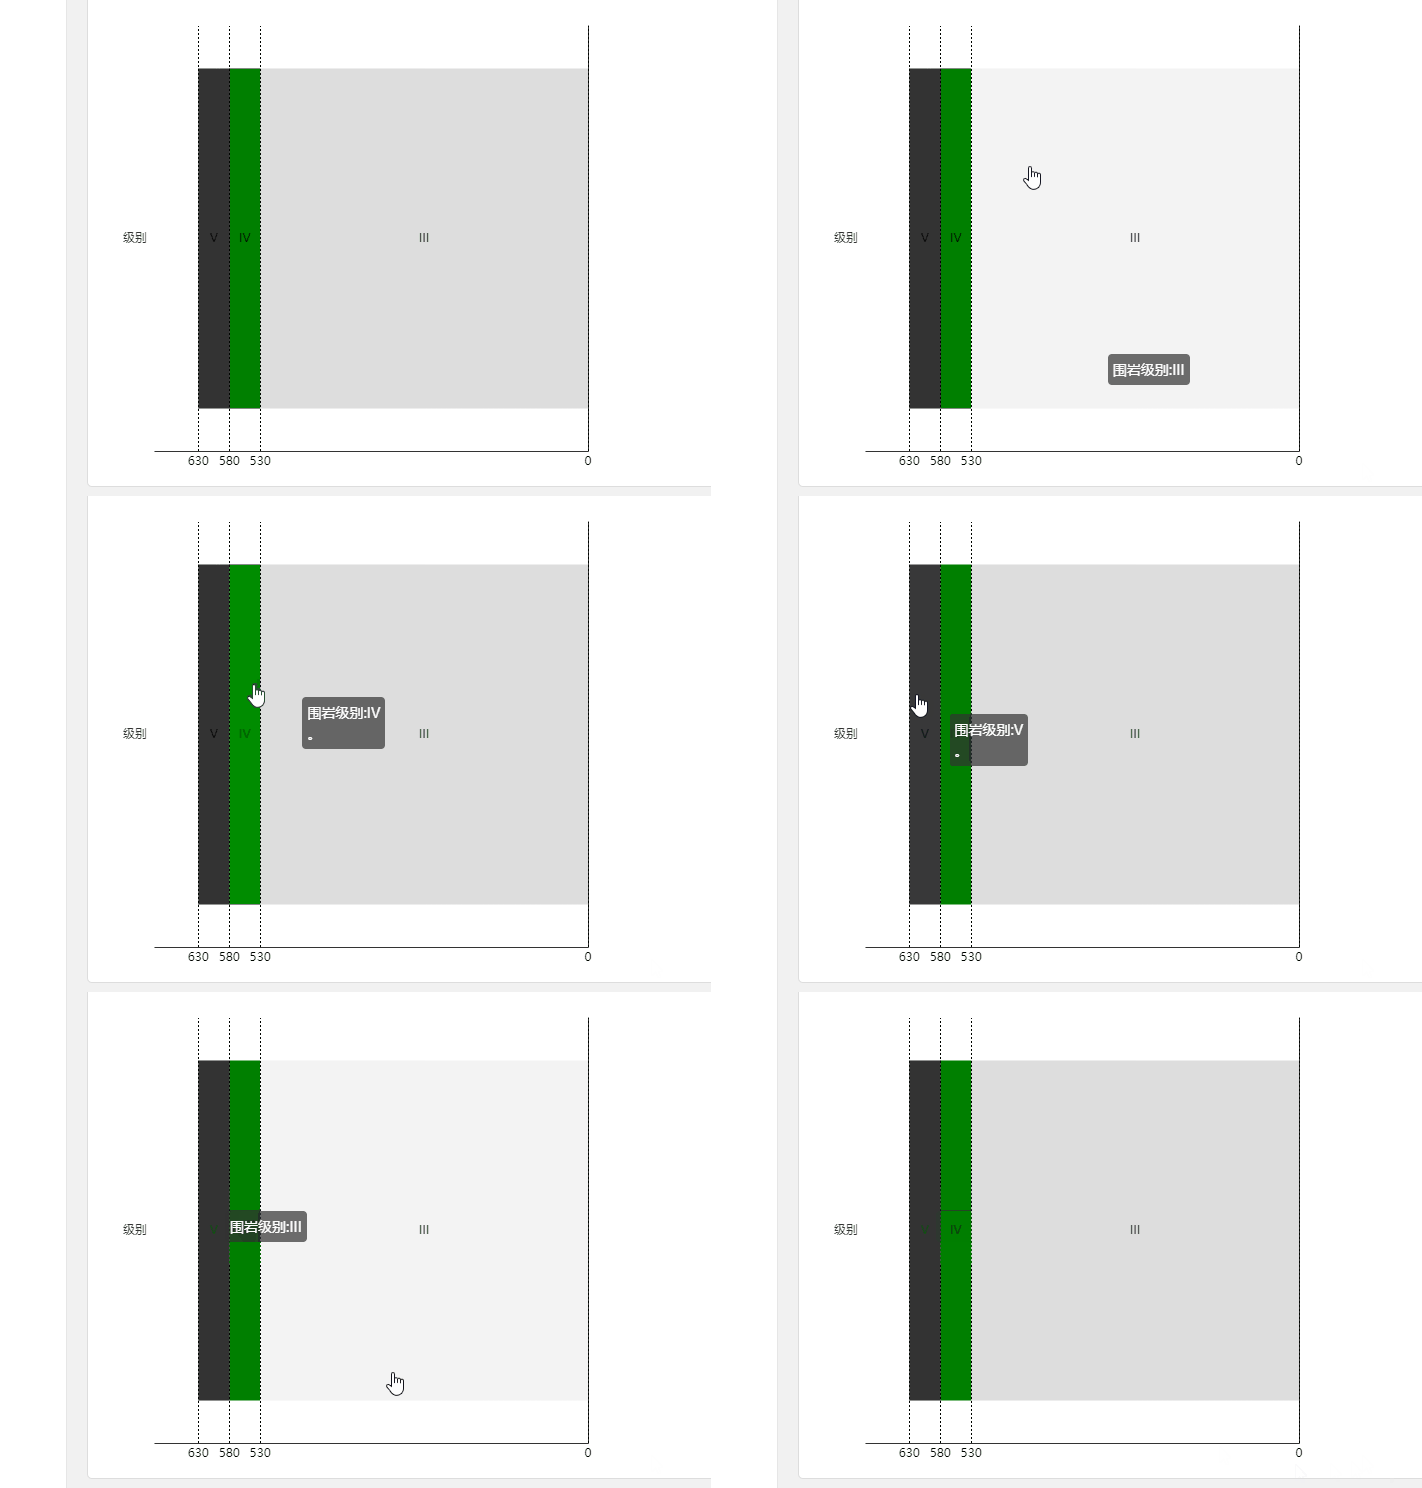
2.主要代码

inverse:翻转轴线

type必须为value,不然图片显示不出来,其他就是把x轴线给隐藏了,之后再用markLine去手动画一条线

   xAxis: {
                    inverse: true,
                    type: 'value',
                    axisTick: { show: false }, // 隐藏刻度线
                    splitLine: { show: false }, // 隐藏分割线
                    axisLabel: { show: false } // 隐藏刻度值
                },

使用markLine画线,data就是线的间隔数据, 

lineStyle: { color: 'black', type: 'dotted' },线的颜色和类型,可选solid(实线),dashed(虚线),dotted(斑点虚线)

    markLine: {
                            symbol: false, // 取消箭头
                            silent: true, // 取消鼠标hover事件
                            label: {
                                position: 'start', // 改变label位置
                                formatter: (obj) => obj.value // 格式化标签文本
                            },
                            lineStyle: { color: 'black', type: 'dotted' },
                            data: [0, 530, 580, 630].map((val) => {
                                return {
                                    xAxis: val
                                };
                            })
                        },

注意这个data,data的值是530-580之间的差值,差50value就写50,写多了图就错了。。。

     {
                        name: '',
                        tooltip: {
                            trigger: 'item',
                            formatter: '\n围岩级别:IV<br/>\n。'
                        },
                        type: 'bar',
                        stack: 'total',
                        itemStyle: {
                            color: 'green'
                        },
                        label: {
                            show: true,
                            formatter: 'IV',
                            color: 'black'
                        },
                        emphasis: {
                            focus: 'series'
                        },
                        data: [
                            {
                                value: 50,
                                xAxis: 1
                            }
                        ]
                    },

3.完整代码

<template>
    <div class="content-box">
        <div class="container">
            <div style="width: 500px; height: 500px">
                <div id="LineECharts" :style="{ width: '100%', height: '500px' }"></div>
            </div>
        </div>
    </div>
</template>

<script>
export default {
    name: 'LineECharts', // 折线图
    data() {
        return {};
    },
    methods: {
        drawLine() {
            // 获取当前日期
            // let nowTime = new Date().toLocaleDateString().split('/').join('-');
            // 基于准备好的dom,初始化echarts实例
            let myChartOne = this.$echarts.init(document.getElementById('LineECharts'));
            // 绘制图表
            myChartOne.setOption({
                tooltip: {
                    trigger: 'item',
                    axisPointer: {
                        type: 'shadow'
                    }
                },
                grid: {
                    left: '3%',
                    right: '4%',
                    bottom: '3%',
                    containLabel: true
                },
                xAxis: {
                    inverse: true,
                    type: 'value',
                    axisTick: { show: false }, // 隐藏刻度线
                    splitLine: { show: false }, // 隐藏分割线
                    axisLabel: { show: false } // 隐藏刻度值
                },
                yAxis: {
                    type: 'category',
                    data: ['级别']
                },
                series: [
                    {
                        name: '',
                        tooltip: {
                            trigger: 'item',
                            formatter: '\n  围岩级别:III<br/>\n'
                        },
                        type: 'bar',
                        stack: 'total',
                        itemStyle: {
                            color: '#ddd'
                        },
                        label: {
                            show: true,
                            formatter: 'III',
                            color: 'black'
                        },
                        emphasis: {
                            focus: 'series'
                        },
                        data: [
                            {
                                value: 530,
                                xAxis: 0
                            }
                        ],
                        markLine: {
                            symbol: false, // 取消箭头
                            silent: true, // 取消鼠标hover事件
                            label: {
                                position: 'start', // 改变label位置
                                formatter: (obj) => obj.value // 格式化标签文本
                            },
                            lineStyle: { color: 'black', type: 'dotted' },
                            data: [0, 530, 580, 630].map((val) => {
                                return {
                                    xAxis: val
                                };
                            })
                        }
                    },
                    {
                        name: '',
                        tooltip: {
                            trigger: 'item',
                            formatter: '\n围岩级别:IV<br/>\n。'
                        },
                        type: 'bar',
                        stack: 'total',
                        itemStyle: {
                            color: 'green'
                        },
                        label: {
                            show: true,
                            formatter: 'IV',
                            color: 'black'
                        },
                        emphasis: {
                            focus: 'series'
                        },
                        data: [
                            {
                                value: 50,
                                xAxis: 1
                            }
                        ]
                    },
                    {
                        name: '',
                        tooltip: {
                            trigger: 'item',
                            formatter: '\n 围岩级别:V<br/>\n 。'
                        },
                        type: 'bar',
                        stack: 'total',
                        itemStyle: {
                            color: '#333'
                        },
                        label: {
                            show: true,
                            formatter: 'V',
                            color: 'black'
                        },
                        emphasis: {
                            focus: 'series'
                        },
                        data: [
                            {
                                value: 50,
                                xAxis: 2
                            }
                        ]
                    }
                ]
            });
            window.onresize = () => {
                // 根据窗口大小变化图表自适应
                myChartOne.resize();
            };
        }
    },
    mounted() {
        this.drawLine();
    }
};
</script>

4.其他补充

这个是鼠标移动后显示的内容的,可以自定义内容,也可以设置弹窗距离鼠标的位置等

 // 鼠标划入的弹出框
        tooltip: {
          trigger: 'axis',
          axisPointer: {
            // 坐标轴指示器,坐标轴触发有效
            type: this.colunm.type ? this.colunm.type : 'shadow' // 默认为阴影,可选为:'line' | 'shadow'
          },
          textStyle: {
            color: this.colunm.tooltipcolor,
            fontFamily: '等线'
            // fontSize:'0.1rem'
          },
          borderColor: this.colunm.tooltipborderColor,
          backgroundColor: this.colunm.tooltipbackgroundColor,
          position: function (p) {
            //其中p为当前鼠标的位置
            return [p[0] + 10, p[1] - 60]
          },
          // textStyle: {
          //   fontSize: 12 // 字体大小
          // }
          // confine: true,
          // extraCssText: 'white-space: normal; word-break: break-all;',

          confine: true, //限制tooltip在图表范围内展示
          // extraCssText: 'max-height:100%;overflow:scroll', //最大高度以及超出处理
          // enterable: true, //鼠标可以进入tooltip区域,使用滚动条
          //  position: [100, 10]// position: ['10px', '10px']
          formatter: function (params) {
            // 提示内容太多隔行显示内容
            let astr = ''
            params.forEach((ele, index) => {
              astr += `
                                <div style="display: block;height:20px;${
                                  index % 2 === 0
                                    ? 'width: 45%;'
                                    : 'width: 38%;'
                                }float:left;">
                                    <i style="width: 10px;height: 10px;display: inline-block;background: ${
                                      ele.color
                                    };border-radius: 10px;"></i>
                                    <span>${ele.seriesName}: ${ele.data}</span>
                                </div>
                            `
            })
            const b = '<div style="width: 200px;">' + astr + '<div>'
            return b
          }
        },

文章到此结束,希望对你有所帮助~~

  • 0
    点赞
  • 1
    收藏
    觉得还不错? 一键收藏
  • 0
    评论

“相关推荐”对你有帮助么?

  • 非常没帮助
  • 没帮助
  • 一般
  • 有帮助
  • 非常有帮助
提交
评论
添加红包

请填写红包祝福语或标题

红包个数最小为10个

红包金额最低5元

当前余额3.43前往充值 >
需支付:10.00
成就一亿技术人!
领取后你会自动成为博主和红包主的粉丝 规则
hope_wisdom
发出的红包
实付
使用余额支付
点击重新获取
扫码支付
钱包余额 0

抵扣说明:

1.余额是钱包充值的虚拟货币,按照1:1的比例进行支付金额的抵扣。
2.余额无法直接购买下载,可以购买VIP、付费专栏及课程。

余额充值