


基金监控项目实战
一 设计思想
爬虫
采集基金公司的数据
单线程爬虫,用requests进行处理
web开发
前端
负责页面的设计的设计
HTML+CSS+JavaScript+echarts
后端
负责调用爬虫获取数据,传输给前端
Flask框架
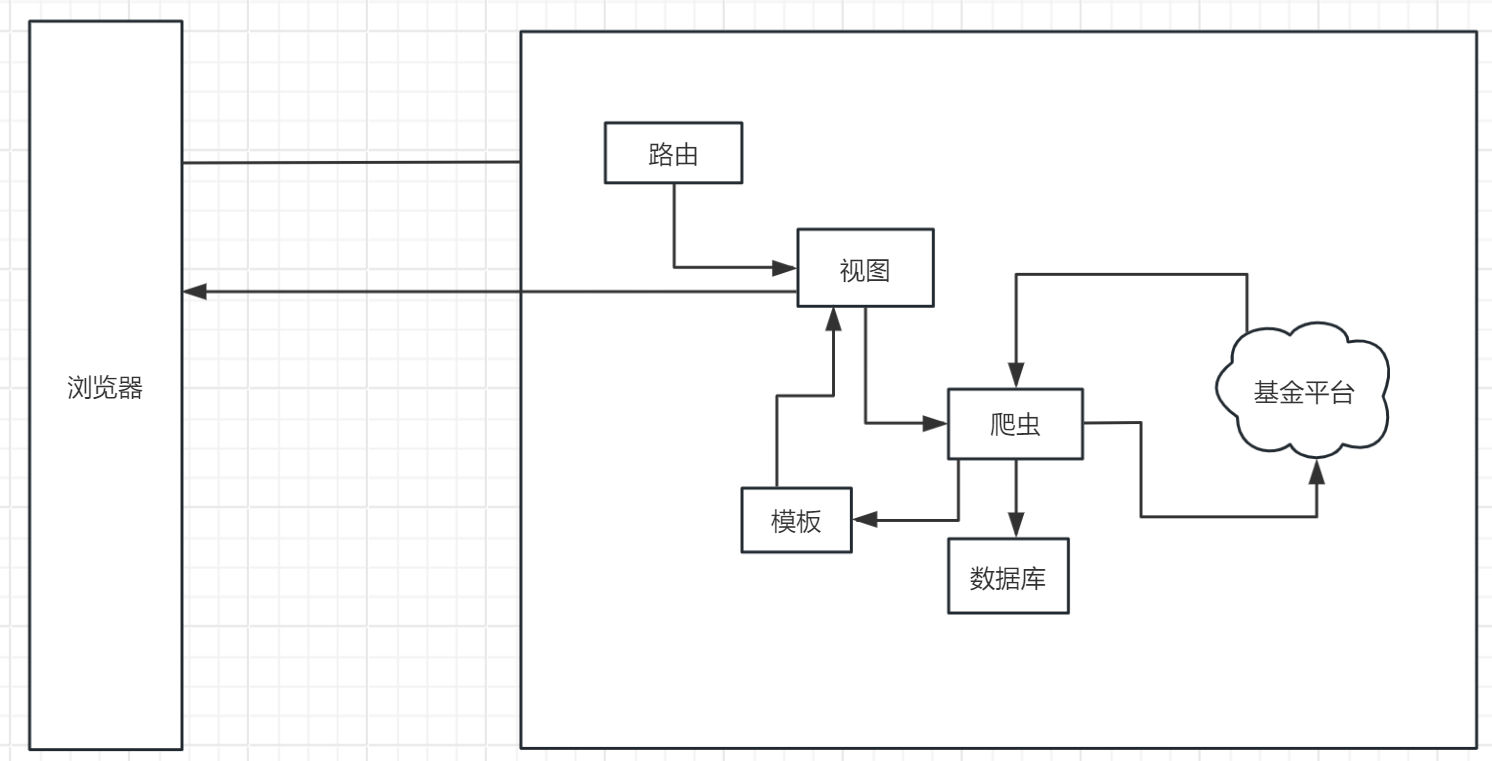
流程思维导图:
二 前端设计
样式里面 .表示class #表示ID
<!DOCTYPE html>
<html lang="en">
<head>
    <meta charset="UTF-8">
    <title>Title</title>
</head>
<body>
<h1>基金可视化!</h1>
//设置css属性
//css样式中.表示class,#表示ID
<style>
    body{
        background-color: lightblue;
    }
//设置名字为 w 的class属性
    .w{
        width: 1200px;
        height: auto;
        margin: auto;
    }
//设置id为box的属性
    .box{
        margin-top:60px;
        height: 60px;
        display: flex;
        justify-content: center;
    }
//设置id为box的模块下的 input的属性
    .box input{
        width: 800px;
        height: 50px;
        border: 1px solid purple;
        padding-left:26px;
        font-size: 20px;
    }
//设置id为box的模块下的 名称为btn的class的属性
    .box #btn{
        width: 66px;
        height:54px;
        background-color: gray;
        cursor: pointer;
    }
//设置名字为 data 的class属性
    #data{
        height: 600px;
        margin-top:60px;
        border: 1px solid pink;
    }
</style>
<!--搜索框-->
//class为w和box的搜索框模块
<div class="w box">
    <input type="text"placeholder="请输入基金编号">
//按钮
    <button id="btn">搜索</button>
</div>
<!--搜索结束-->
<div id="data"class="box">
</div>
</body>
</html>
三 后端设计
-
document.getElementById('data'): 这是一个 DOM (Document Object Model) 方法,它返回一个在 HTML 文档中具有 ID 属性为data的元素。这意味着你应该在你的 HTML 中有一个元素类似于<div id="data"></div>。 -
echarts.init(...): 这是 ECharts 库的方法,它初始化一个图表实例。它接受一个 DOM 元素作为参数(在这里,是上一步获取的元素),并在该元素中创建一个图表。 -
var ff = ...: 这部分代码创建了一个新的变量ff,并将初始化的 ECharts 实例赋值给它。随后,你可以使用这个变量ff来调用图表实例的方法,比如设置图表的选项 (setOption)、更新数据等。
<script src="https://cdn.bootcss.com/jquery/3.4.1/jquery.min.js"></script>
<script src="https://cdn.bootcss.com/echarts/3.7.1/echarts.min.js"></script>
<!--这个js是折线图-->
<script>
//初始一个echarts实例
    var ff =echarts.init(document.getElementById('data'))
option = {
  title:{
    text:'李绍幸',
    left:'left',
  },
  tooltip:{
    trigger:'axis',
    axisPointer:{
      type:'line',
      lineStyle:{
        color:'red',
      }
    }
  },
  xAxis: {
    type: 'category',
    data: ['Mon', 'Tue', 'Wed', 'Thu', 'Fri', 'Sat', 'Sun']
  },
  yAxis: {
    type: 'value'
  },
  series: [
    {
      data: [150, 230, 224, 218, 135, 147, 260],
      type: 'line'
    }
  ]
};
    ff.setOption(option)
</script>
<!--这个js是aJax请求-->
<script>
    $('#btn').click(function () {
        //获取表数据
            var text = $('.box input').val();
            //构造数据格式
            var data = {'data':text};
        //发包
        $.ajax({
            url:'/api',//路由
            type:'GET',//方法
            data:data,//携带数据
            //发包成功接收后台数据
            success:function (res) {
                //把后端的时间传参给X轴
                option.xAxis.data = res.data.time
                    option.series[0].data=res.data.price
                option.title.text = res.data.title
                        ff.setOption(option)//设置到图表
            },
            error:function () {
                console.log('发包失败!!')
            }
        })
    })
</script>
四 爬虫程序设计
crawl.py
import requests
import re
def get_data(id):
    # 确保 id 是字符串格式
    id = str(id)
    try:
        resp = requests.get(url='https://fund.eastmoney.com/js/fundcode_search.js?v=20220325212048').text
        # 改进正则表达式以匹配整个赋值语句
        ff = re.findall('var r = (.*?);', resp)
        if not ff:
            raise ValueError("No data found with the provided regex pattern.")

        # 使用 eval 来解析数据
        params_data = eval(ff[0])
        title = ''

        # 寻找匹配的基金名称
        for i in params_data:
            if id == i[0]:
                title = i[2]
                break
        else:
            return {'error': 'No matching fund found for the given ID.'}

        url = f"https://danjuanfunds.com/djapi/fund/growth/{id}?day=3m"
        header = {
            'User-Agent': 'Mozilla/5.0 (Windows NT 10.0; Win64; x64) AppleWebKit/537.36 (KHTML, like Gecko) Chrome/107.0.0.0 Safari/537.36'
        }
        res = requests.get(url, headers=header)

        if res.status_code == 200:
            items = res.json()
            times = []
            zf = []
            for item in items.get('data')['fund_nav_growth']:
                date = item.get('date')
                percentage = item.get('percentage')
                params_data = date.replace(date.split('-')[0] + '-', '')
                times.append(params_data)
                zf.append(percentage)
            return {'time': times, 'price': zf, 'title': title}

        return {'error': f"HTTP request failed with status code {res.status_code}."}
    except Exception as e:
        print(e)
        return {'error': str(e)}
五 可视化图表设计
index.html
<!DOCTYPE html>
<html lang="en">
<head>
    <meta charset="UTF-8">
    <title>Title</title>
</head>
<body>
<h1>基金可视化!</h1>
<!--.表示class,#表示ID -->

<style>
    body{
        background-color: lightblue;
    }
    .w{
        width: 1200px;
        height: auto;
        margin: auto;

    }
    .box{
        margin-top:60px;
        height: 60px;
        display: flex;
        justify-content: center;
    }
    .box input{
        width: 800px;
        height: 50px;
        border: 1px solid purple;
        padding-left:26px;
        font-size: 20px;
    }
    .box #btn{
        width: 66px;
        height:54px;
        background-color: gray;
        cursor: pointer;
    }
    #data{
        height: 600px;
        margin-top:60px;
        border: 1px solid pink;
    }
</style>
<!--搜索框-->
<div class="w box">
    <input type="text"placeholder="请输入基金编号">
    <button id="btn">搜索</button>
</div>
<!--搜索结束-->
<div id="data"class="box">

</div>
<!--数据展示-->

<!--数据展示结束-->
<script src="https://cdn.bootcss.com/jquery/3.4.1/jquery.min.js"></script>
<script src="https://cdn.bootcss.com/echarts/3.7.1/echarts.min.js"></script>
<!--这个js是折线图-->
<script>
    var ff =echarts.init(document.getElementById('data'))
option = {
  title:{
    text:'李绍幸',
    left:'left',
  },
  tooltip:{
    trigger:'axis',
    axisPointer:{
      type:'line',
      lineStyle:{
        color:'red',
      }
    }
  },
  xAxis: {
    type: 'category',
    data: ['Mon', 'Tue', 'Wed', 'Thu', 'Fri', 'Sat', 'Sun']
  },
  yAxis: {
    type: 'value'
  },
  series: [
    {
      data: [150, 230, 224, 218, 135, 147, 260],
      type: 'line'
    }
  ]
};
    ff.setOption(option)
</script>
<!--这个js是aJax请求-->
<script>
    $('#btn').click(function () {
        //获取表数据
            var text = $('.box input').val();
            //构造数据格式
            var data = {'data':text};
        //发包
        $.ajax({
            url:'/api',//路由
            type:'GET',//方法
            data:data,//携带数据
            //发包成功接收后台数据
            success:function (res) {
                //把后端的时间传参给X轴
                option.xAxis.data = res.data.time
                    option.series[0].data=res.data.price
                option.title.text = res.data.title
                        ff.setOption(option)//设置到图表
            },
            error:function () {
                console.log('发包失败!!')
            }
        })
    })
</script>
</body>
</html>
六 后台编写
mains.py
from flask import Flask,render_template,jsonify,request
import crawl
app = Flask(__name__)

@app.route('/')
def index():
    # 渲染页面
    return render_template('index.html')

@app.route('/api')
def api_data():
    # 获取前端参数
    id = request.args.get('data')
    # 给爬虫传参
    data = crawl.get_data(id)
    #响应数据传参给前端
    return jsonify({'data':data})
if __name__ == '__main__':
    # 框架入口
    app.run()


 1045
1045


 被折叠的 条评论
为什么被折叠?
被折叠的 条评论
为什么被折叠?
 到【灌水乐园】发言


