


Windows系统下快速上手Prometheus与Grafana
前言
当前文章仅适用于从未接触过Prometheus与Grafana的新手小白,旨在了解主要步骤并快速上手!
实话说,东西串起来运行没问题,但是不够详细,顺利的话不到半小时就能够看到效果,涉及具体细节请根据个人需要移步到其它大神的博客。
本文以开源若依后端为例,主要演示Prometheus配合Grafana对项目JVM的监控
一、Prometheus与Grafana是什么?
Prometheus是由SoundCloud开发的开源监控报警系统和时序列数据库。
Grafana是一个可视化工具,仅用于展示,可与Prometheus工具配合使用。
二、具体上手操作 对JVM的日志监控
主要分三步:项目内部参数配置、Prometheus工具的下载及参数补充与Grafana工具下载及对Prometheus数据源的引入与表盘的设置。
项目内部参数配置
pom文件引入prometheus相关依赖
		<dependency>
            <groupId>org.springframework.boot</groupId>
            <artifactId>spring-boot-starter-actuator</artifactId>
        </dependency>
        <dependency>
            <groupId>io.micrometer</groupId>
            <artifactId>micrometer-registry-prometheus</artifactId>
        </dependency>
yml配置查看Spring相关配置application下是否有name属性,如果没有则添加(根据个人意愿随意起名)
spring:
  application:
    name: test
同时在yml文件中配置以下prometheus参数
management:
  endpoints:
    web:
      exposure:
        include: "*"
  endpoint:
    prometheus:
      enabled: true
    health:
      show-details: always
  metrics:
    export:
      prometheus:
        enabled: true
启动类添加以下代码
	@Bean
    MeterRegistryCustomizer<MeterRegistry> configurer( @Value("${spring.application.name}") String applicationName ){
        return (registry)-> registry.config().commonTags("application", applicationName);
    }
启动类完整代码如下
package com.ruoyi;

import io.micrometer.core.instrument.MeterRegistry;
import org.springframework.beans.factory.annotation.Value;
import org.springframework.boot.SpringApplication;
import org.springframework.boot.actuate.autoconfigure.metrics.MeterRegistryCustomizer;
import org.springframework.boot.autoconfigure.SpringBootApplication;
import org.springframework.boot.autoconfigure.jdbc.DataSourceAutoConfiguration;
import org.springframework.context.annotation.Bean;

/**
 * 启动程序
 *
 * @author ruoyi
 */
@SpringBootApplication(exclude = { DataSourceAutoConfiguration.class })
public class RuoYiApplication
{
    public static void main(String[] args)
    {
        SpringApplication.run(RuoYiApplication.class, args);
    }

    @Bean
    MeterRegistryCustomizer<MeterRegistry> configurer( @Value("${spring.application.name}") String applicationName ){
        return (registry)-> registry.config().commonTags("application", applicationName);
    }
}
理论上,项目内部的配置已经结束,但是大多数项目对外部请求都有安全验证,所以需要对路径**/actuator与/actuator/prometheus**进行安全放行;此处,为方便直接对所有请求进行放行(/**为放行所有)。
				httpSecurity
                // CSRF禁用,因为不使用session
                .csrf().disable()
                // 认证失败处理类
                .exceptionHandling().authenticationEntryPoint(unauthorizedHandler).and()
                // 基于token,所以不需要session
                .sessionManagement().sessionCreationPolicy(SessionCreationPolicy.STATELESS).and()
                // 过滤请求
                .authorizeRequests()
                // 对于登录login 注册register 验证码captchaImage 允许匿名访问
                .antMatchers("/login", "/register", "/captchaImage").anonymous()
                // 静态资源,可匿名访问
                .antMatchers(HttpMethod.GET, "/", "/*.html", "/**/*.html", "/**/*.css", "/**/*.js", "/profile/**").permitAll()
                // /**为放行所有
                .antMatchers("/swagger-ui.html", "/swagger-resources/**", "/webjars/**", "/*/api-docs", "/druid/**", "/**").permitAll()
                // 除上面外的所有请求全部需要鉴权认证
                .anyRequest().authenticated()
                .and()
                .headers().frameOptions().disable();
此时,配置结束,重启项目即可。
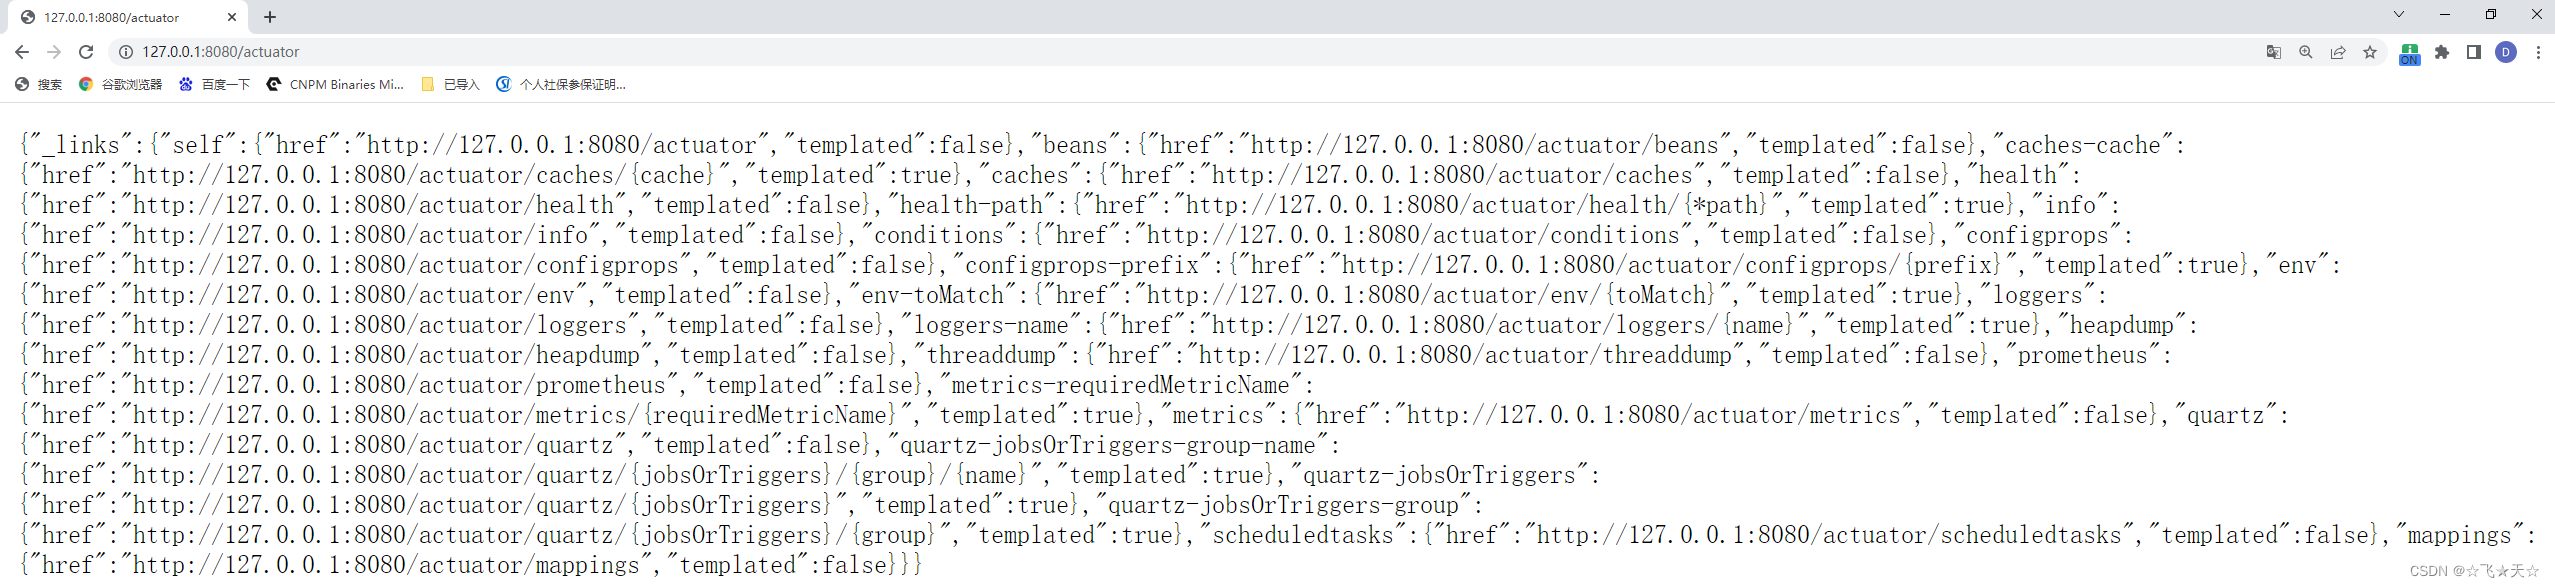
可通过IP+端口+/actuator进行访问,可查看监控相关日志
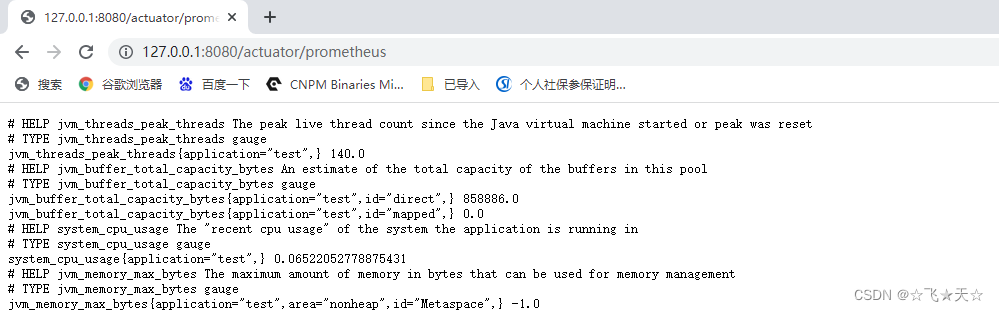
也可通过IP+端口+/actuator/prometheus进行访问,查看prometheus能够识别的日志记录
Prometheus工具的下载及参数补充
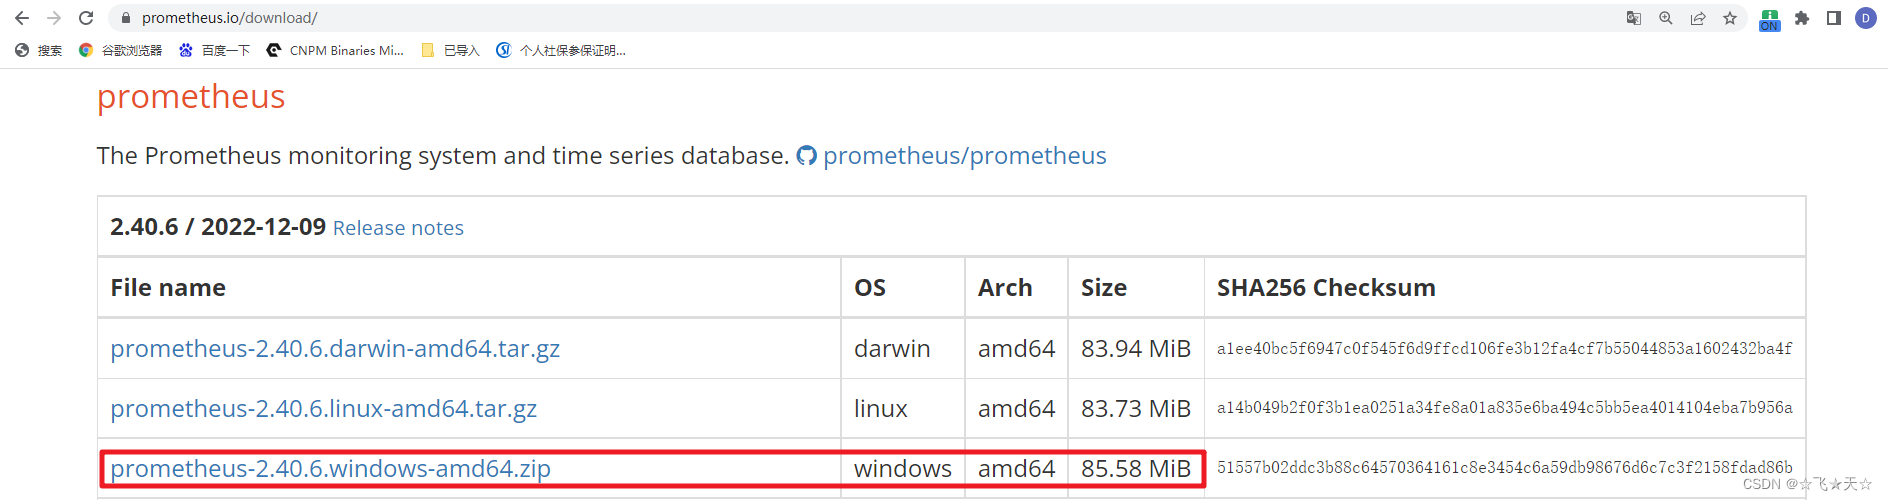
可点击 Prometheus工具的下载地址 或复制地址 https://prometheus.io/download/ 对工具进行下载(建议谷歌浏览器下载)
下载完成后,对文件进行解压
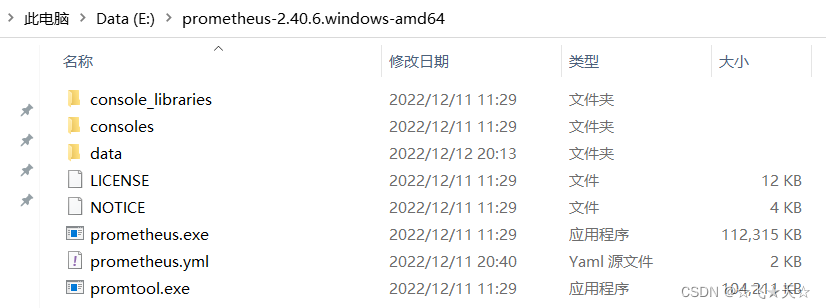
打开prometheus.yml文件,并添加以下配置
  - job_name: "springboot-test-prometheus"
    scrape_interval: 5s
    metrics_path: '/actuator/prometheus'
    static_configs:
      - targets: [ "localhost:8080" ]
全文配置如下
# my global config
global:
  scrape_interval: 15s # Set the scrape interval to every 15 seconds. Default is every 1 minute.
  evaluation_interval: 15s # Evaluate rules every 15 seconds. The default is every 1 minute.
  # scrape_timeout is set to the global default (10s).

# Alertmanager configuration
alerting:
  alertmanagers:
    - static_configs:
        - targets:
          # - alertmanager:9093

# Load rules once and periodically evaluate them according to the global 'evaluation_interval'.
rule_files:
# - "first_rules.yml"
# - "second_rules.yml"

# A scrape configuration containing exactly one endpoint to scrape:
# Here it's Prometheus itself.
scrape_configs:
  # The job name is added as a label `job=<job_name>` to any timeseries scraped from this config.
  - job_name: "prometheus"

    # metrics_path defaults to '/metrics'
    # scheme defaults to 'http'.

    static_configs:
      - targets: [ "" ]

  ### 以下为SpringBoot应用配置
  - job_name: "springboot-test-prometheus"
    scrape_interval: 5s
    metrics_path: '/actuator/prometheus'
    static_configs:
      - targets: [ "localhost:8080" ]
修改后保存,双击prometheus.exe启动prometheus
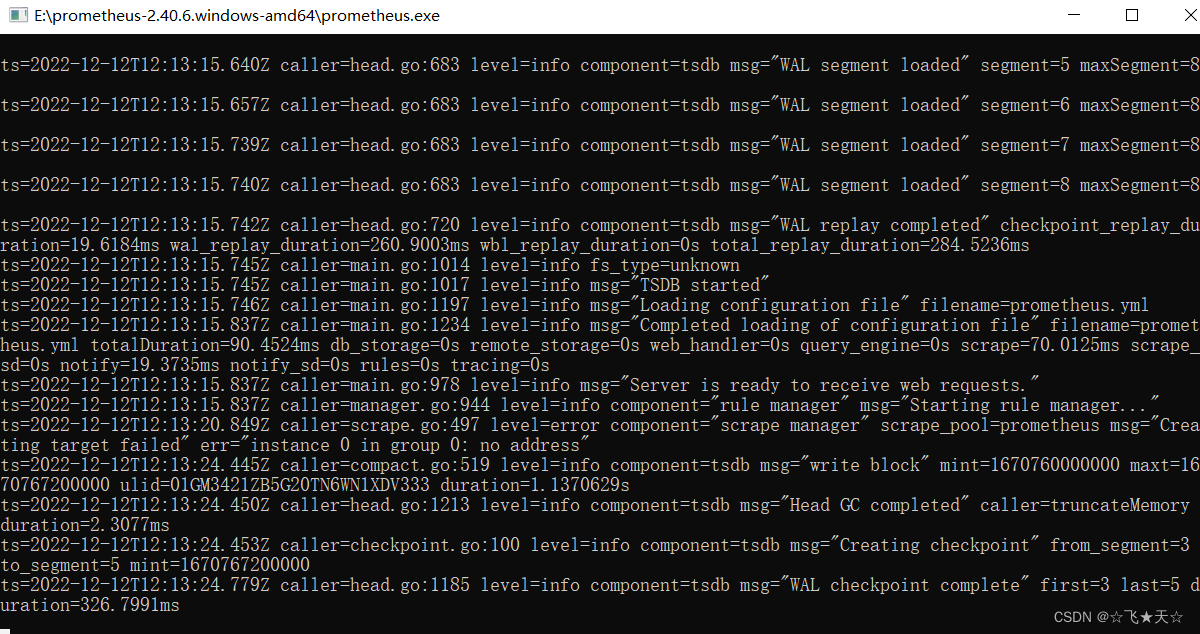
启动后,即可通过IP+端口9090(默认为9090)验证Prometheus是否启动成功
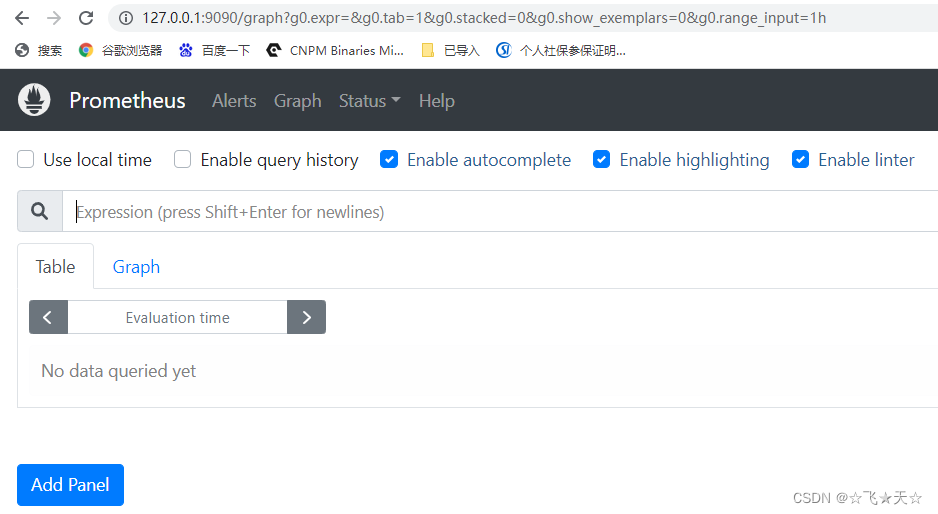
按照下图操作
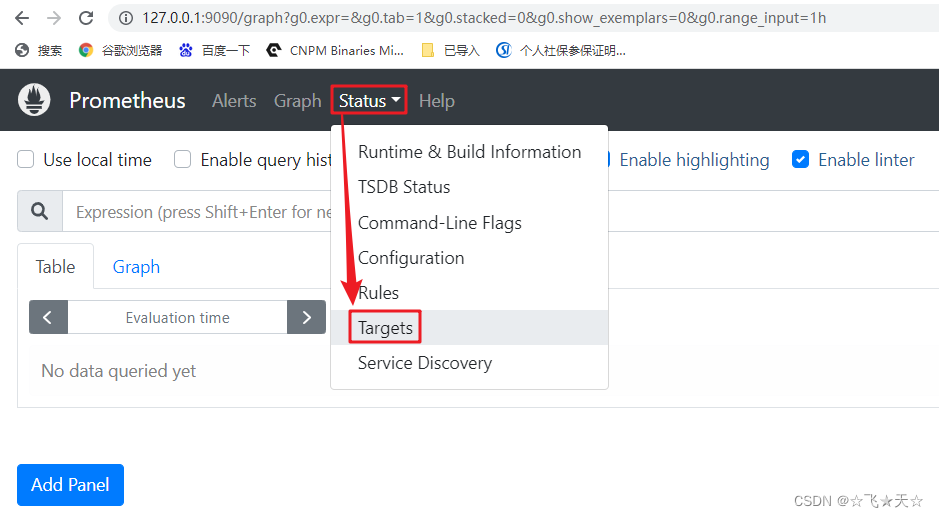
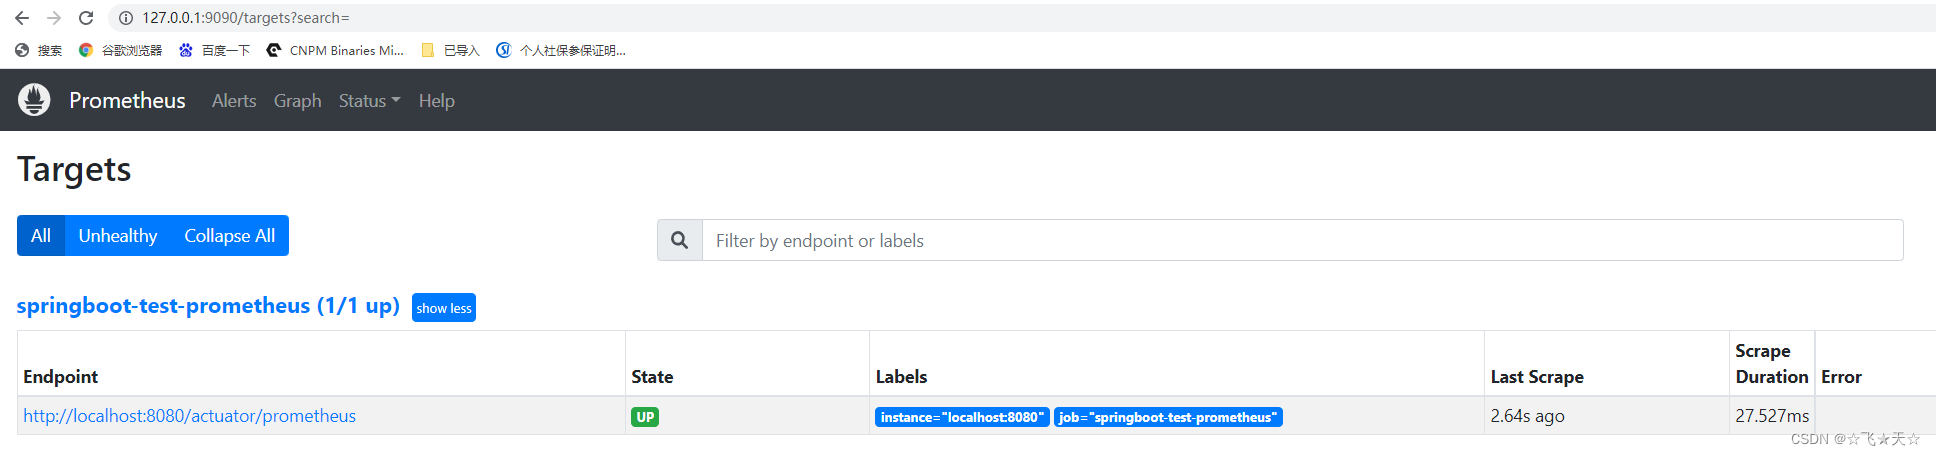
点击Targets后,即可查看监控情况
Grafana工具下载及对Prometheus数据源的引入与表盘的设置
可点击 Grafana工具的下载地址 或复制地址 https://grafana.com/grafana/download?platform=windows 对工具进行下载(建议谷歌浏览器下载)
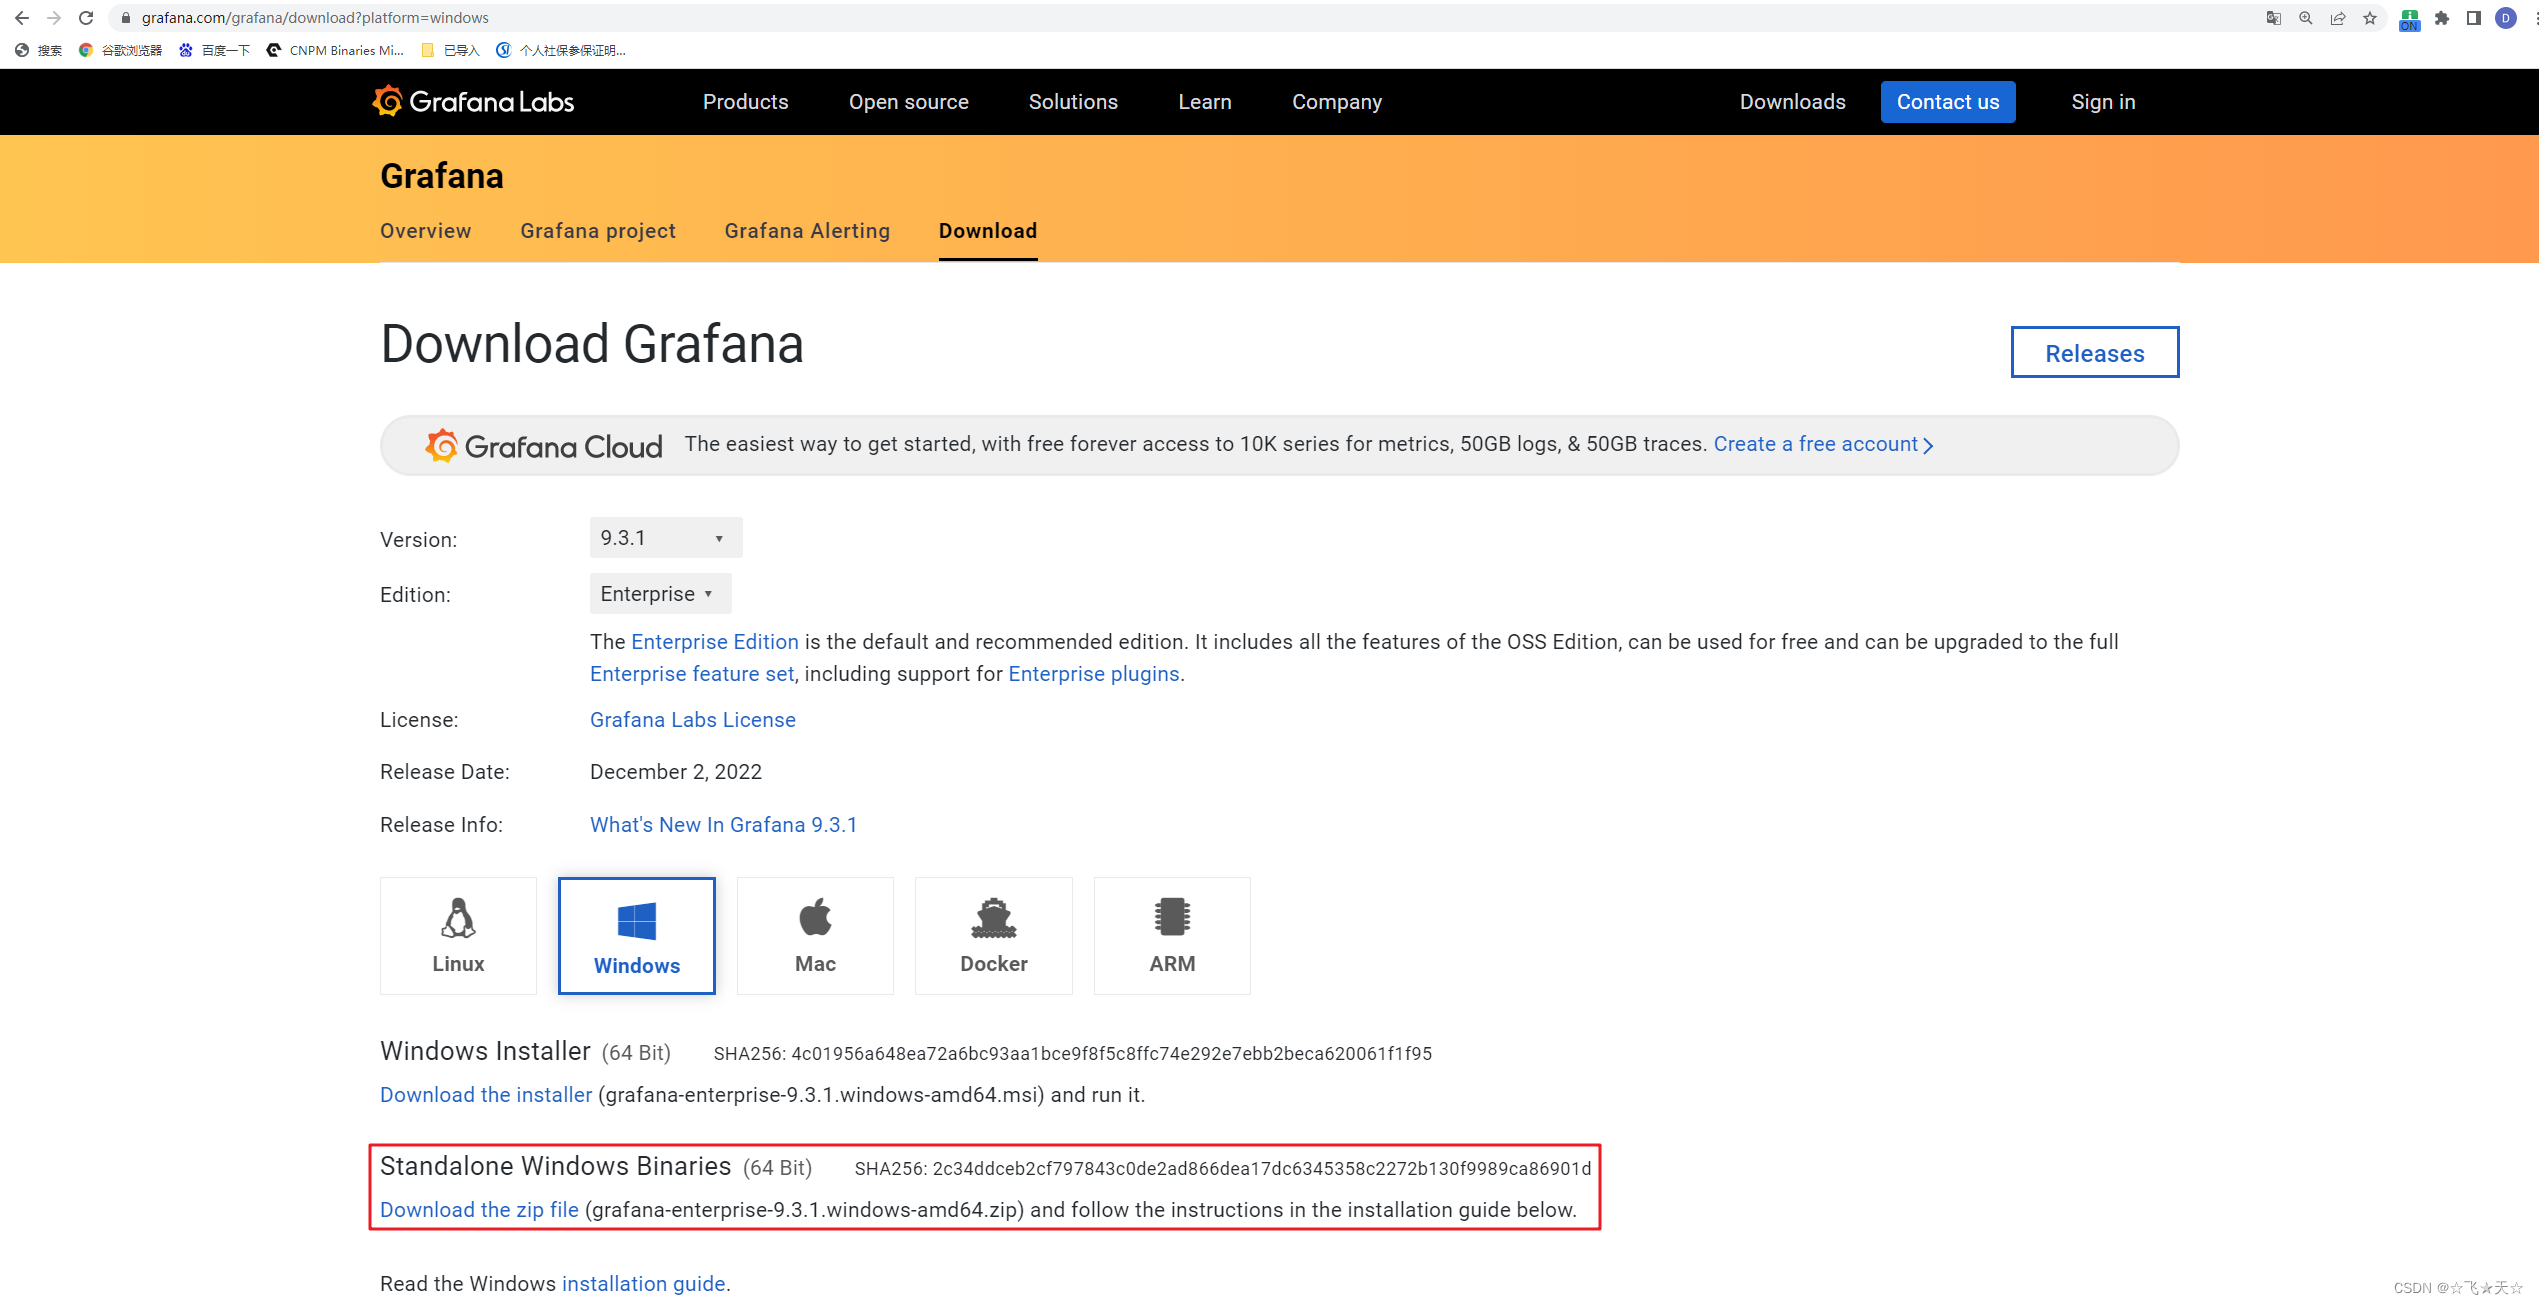
下载完成后,对文件进行解压
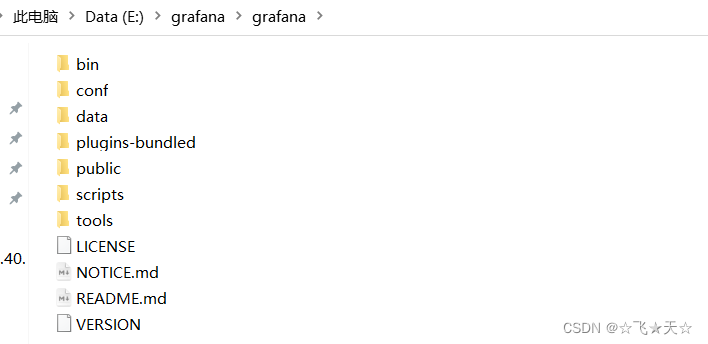
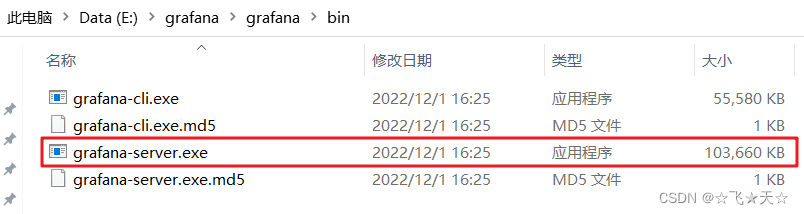
解压后,双击bin文件夹下的grafana-server.exe,启动grafana
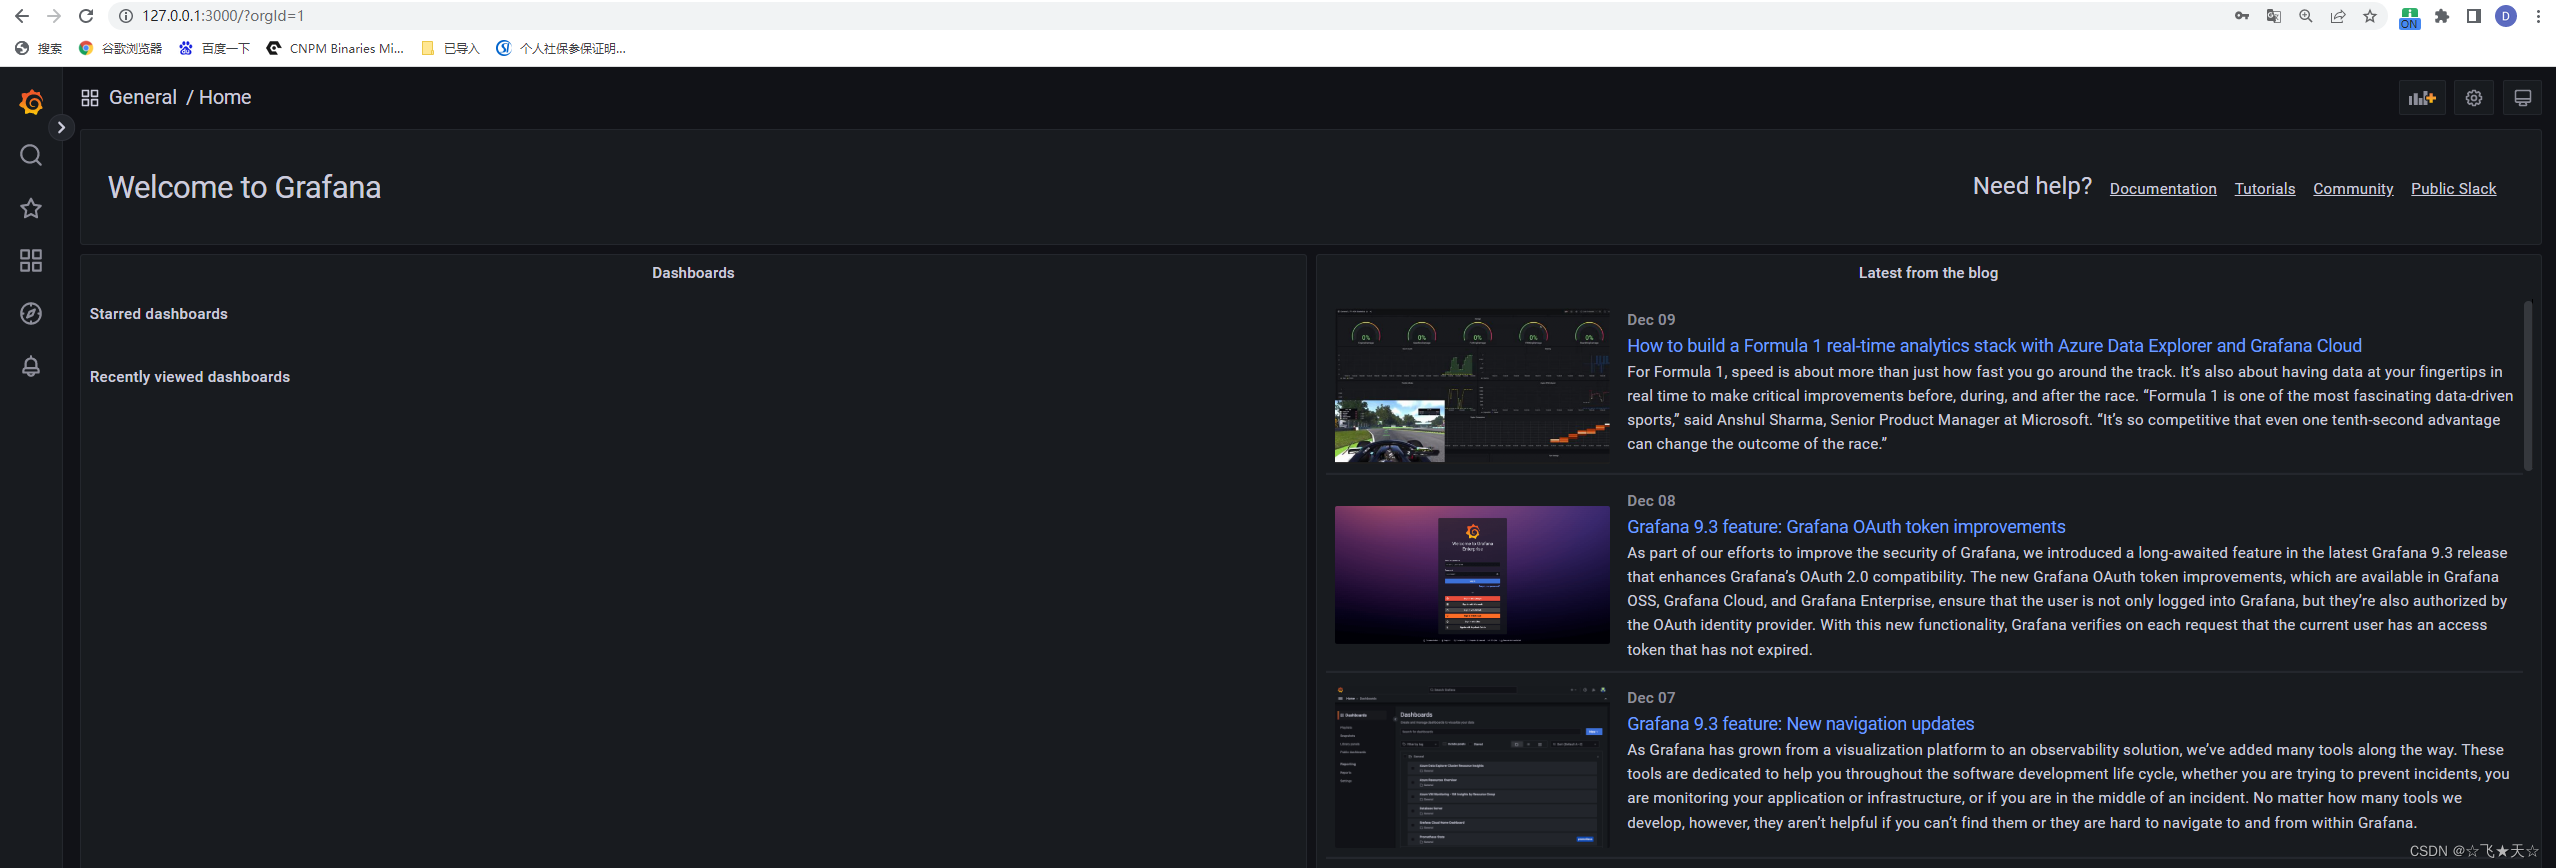
启动后,即可通过IP+端口3000(默认为3000)验证Prometheus是否启动成功
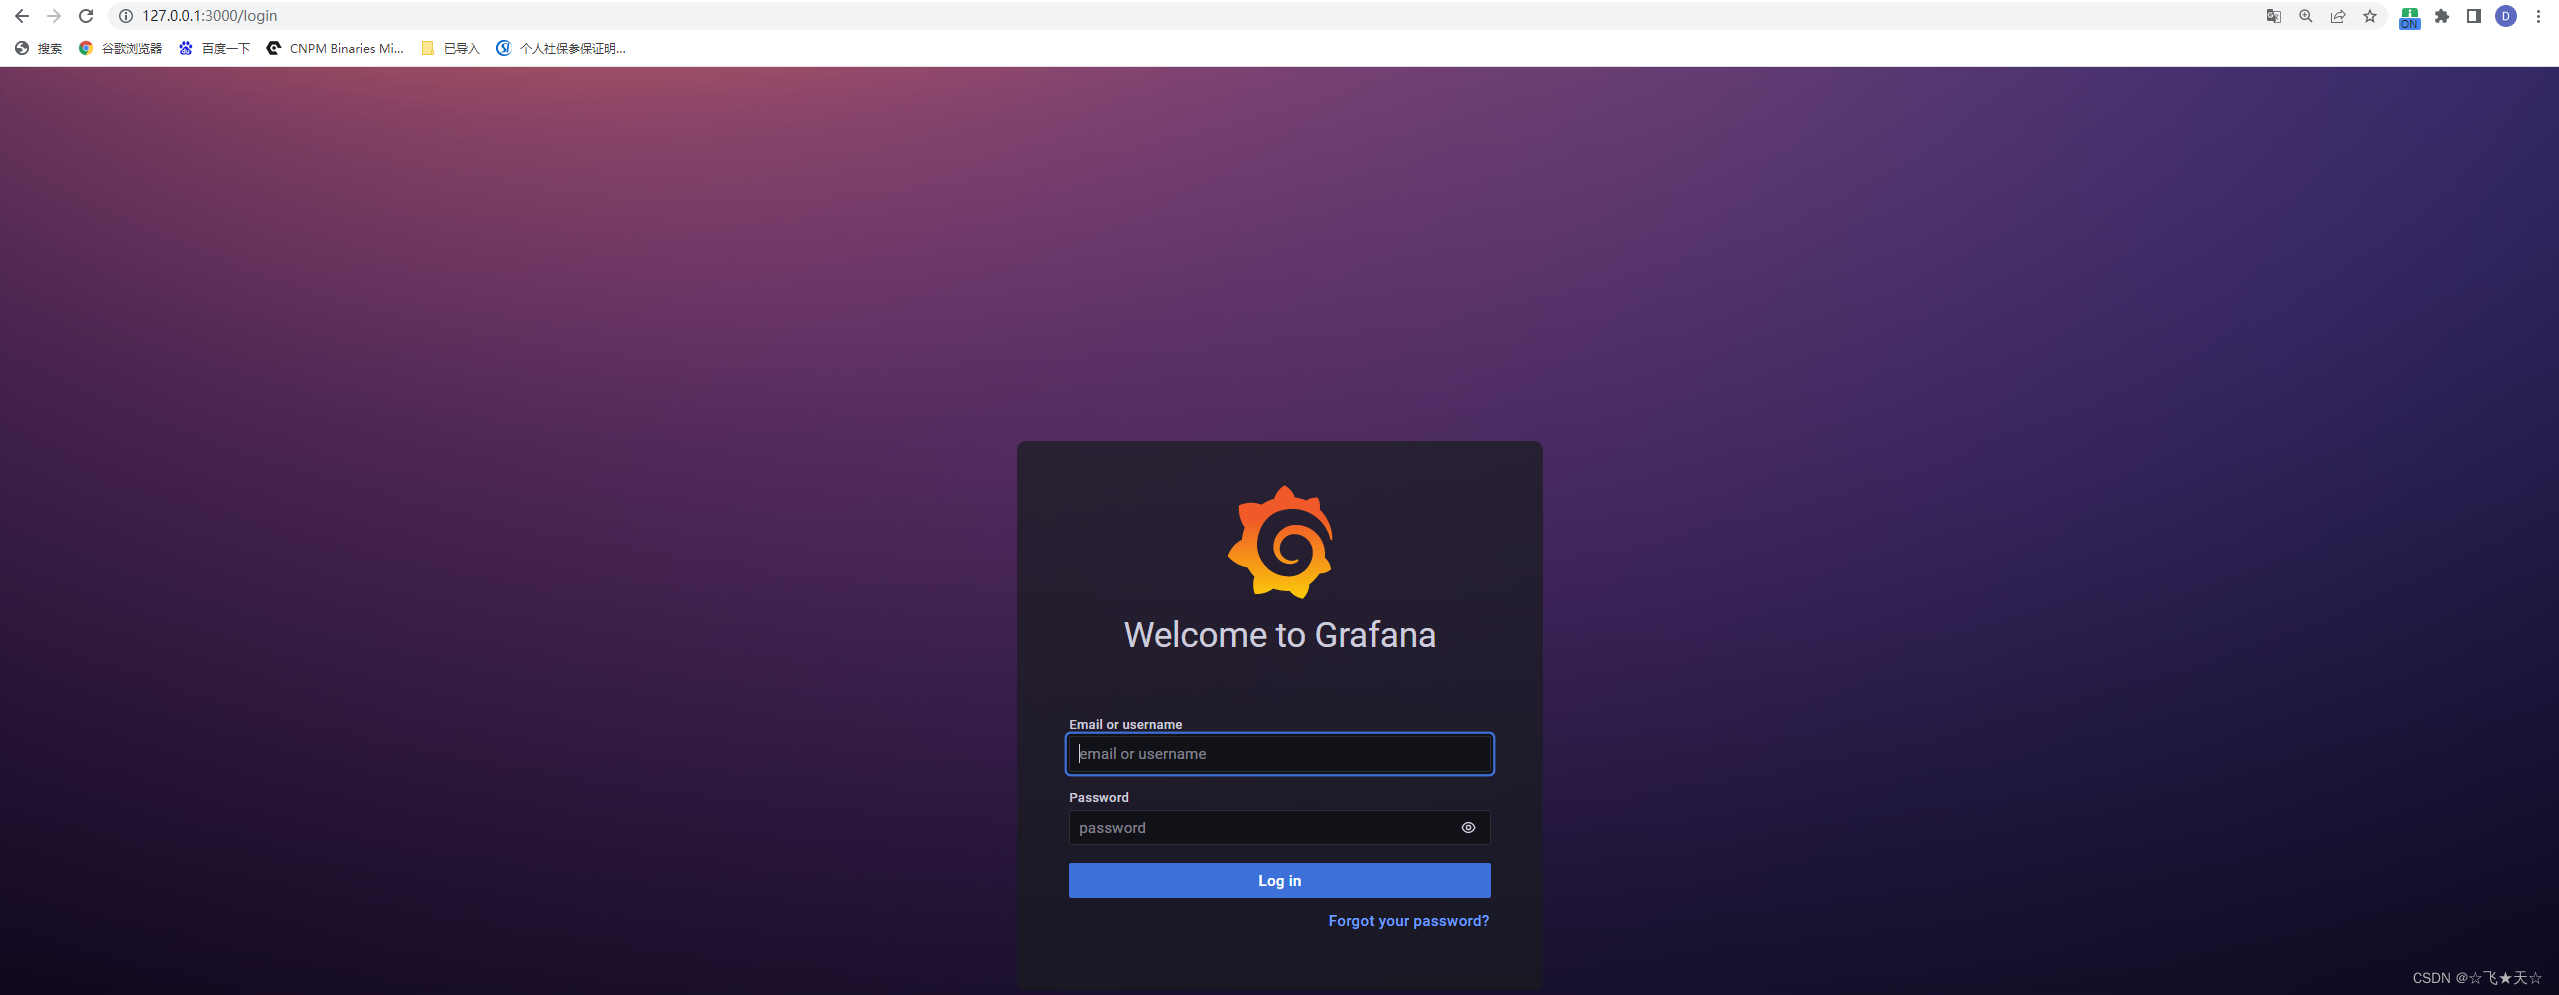
默认账号密码均为admin,登陆后会提示变更密码,登陆后如下图:
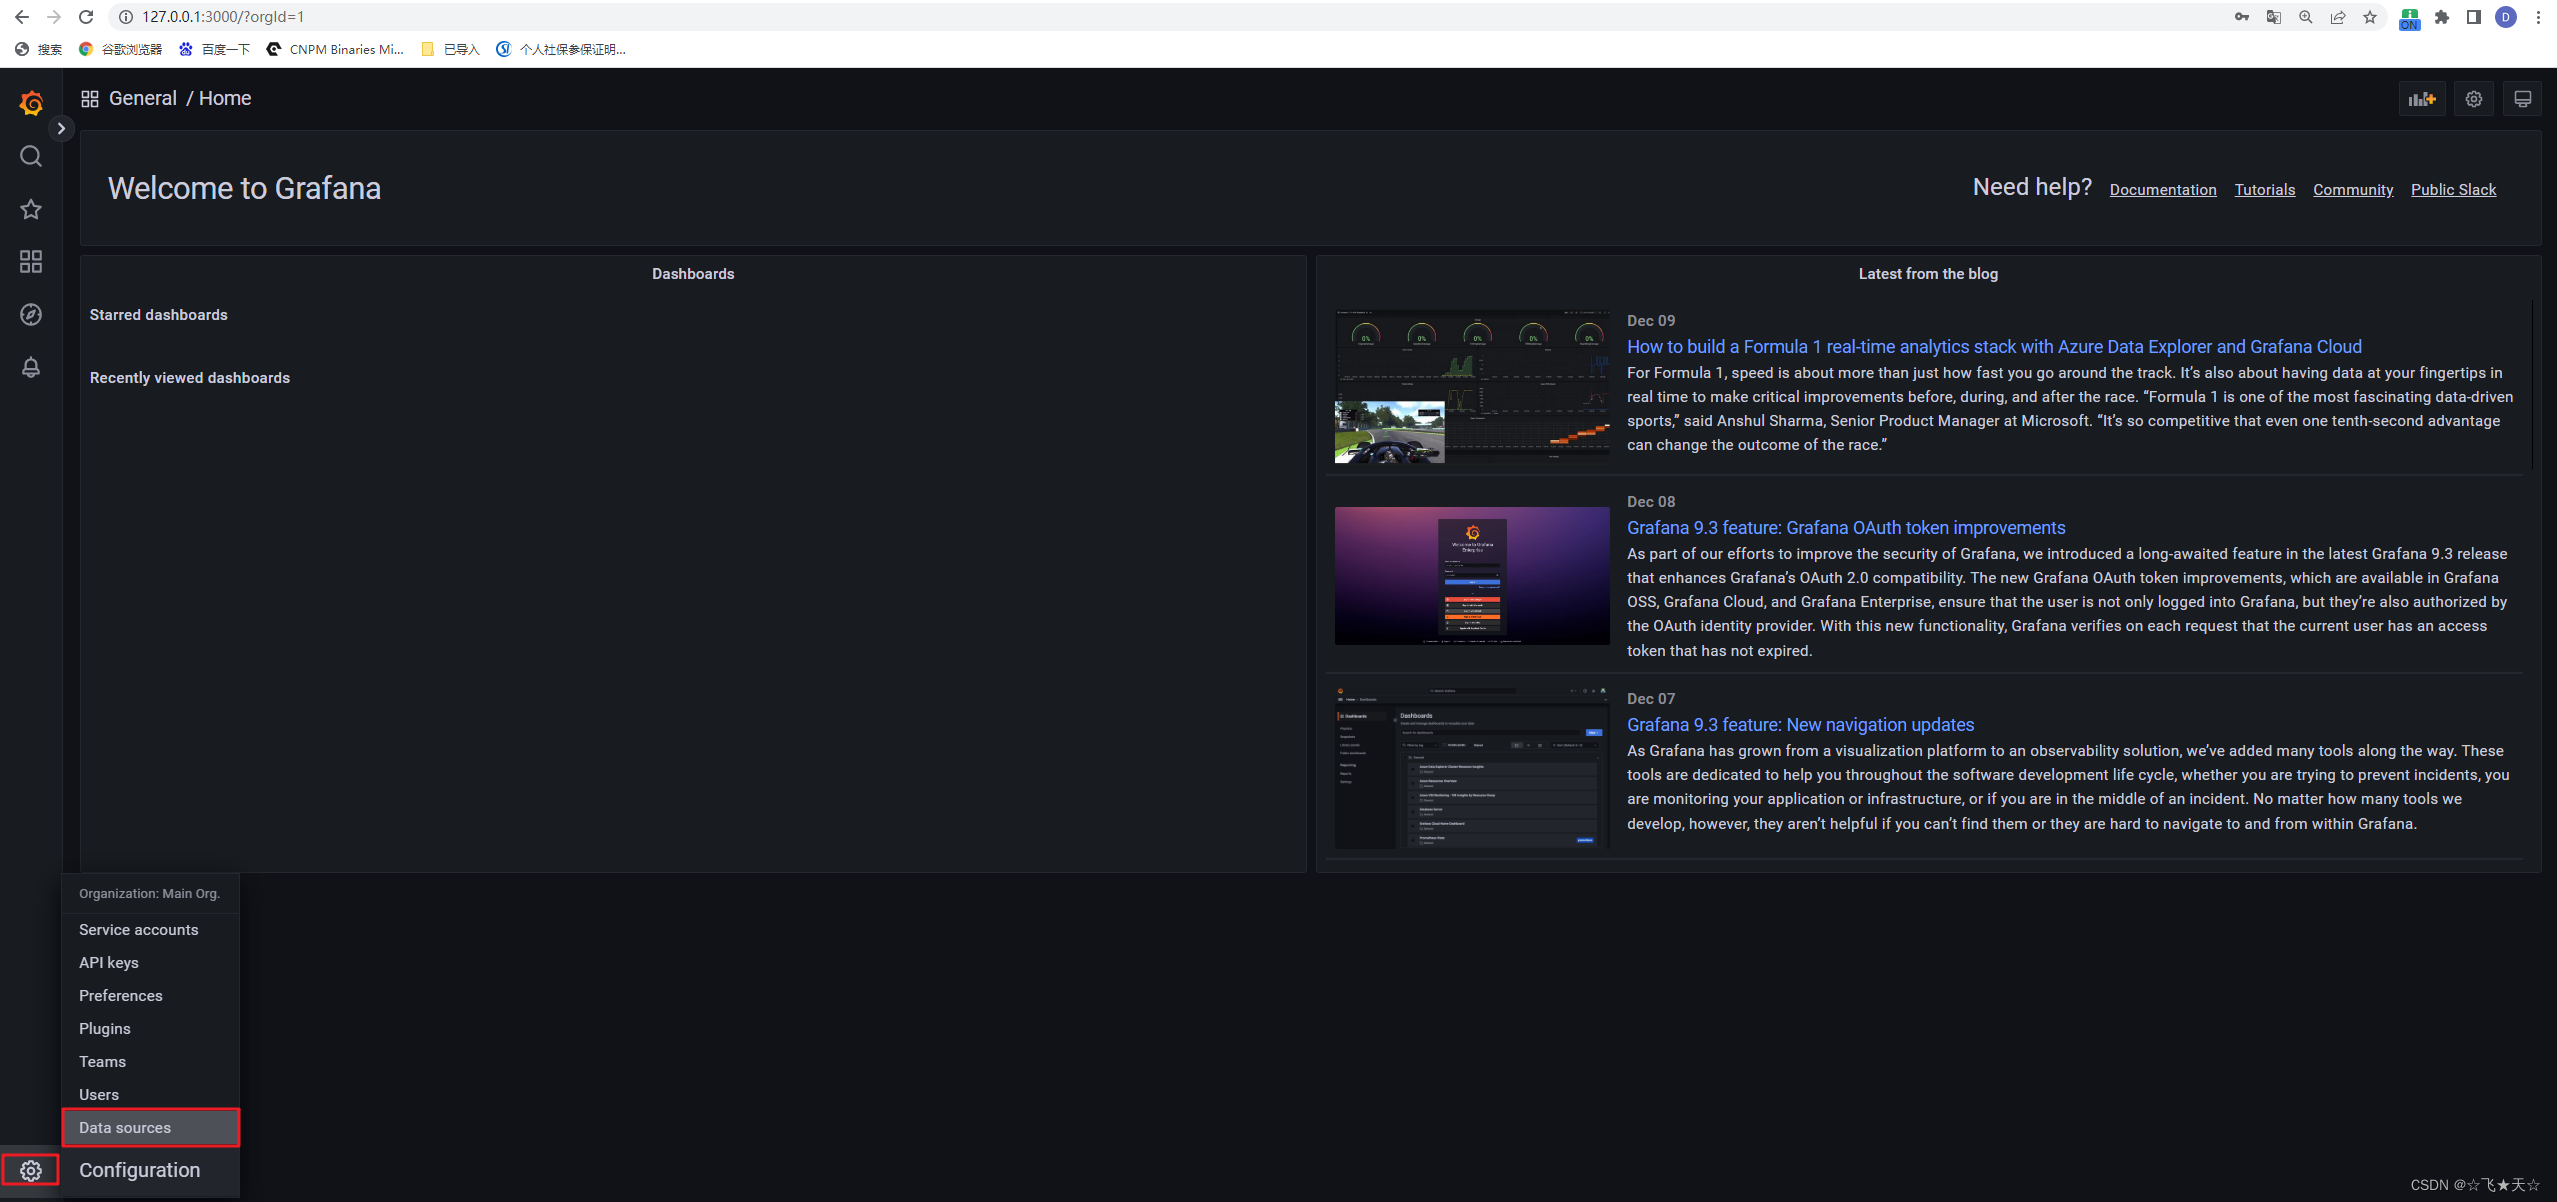
配置Prometheus数据源
点击左下角齿轮(设置),选中Date sources
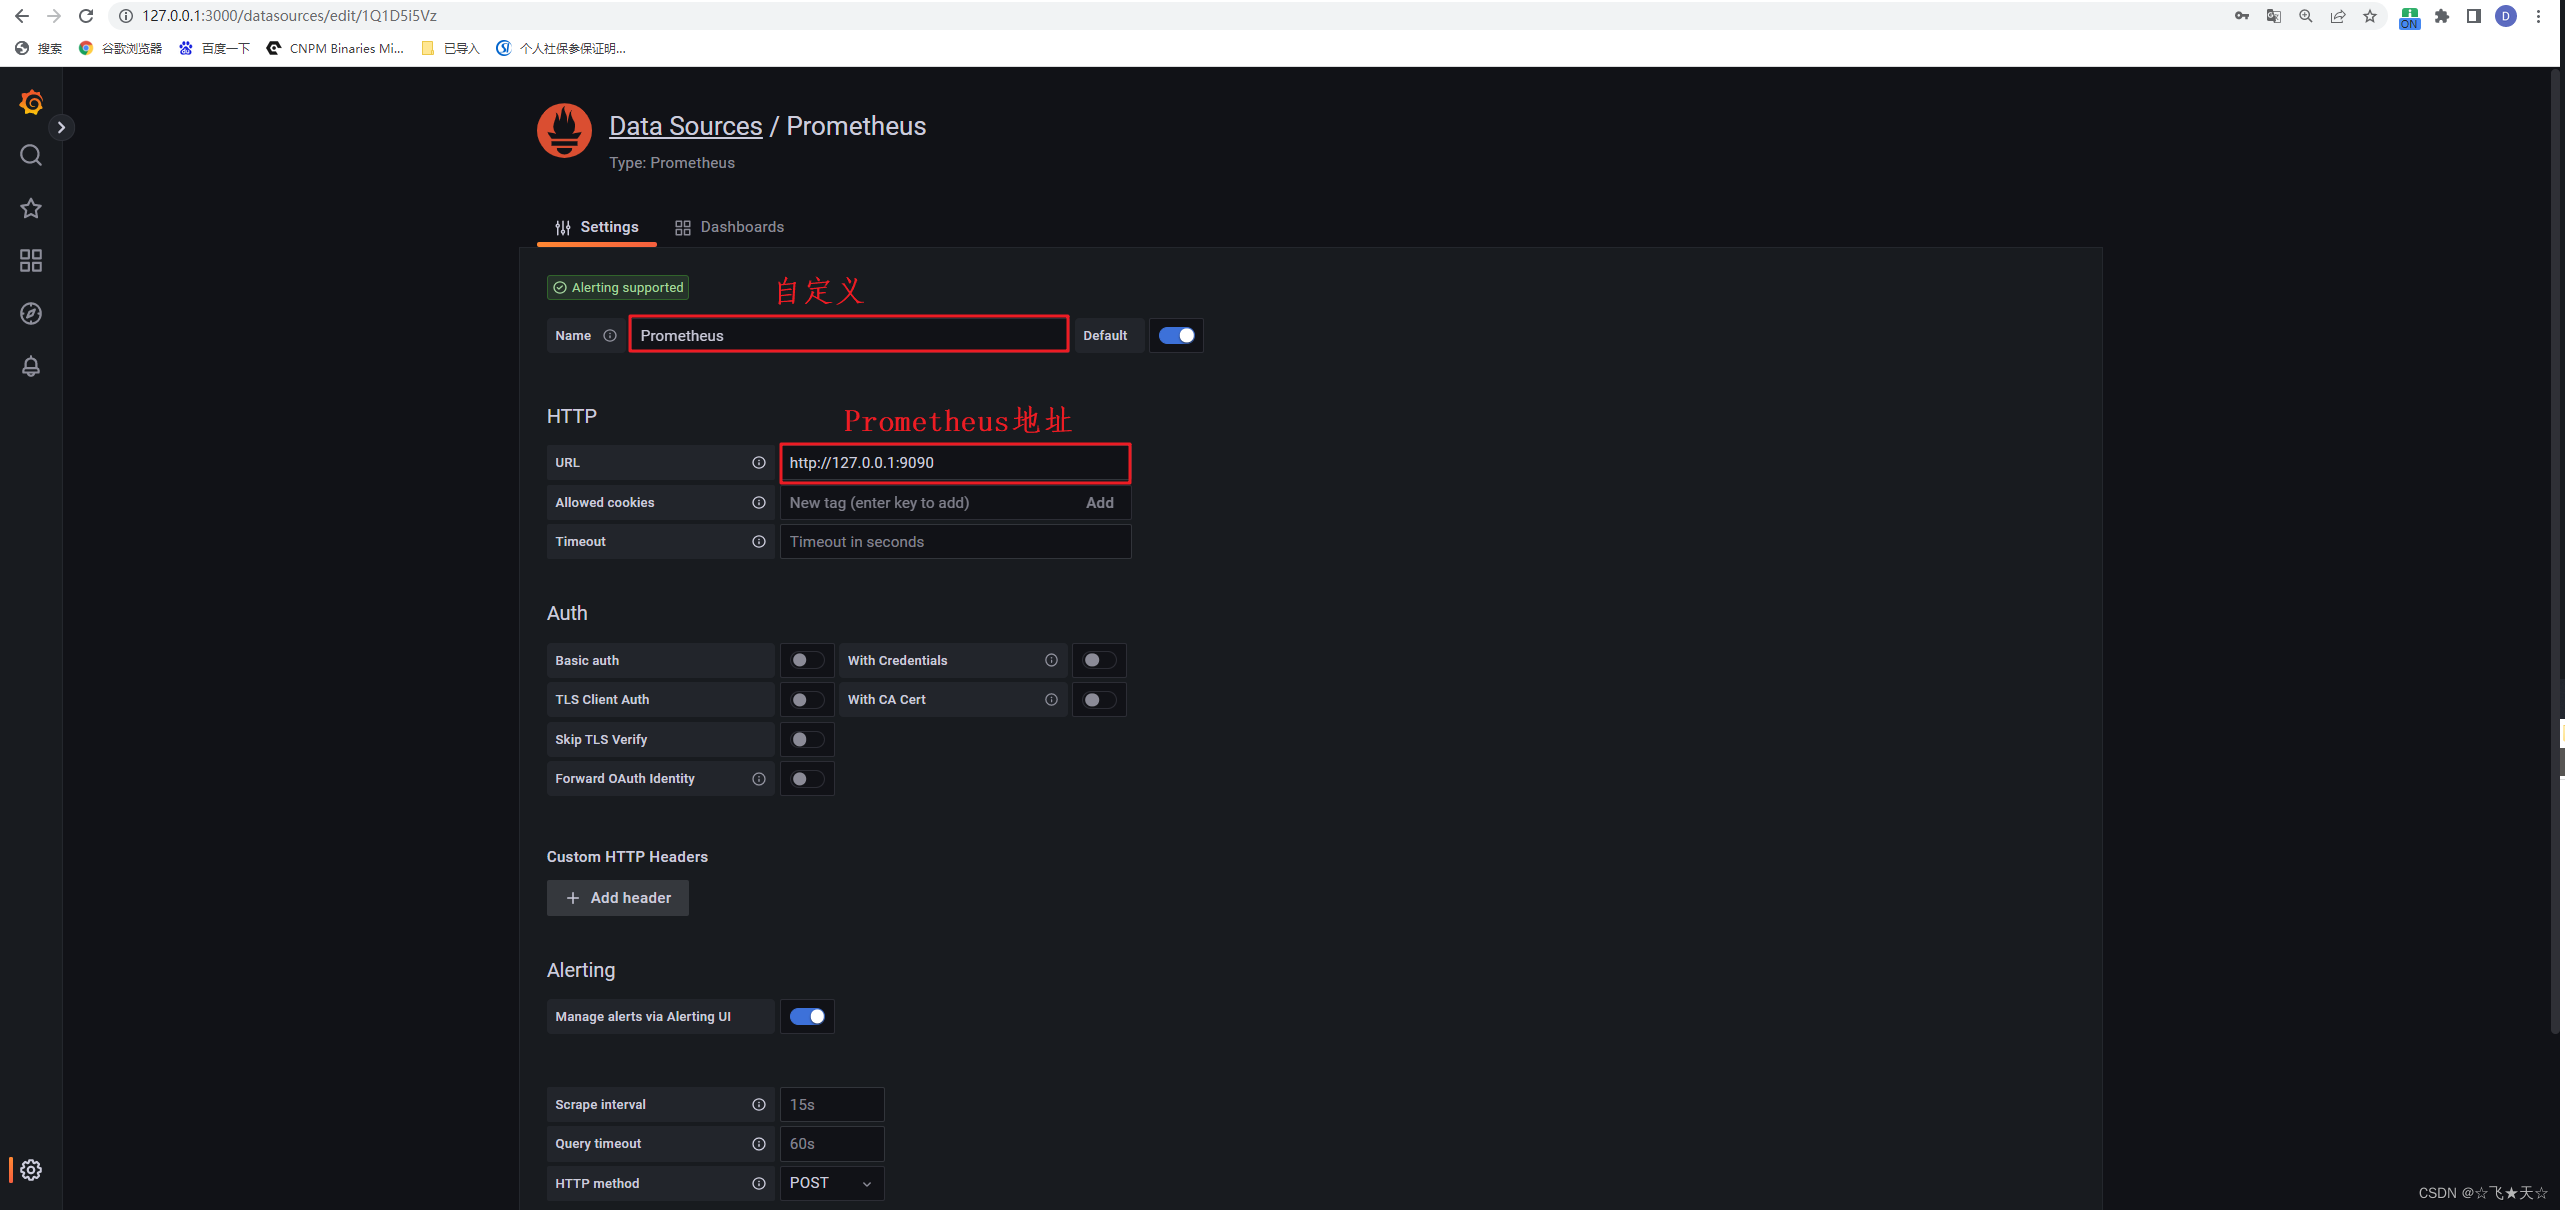
添加数据源,主要配置如下图
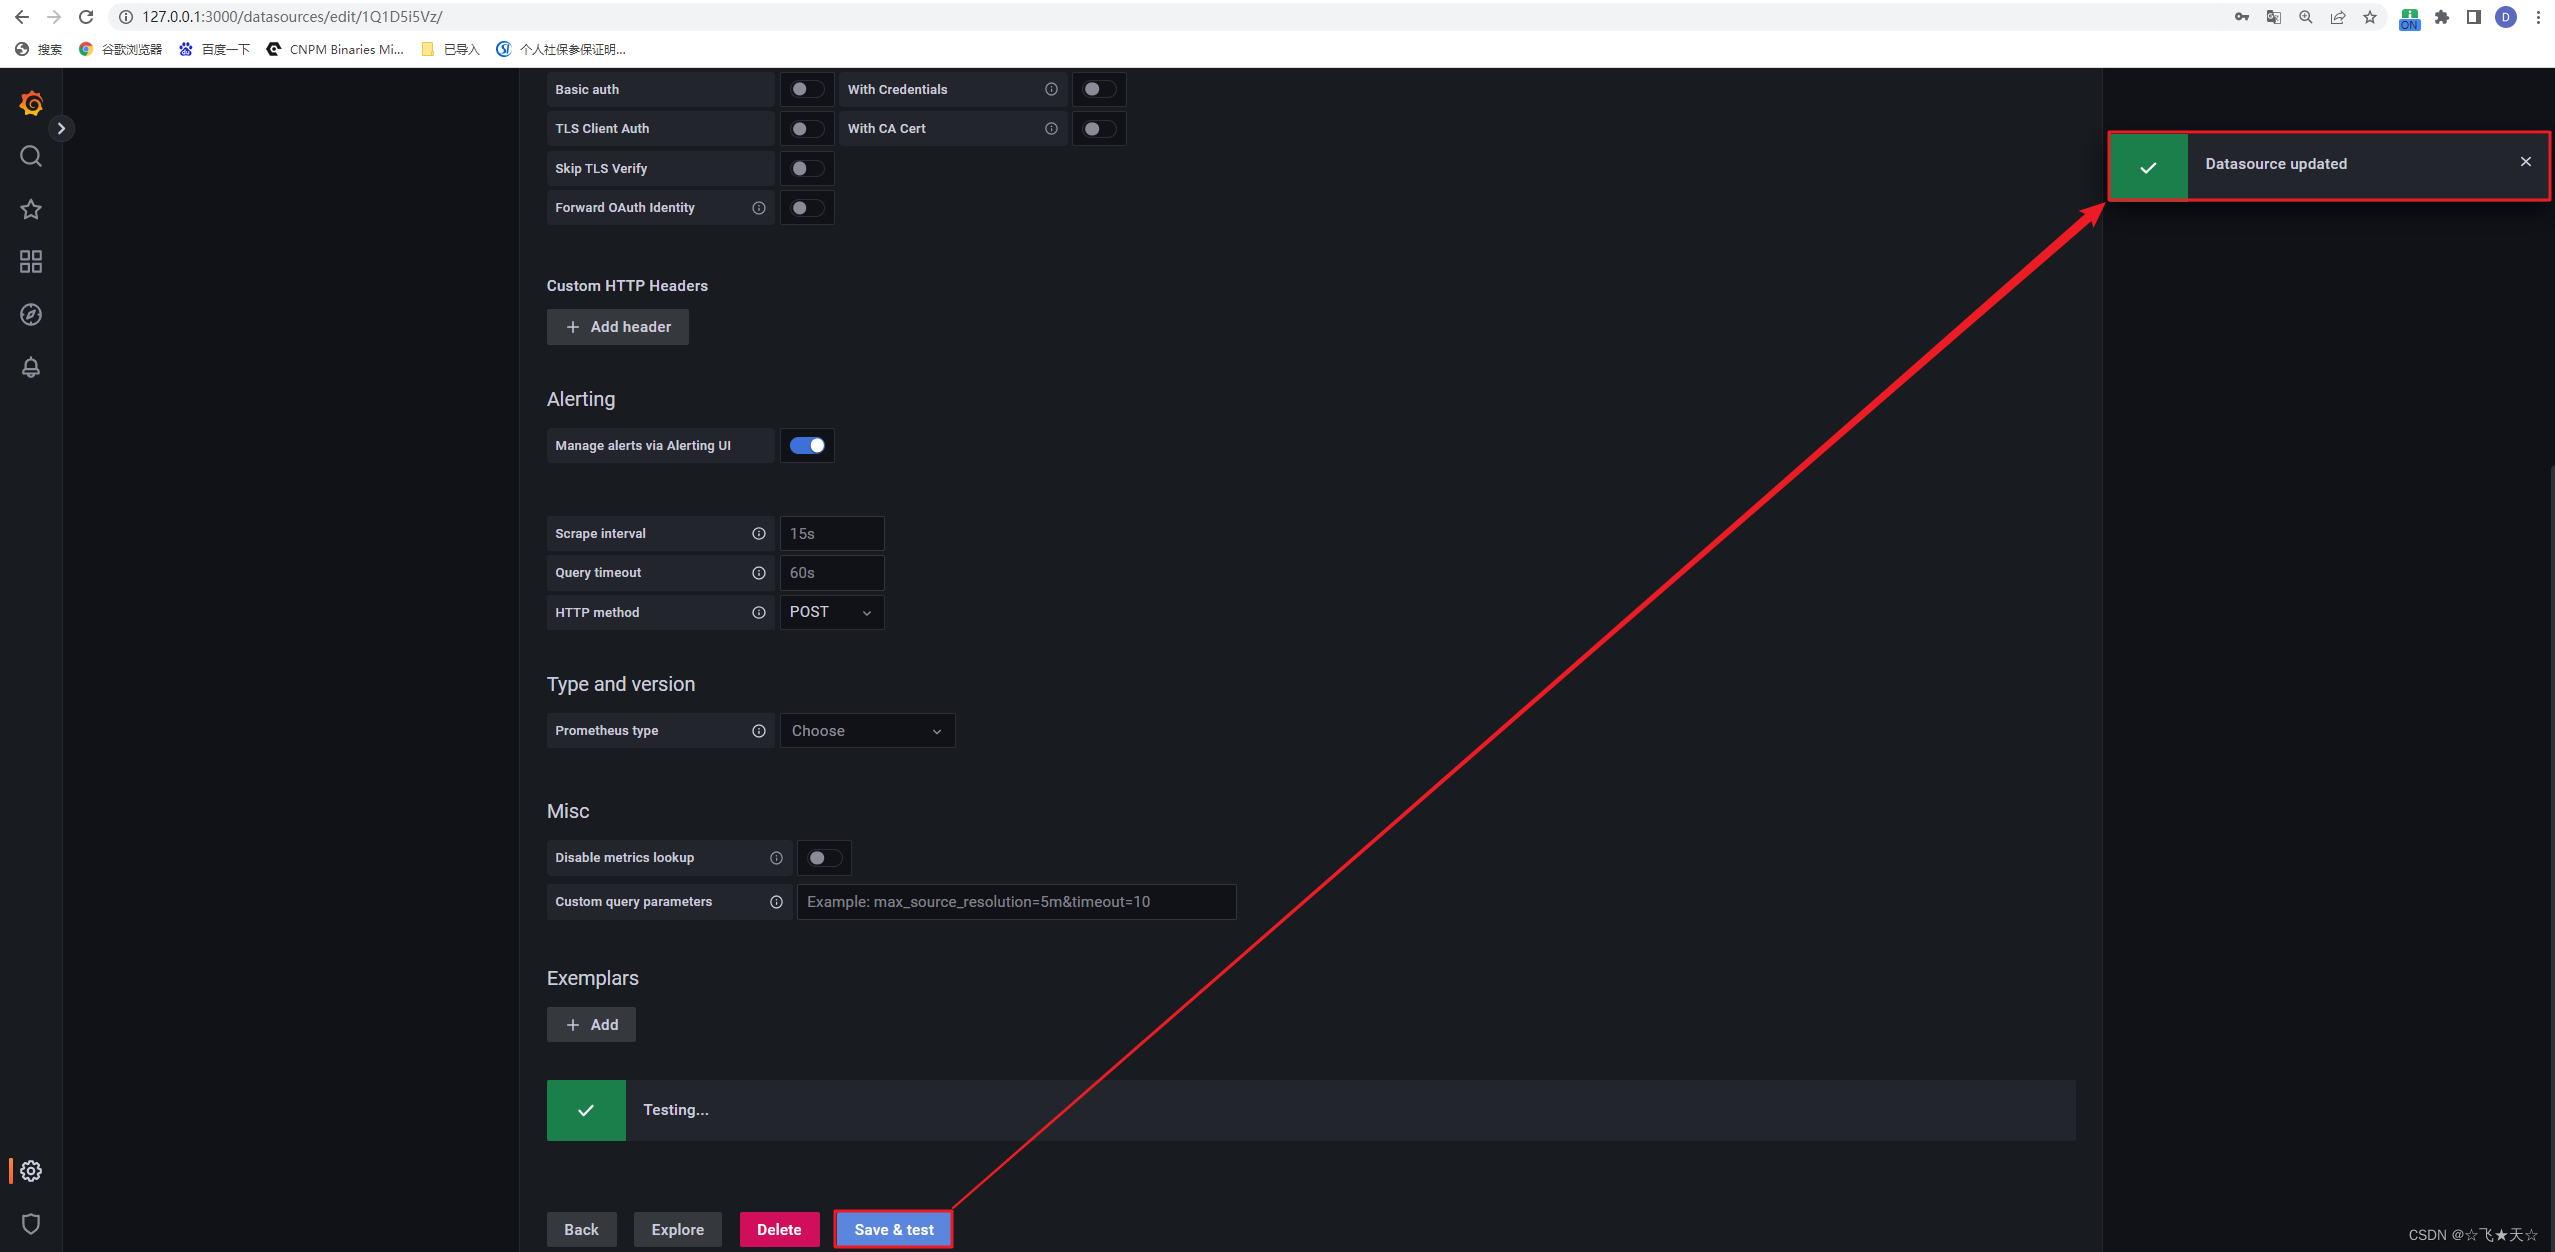
配置完成后,可验证是否通过
配置监控面板
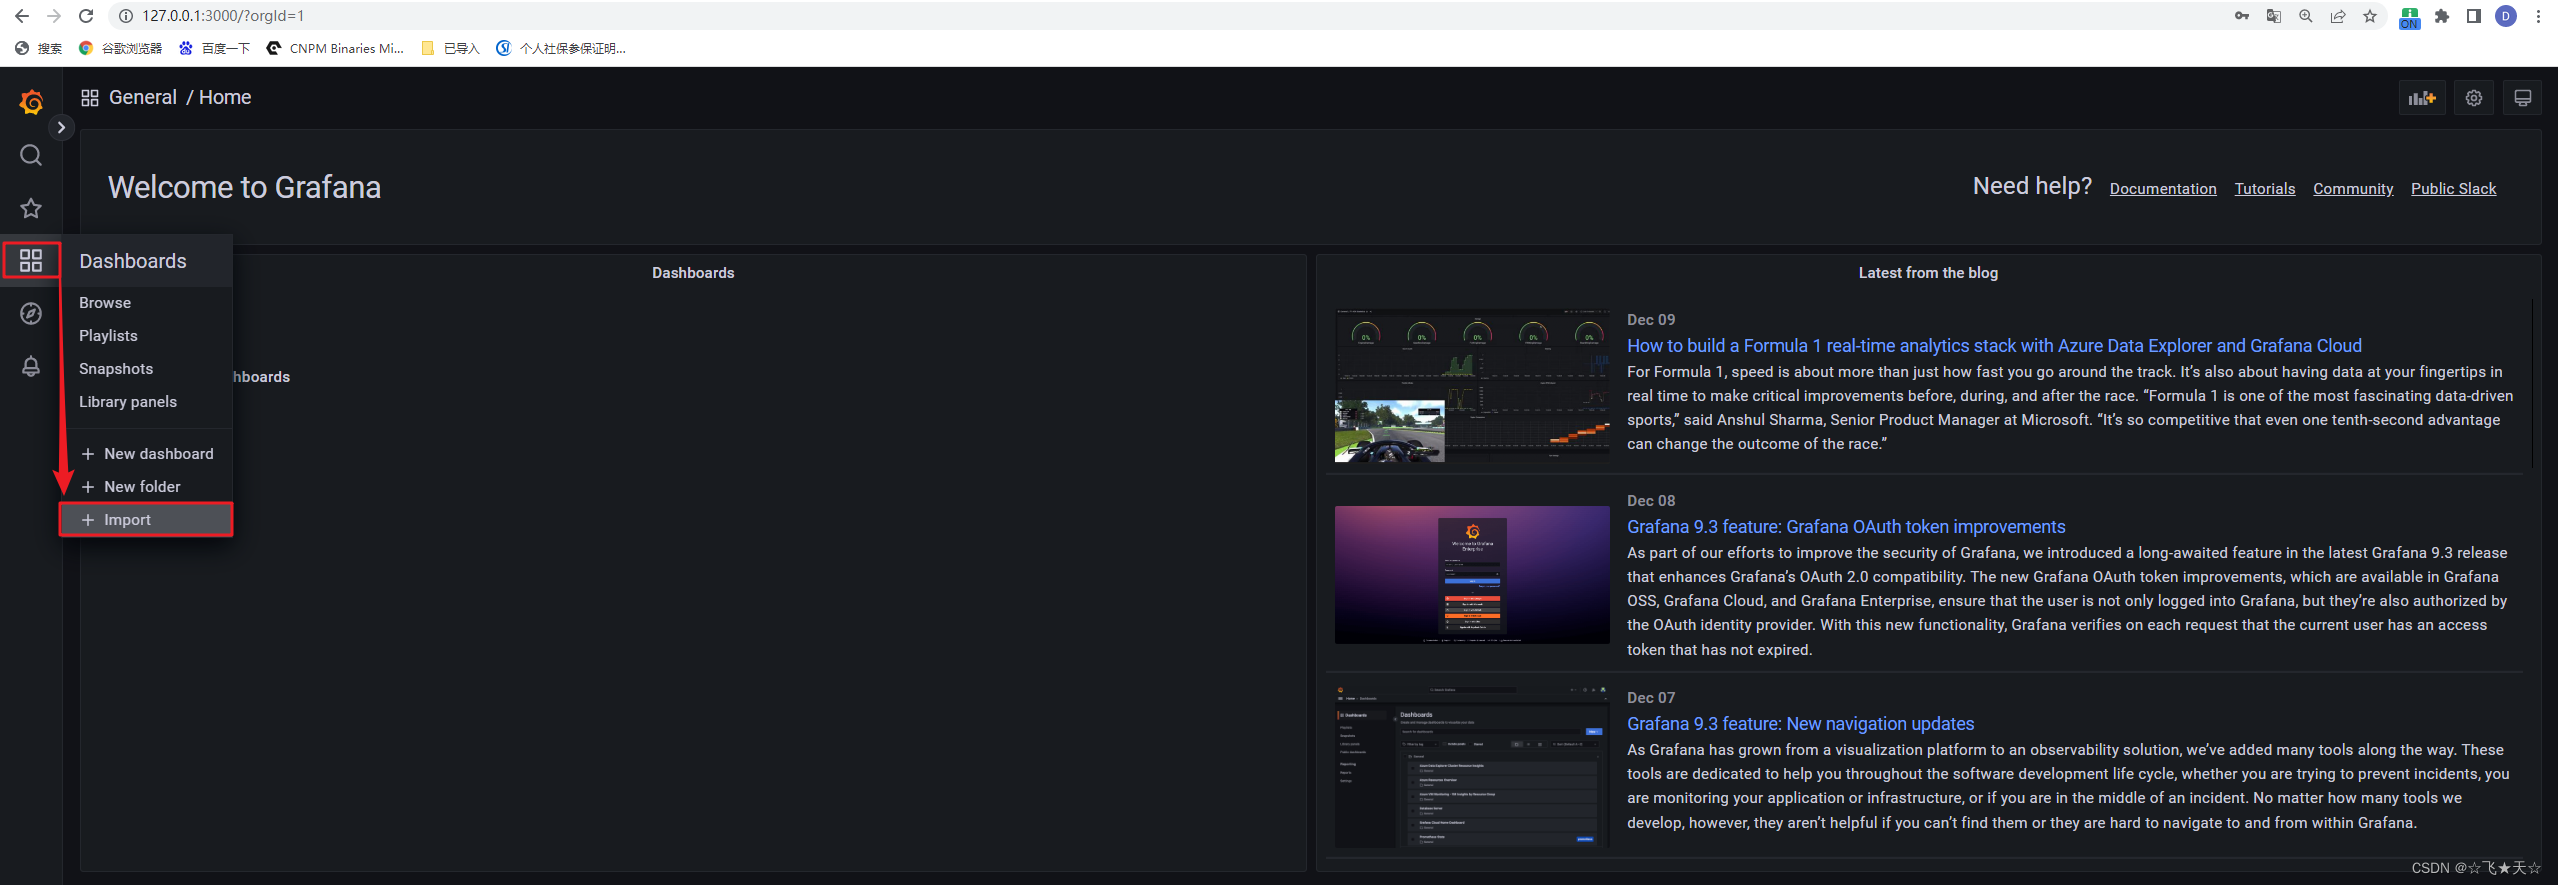
可点击 grafana的面板地址 或复制地址 https://grafana.com/grafana/dashboards/,寻找合适的监控显示面板,通过ID编号加载监控面板。
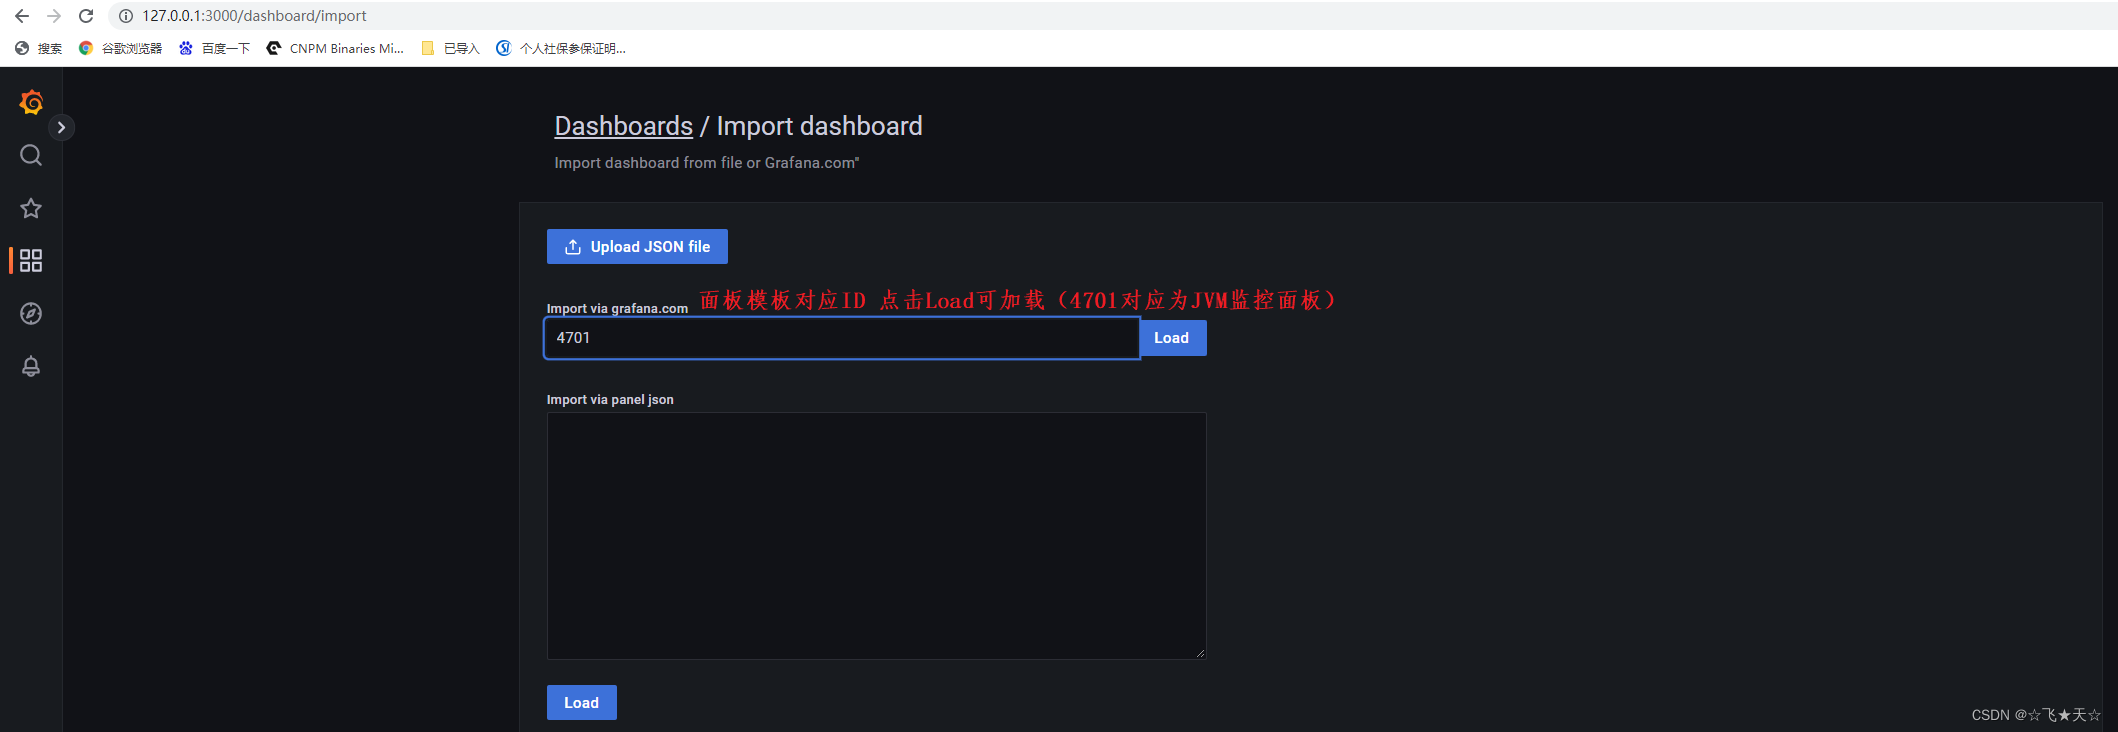
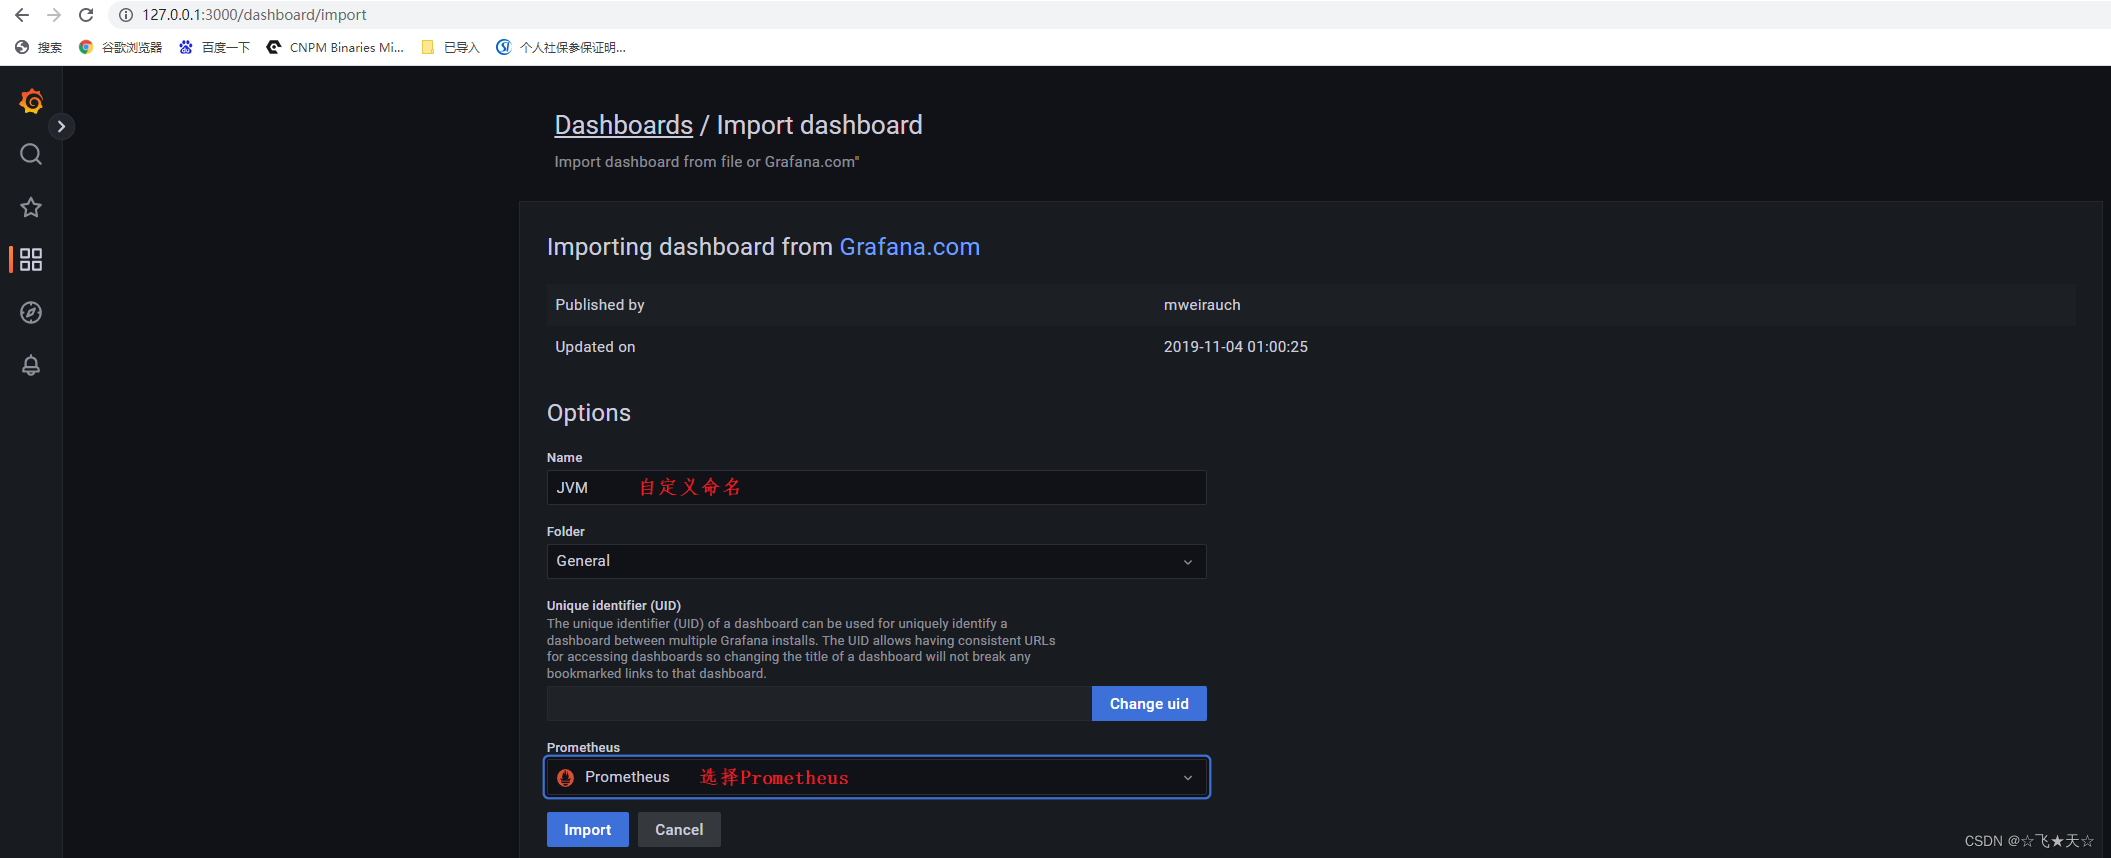
如下图进行配置,配置完成后,点击import及配置彻底完成!
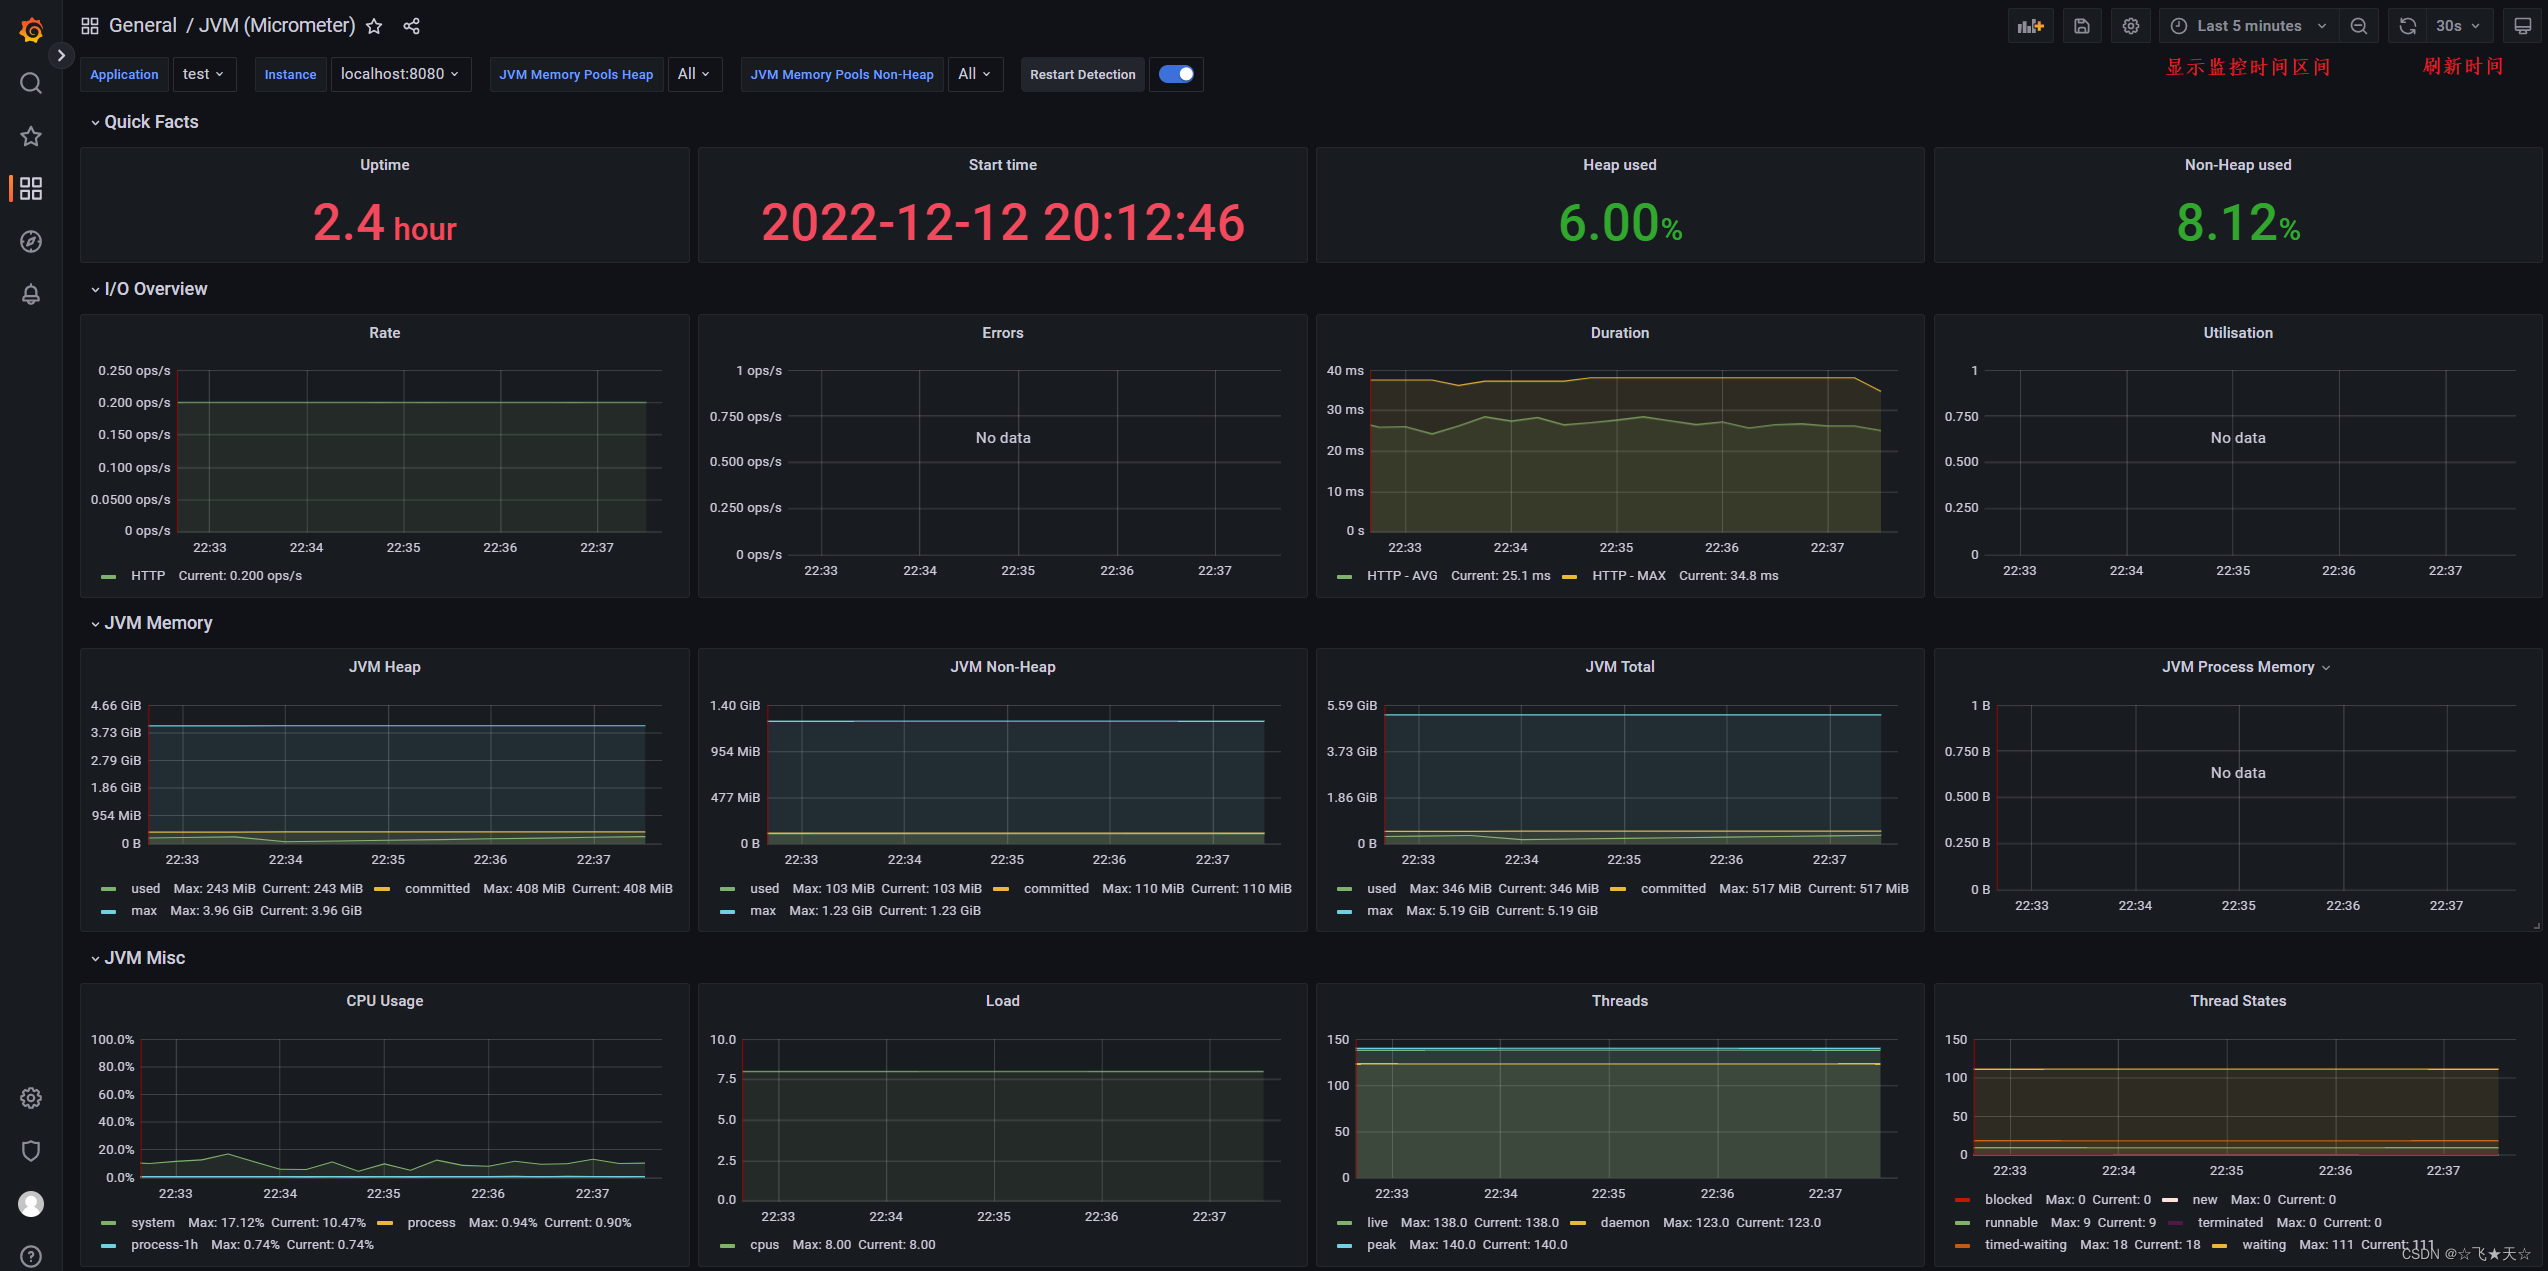
最终效果如下图


 3499
3499


 被折叠的 条评论
为什么被折叠?
被折叠的 条评论
为什么被折叠?
 到【灌水乐园】发言


