


prometheus 监控
prometheus 架构

prometheus 简介
Prometheus, a Cloud Native Computing Foundation project, is a systems and service monitoring system. It collects metrics from configured targets at given intervals, evaluates rule expressions, displays the results, and can trigger alerts when specified conditions are observed.
新特性
- A multi-dimensional data model (time series defined by metric name and set of key/value dimensions)
- PromQL, a powerful and flexible query language to leverage this dimensionality
- No dependency on distributed storage; single server nodes are autonomous
- An HTTP pull model for time series collection
- Pushing time series is supported via an intermediary gateway for batch jobs
- Targets are discovered via service discovery or static configuration
- Multiple modes of graphing and dashboarding support
- Support for hierarchical and horizontal federation
架构说明
pushgateway exporters
prometheus-server
alertmanager PromQL
webUI
grafana
安装
##下载安装包地址
https://prometheus.io/download/
prometheus 配置文件
global: 主要有四个属性
scrape_interval: 拉取 targets 的默认时间间隔。
scrape_timeout: 拉取一个 target 的超时时间。
evaluation_interval: 执行 rules 的时间间隔。
external_labels: 额外的属性,会添加到拉取的数据并存到数据库中。
#配置文件修改
#my global config
global:
scrape_interval: 15s # Set the scrape interval to every 15 seconds. Default is every 1 minute.
evaluation_interval: 15s # Evaluate rules every 15 seconds. The default is every 1 minute.
scrape_timeout is set to the global default (10s).
#Alertmanager configuration 告警配置
alerting:
alertmanagers:
- static_configs:
- targets:
# - alertmanager:9093
#Load rules once and periodically evaluate them according to the global ‘evaluation_interval’. 告警模板路径
rule_files:
- “first_rules.yml”
- “second_rules.yml”
#A scrape configuration containing exactly one endpoint to scrape: 抓取配置
#Here it’s Prometheus itself.
scrape_configs:
#The job name is added as a label job=<job_name> to any timeseries scraped from this config.
-
job_name: “prometheus”
metrics_path defaults to ‘/metrics’
scheme defaults to ‘http’.
static_configs:
- targets: [“localhost:9090”]
-
job_name: “node_exporter”
static_configs:- targets: [‘192.168.1.152:9100’,‘192.168.1.150:9100’]
开机自启配置
vim /usr/lib/systemd/system/prometheus.service
[Unit]
Description=prometheus
Documentation=https://prometheus.io
After=network.target
[Service]
ExecStart=/usr/local/prometheus/promethues-2.40.2/prometheus
–config.file=/usr/local/prometheus/prometheus-2.40.2/prometheus.yml
Restart=on-failure
RestartSec=10
StandardOutput=syslog
StandardError=syslog
[Install]
WantedBy=multi-user.target
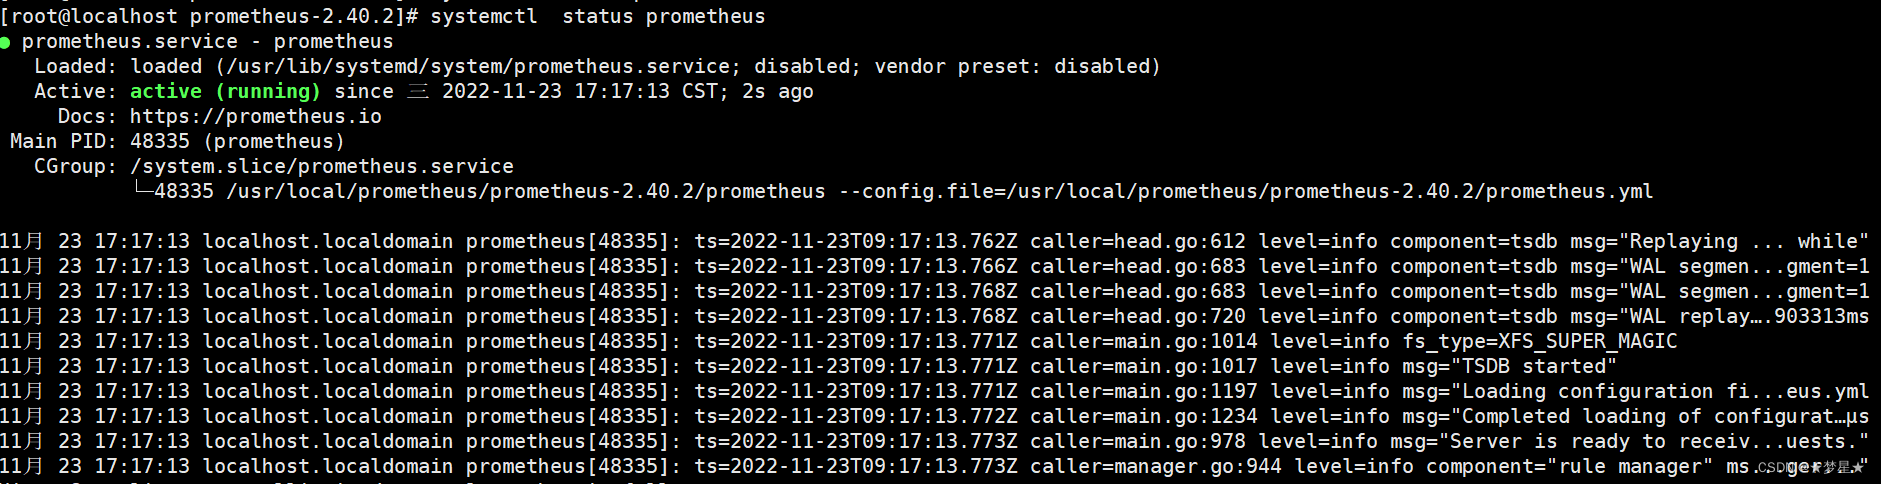
执行命令
systemctl enable prometheus
systemctl start prometheus
systemctl status prometheus
node_exporter 开机自启配置
vim /usr/lib/systemd/system/node_server.service
[Unit]
Description=node_exporter
Documentation=node_exporter
After=network.target
[Service]
ExecStart=/usr/local/prometheus/node_exporter-1.4.0/node_exporter
Restart=on-failure
RestartSec=10
StandardOutput=syslog
StandardError=syslog
[Install]
WantedBy=multi-user.target
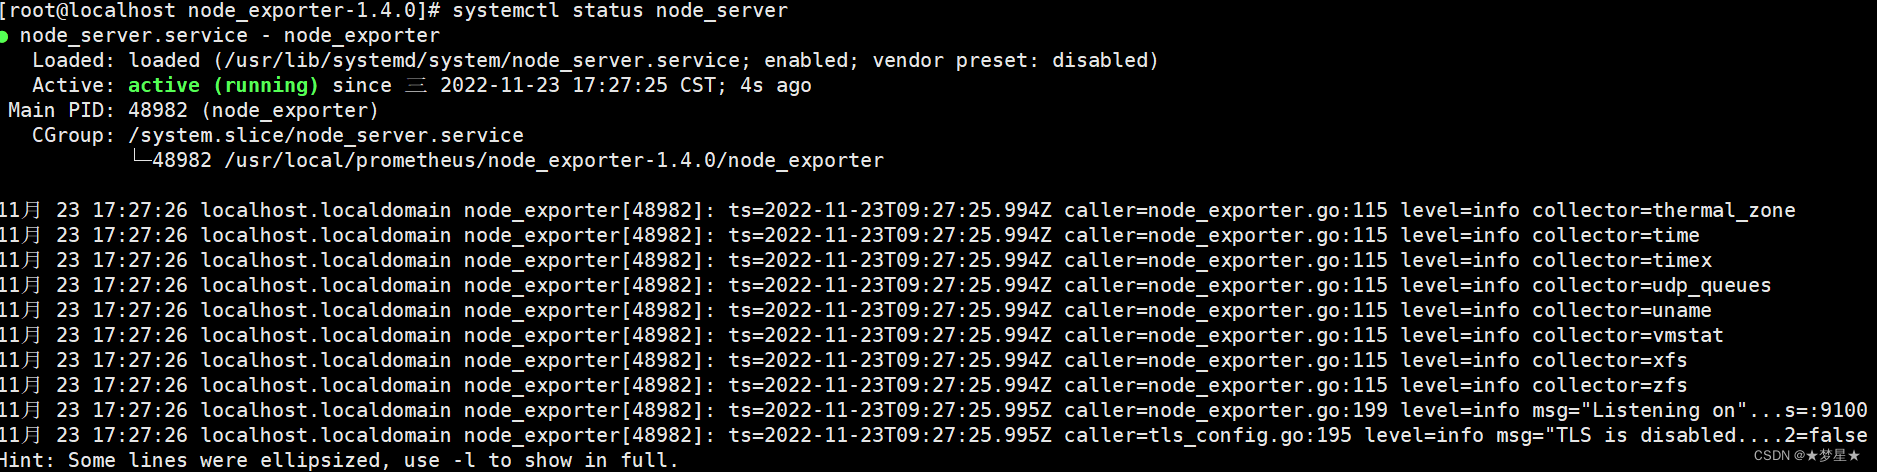
执行命令
systemctl daemon-reload
systemctl start node_server
systemctl enable node_server
systemctl status node_server
grafana 安装
上传安装包到服务器,执行命令
yum -y install grafana-enterprise-9.2.5-1.x86_64.rpm
service grafana-server start
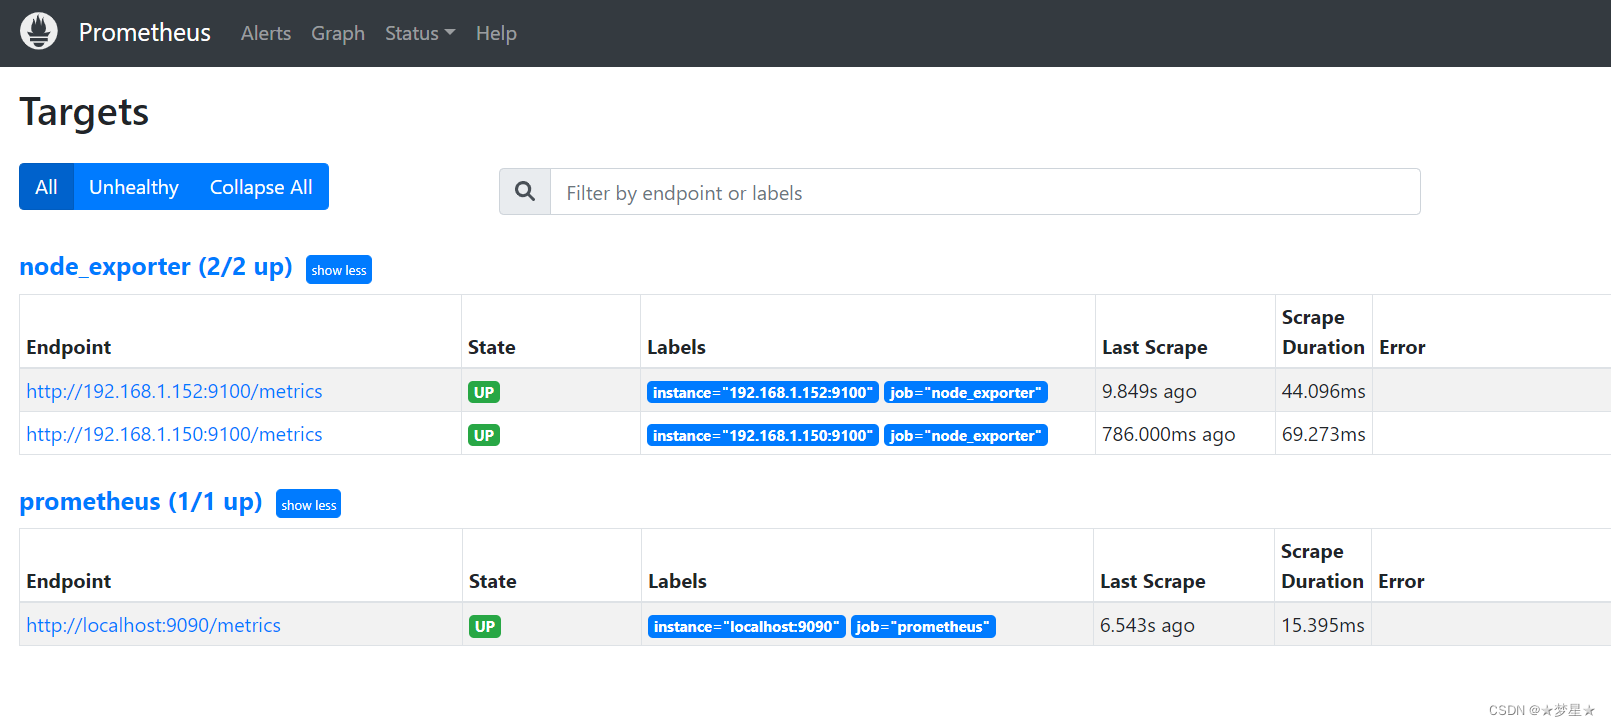
prometheus 控制台查看
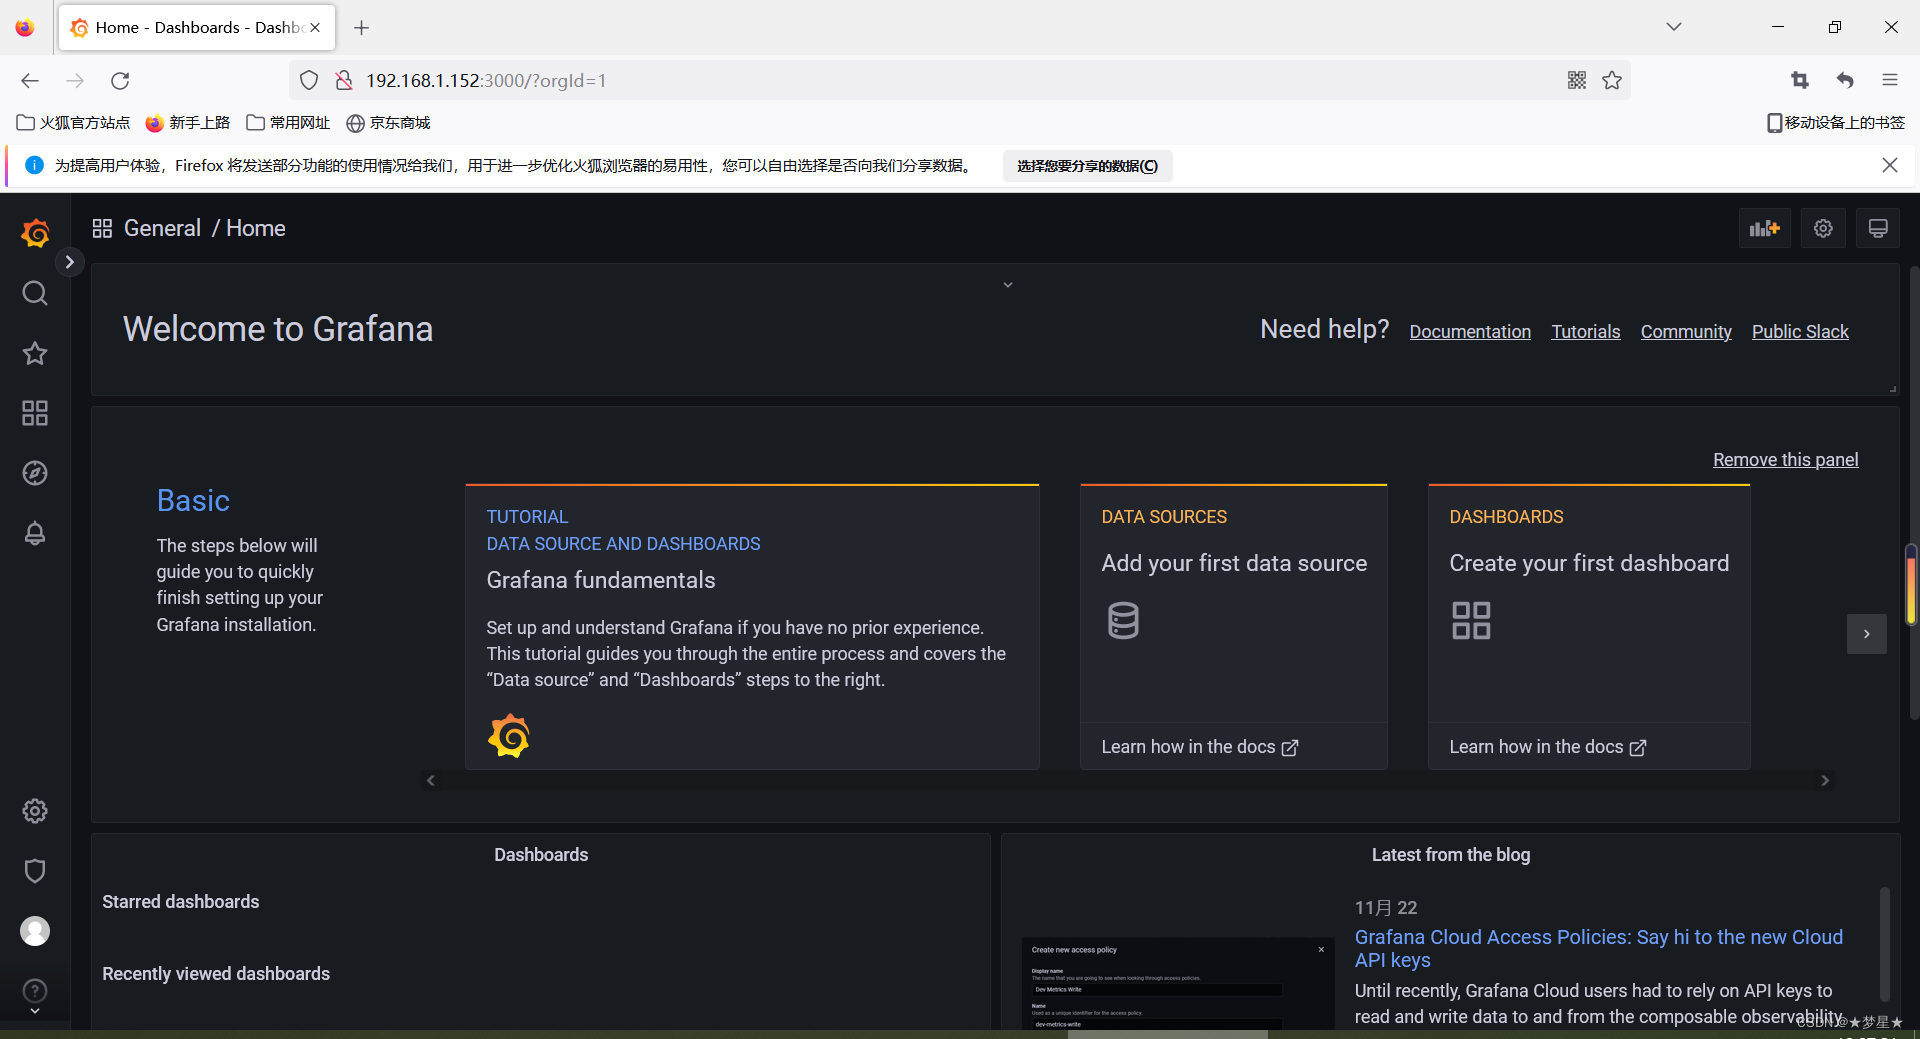
grafana控制台登录
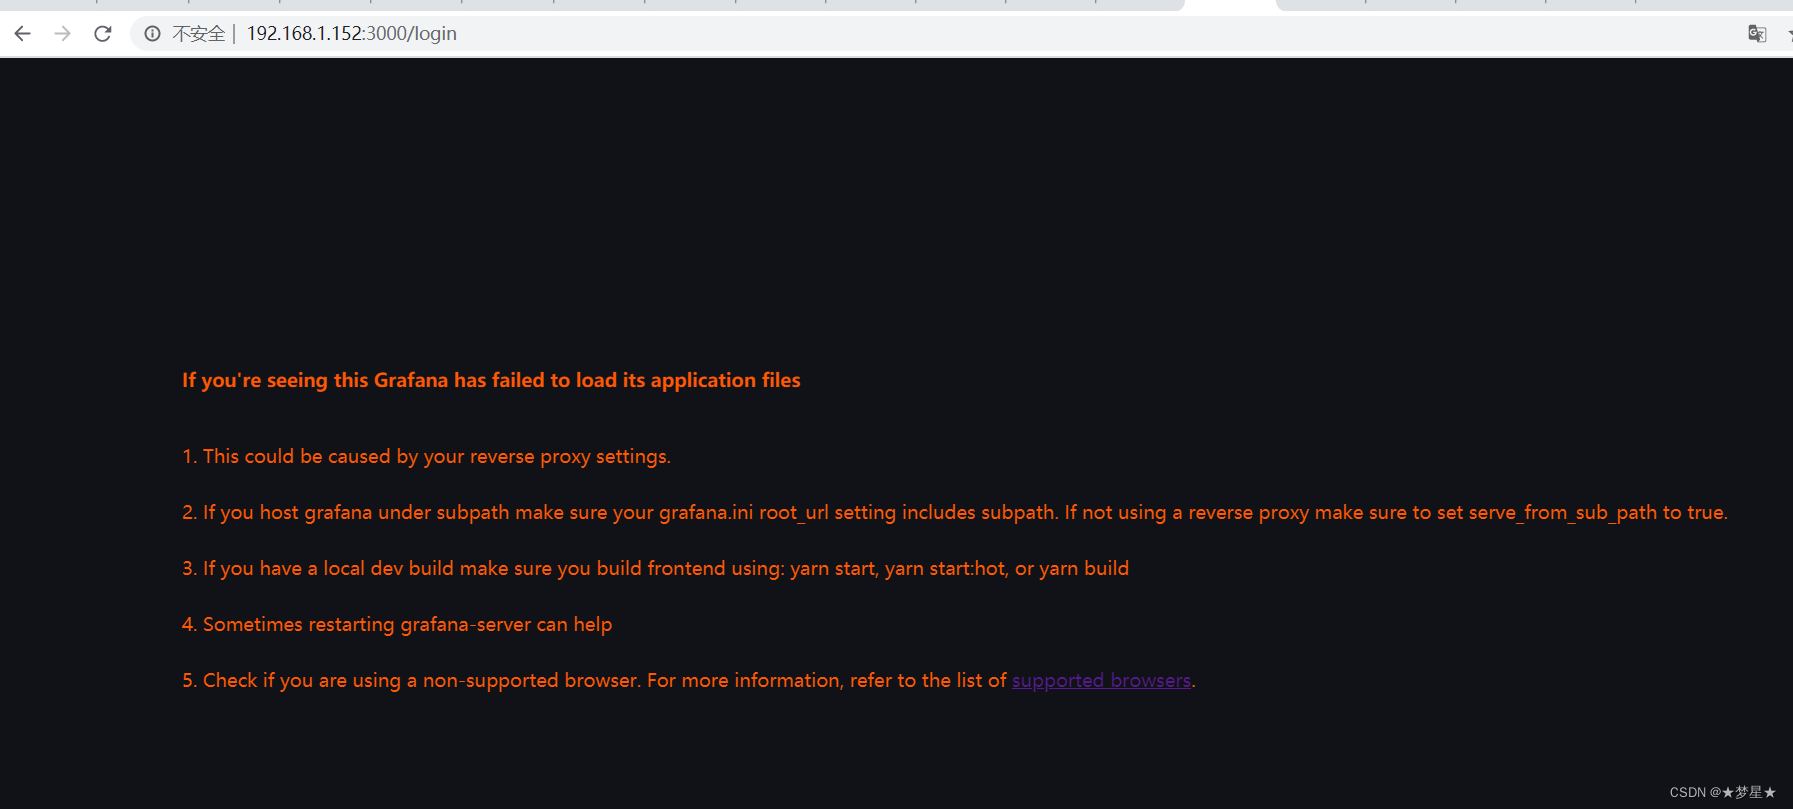
将使用火狐浏览器登录,显示正常
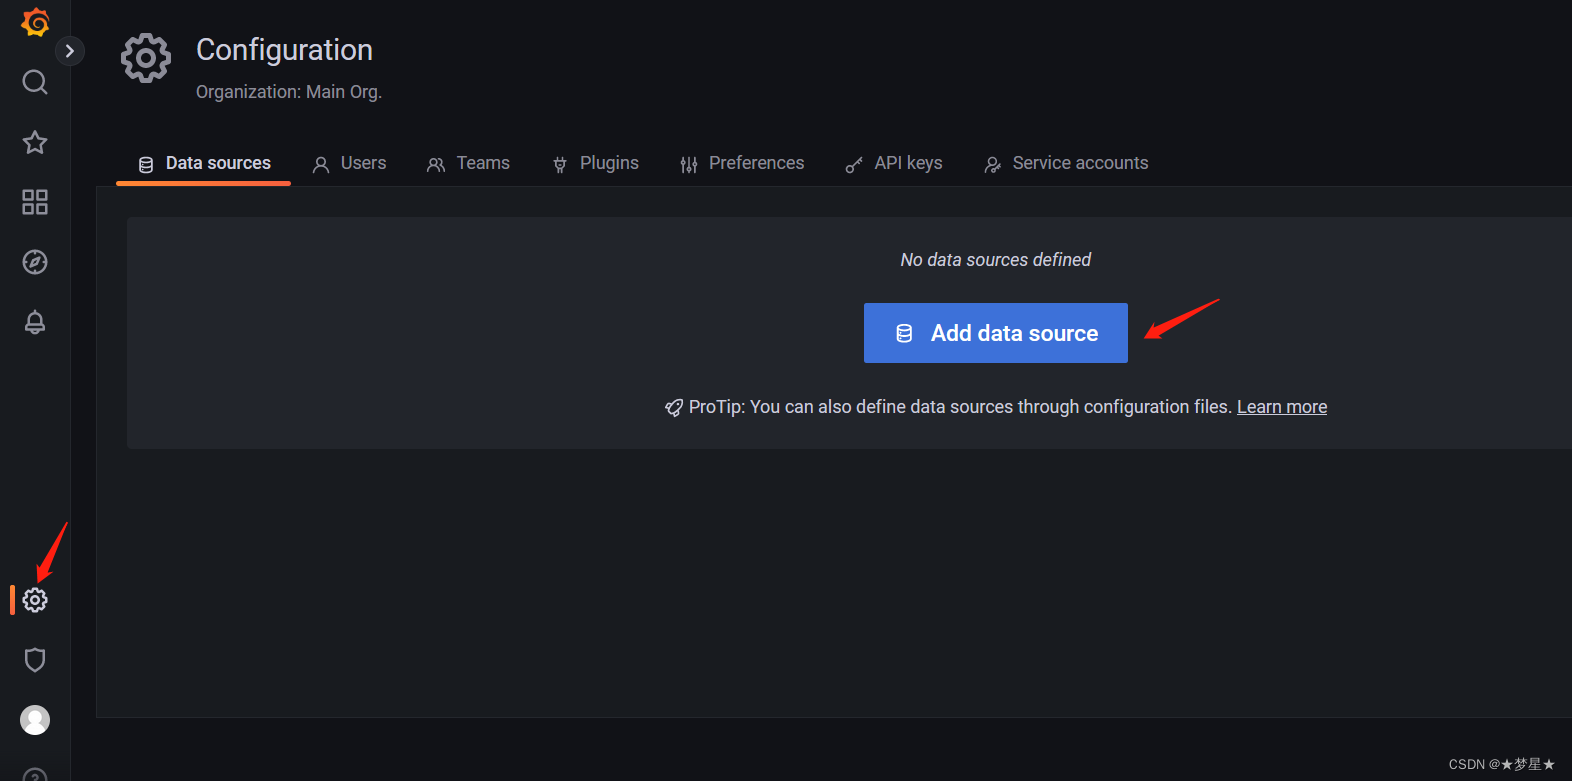
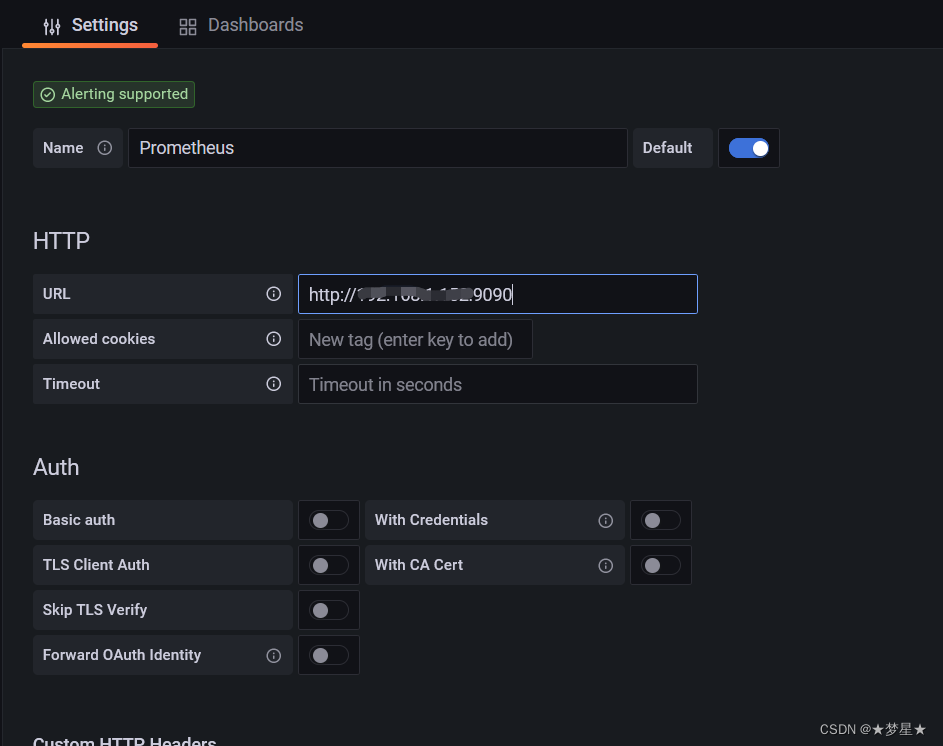
在grafana面板添加prometheus DataSource
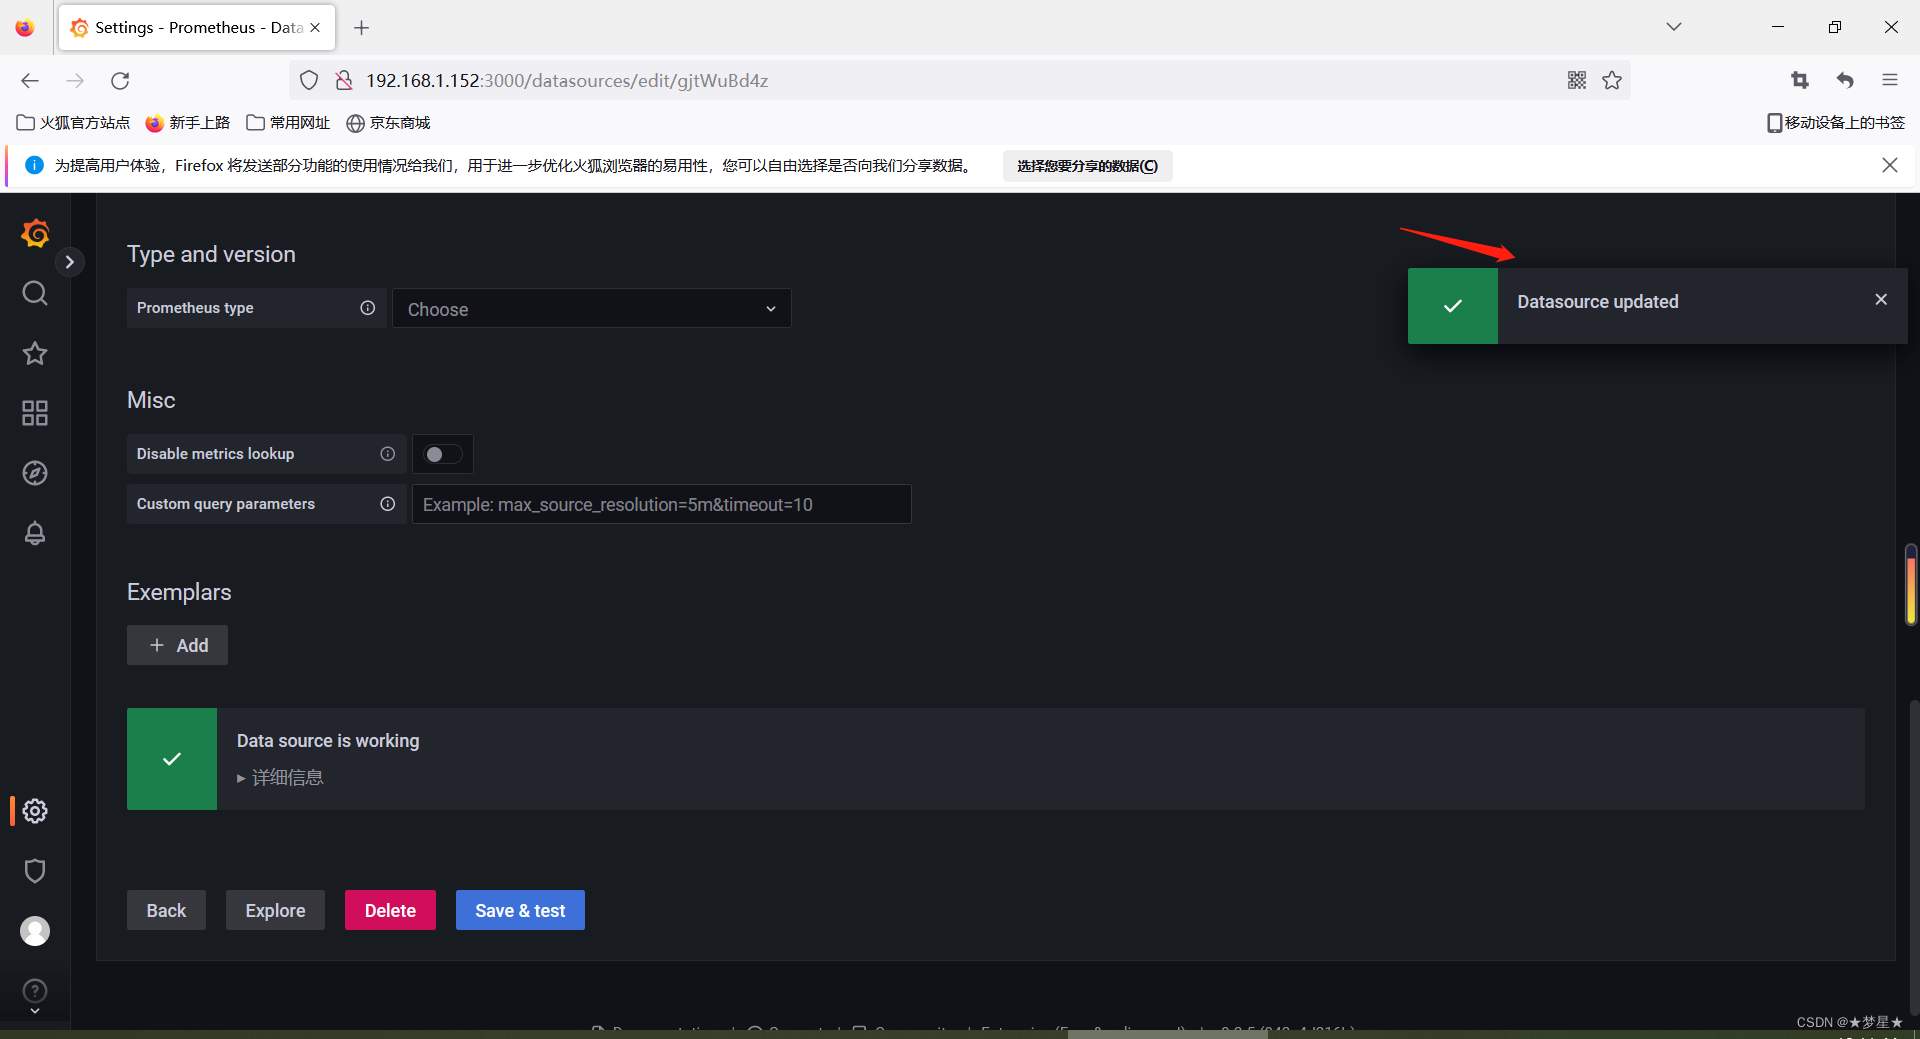
显示DataSource updated内容表示添加成功
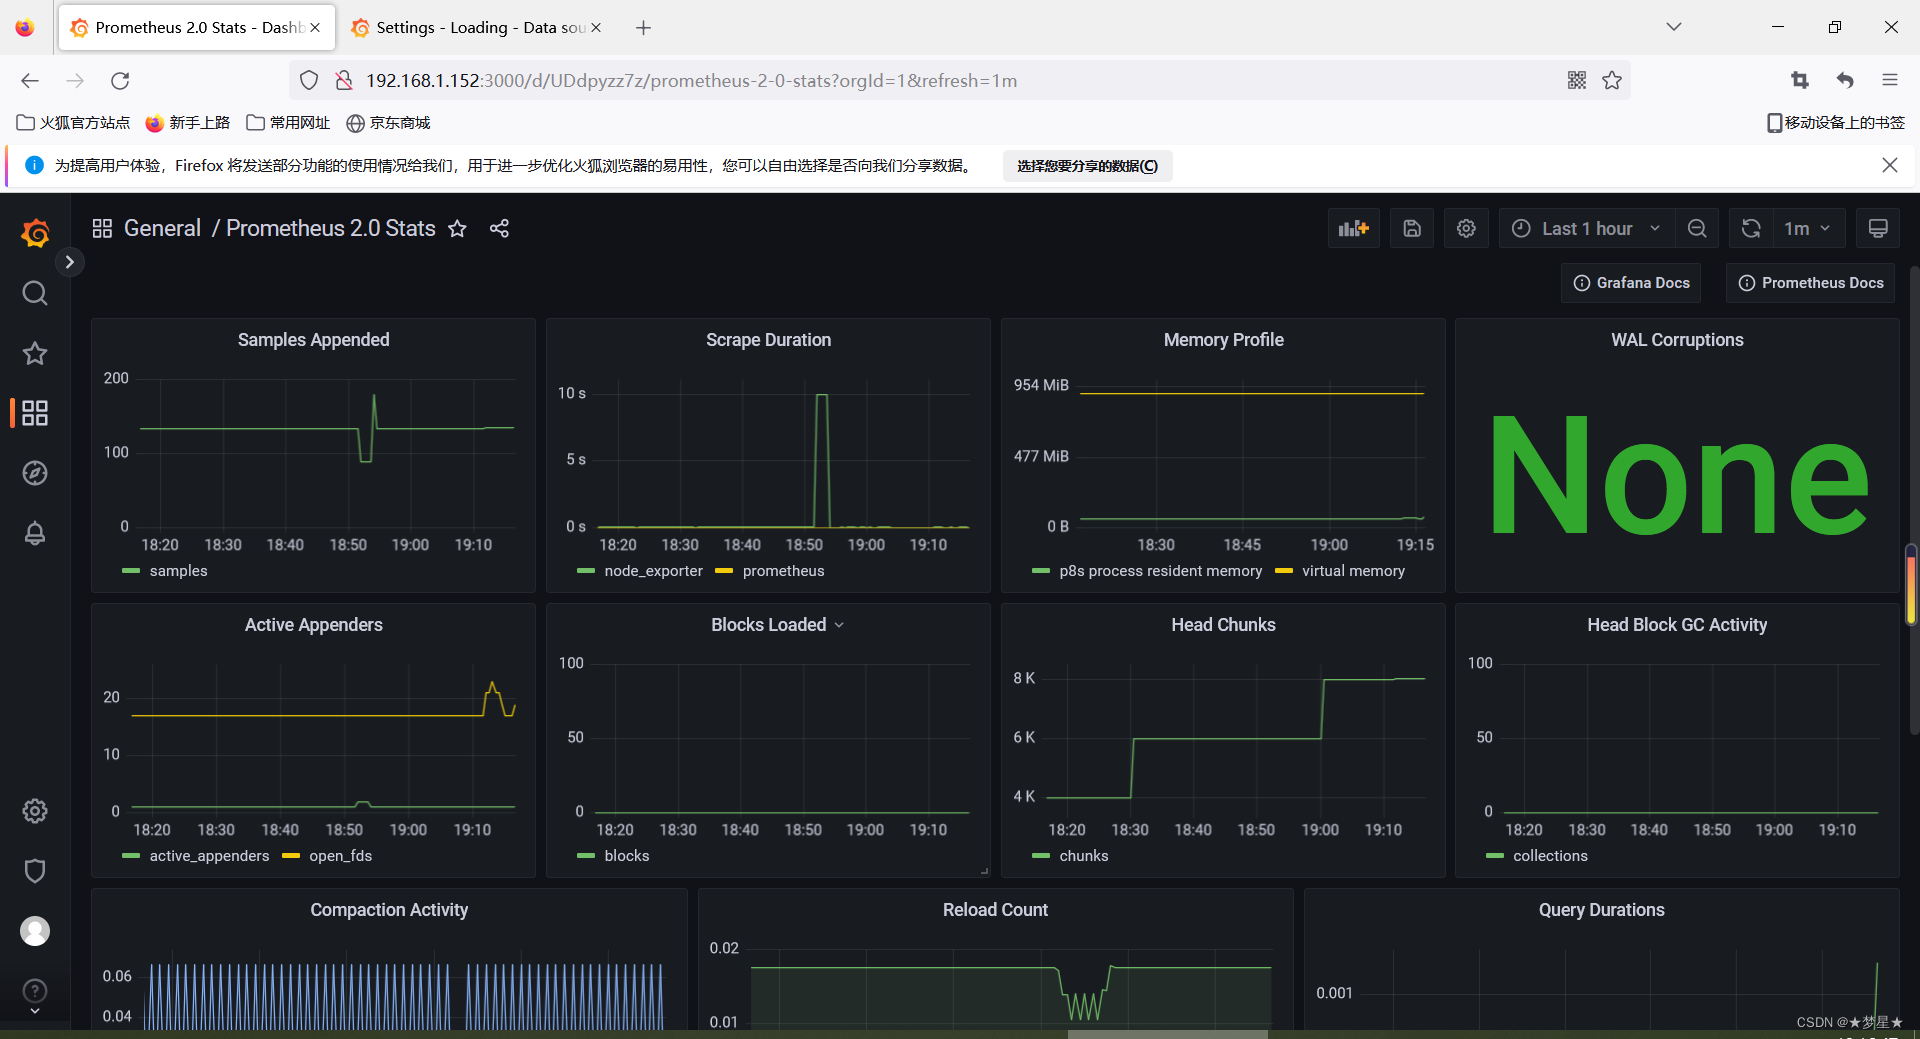
导入Dashboards
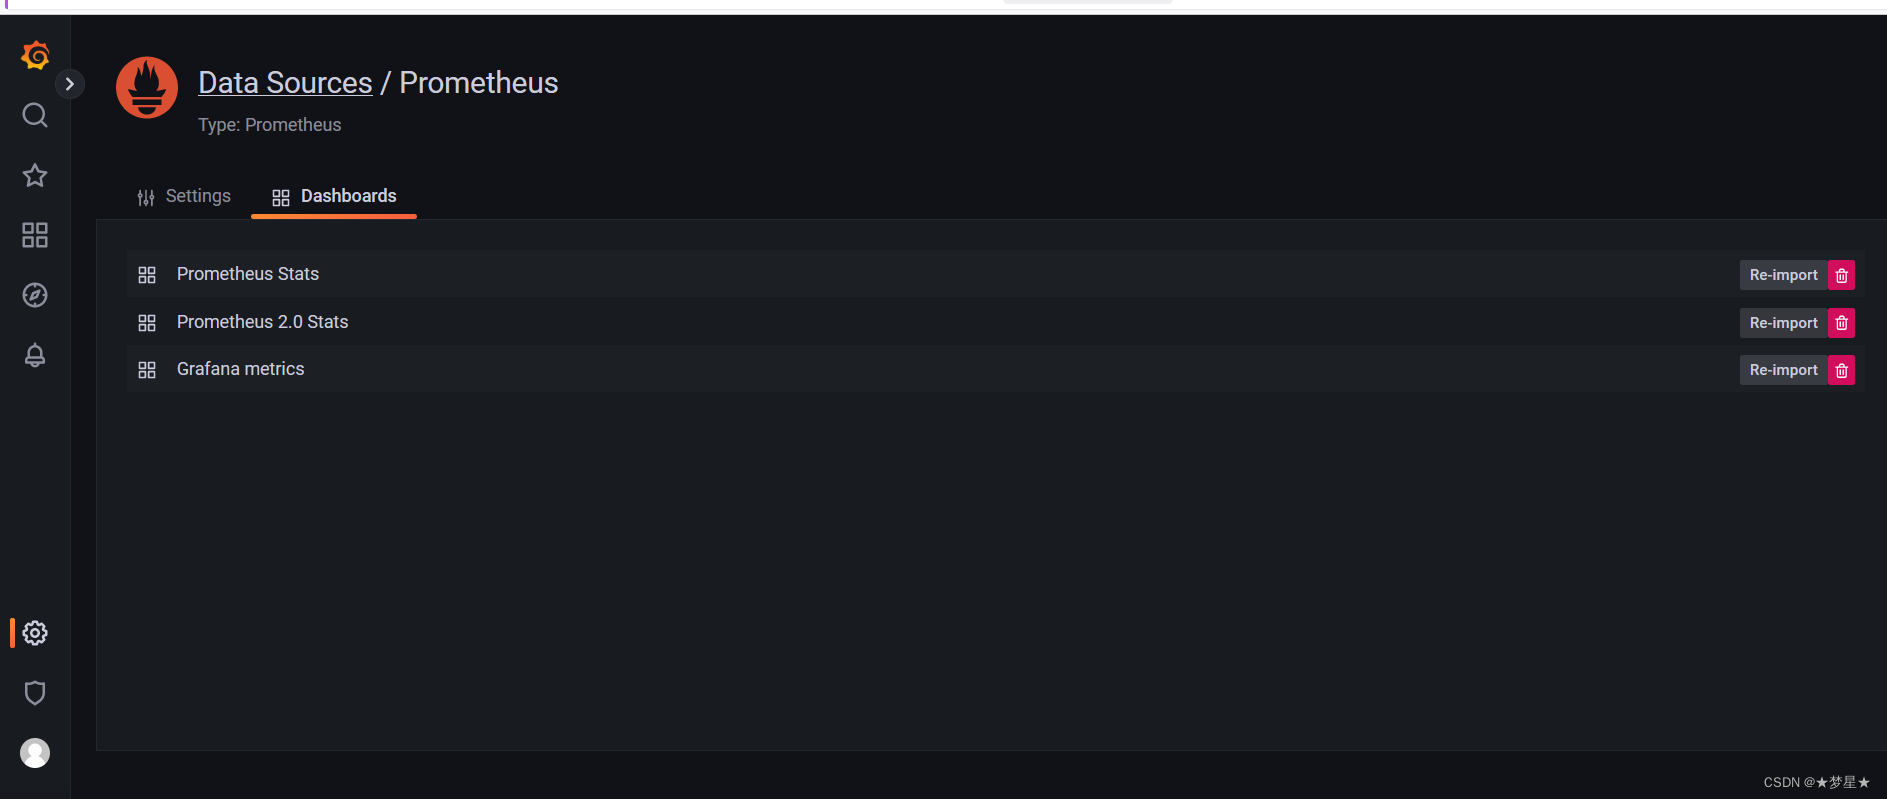
查看监控


 9765
9765


 被折叠的 条评论
为什么被折叠?
被折叠的 条评论
为什么被折叠?
 到【灌水乐园】发言


