


 该文章介绍了如何在Vue.js应用中利用Echarts库实现图表的循环播放。首先从后台获取数据,然后动态绑定ID来创建多个Echarts实例。通过定义变量、定时器以及数据处理函数,实现了每两秒切换展示的图表。文章提供了两个示例,一个是单个图表展示两条数据的循环,另一个是同时展示多个图表(每个图表展示4个数据点)的循环效果。
1. 多个echarts进行循环播放
需求:一次展示两条,循环进行展示
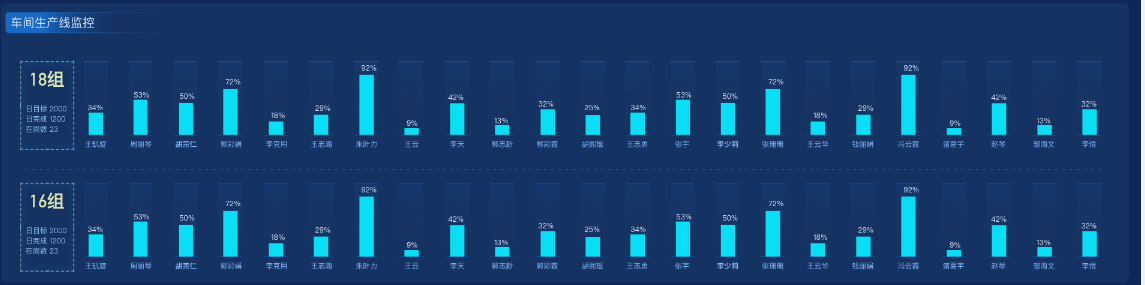
注意:要使用动态绑定id的方法去绑定echarts图表
1.1 获取到后台数据
1.2 定义变量(一个后台总的数据,一个页面需要展示的数据)通过循环或者数组的slice 方法获取总数据中的两条数据放到需要展示的数据数组中,本页面通过chang方法实现
1.3 定义定时器,每2s循环一次
1.4 通过循环展示数组的数组为echarts传递数据参数
<template>
  <div>
    <div class="list" v-for="(item, index) in list.listShow" :key="index">
      <div>{{ item.Name }}</div>
      <div :id="'main' + (index + 1)" style="height:300px;width:100%"></div>
    </div>
  </div>
</template>

<script setup>
import * as echarts from 'echarts';
import { onMounted, reactive, nextTick } from 'vue';
import { loop2 } from '@/api/loop'
const list = reactive({
  listTotal: [],  //获取到的后台数据
  listShow: [],   //页面需要展示的数据
  index: 0
})
onMounted(() => {
  listData()
})
// 获取后台数据
// 步骤一
const listData = () => {
  loop2().then(res => {
    list.listTotal = res.Data1
    showSing()

    //步骤四
    nextTick(() => {
      list.listShow.forEach((item, index) => {
        getEcharts(`main${index + 1}`, item.Group, item.Name)
      })
      setInterval(() => {
        list.listShow.forEach((item, index) => {
          getEcharts(`main${index + 1}`, item.Group,item.Name)
        })
      }, 2000)
    })
  })
}
// 循环展示数据  步骤二
const change = () => {
  list.listShow = list.listTotal.slice(list.index, list.index += 2)
  if (list.listShow.length < 2) {
    list.index = 2 - list.listShow.length
    list.listShow = list.listShow.concat(list.listTotal.splice(0, list.index))
  }
}
// 步骤三
const showSing = () => {
  change()
  setInterval(() => {
    change()
  }, 2000)
}

const getEcharts = (name, dataValue, nameOne) => {
  let yData = []
  let xData = []
  console.log(dataValue);
  dataValue.forEach((item, index) => {
    yData.push(item.Count)
    xData.push(item.Name)
  })
  var myChart = echarts.init(document.getElementById(name));
  myChart.setOption({
    title: {
      text: nameOne
    },
    tooltip: {},
    xAxis: {
      data: xData
    },
    yAxis: {},
    series: [
      {
        name: '销量',
        type: 'bar',
        data: yData
      }
    ]
  });
}
</script>

<style lang="scss" scoped>

</style>
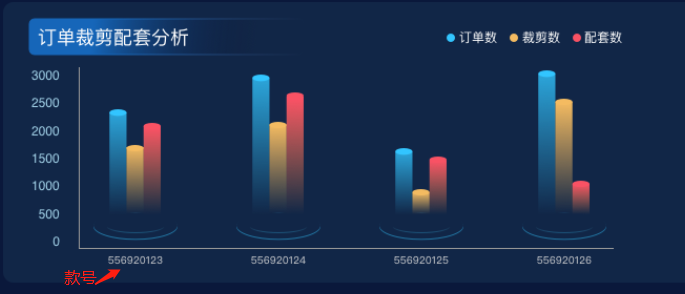
2. echars循环
需求:因为有多个款号,所以需要进行循环展示,每次展示4个
<template>
  <div>
    <div id="order" style="width:80%;height:300px"></div>
  </div>
</template>

<script setup>
import { onMounted } from 'vue';
import * as echarts from 'echarts';
onMounted(()=>{
  order()
})
const order=(ordeData)=>{
  let xData = ['556920123', '556920124', '556920125', '556920126', '556920127']
  let y1 = [220, 120, 240, 266, 211]
  let y2 = [130, 150, 220, 245, 311]
  let y3 = [100, 300, 600, 900, 455]
  let num=2  //一次展示几条
  // let xData = []
  // let y1 = []
  // let y2 = []
  // let y3 = []
  // ordeData.OrderRalateRow.forEach(item => {
  //   xData.push(item.StyleNo)
  //   y1.push(item.OrderNum)
  //   y2.push(item.CutNum)
  //   y3.push(item.RelateNum)
  // })
  let timeLineData = [];
  let optionArr = [];
  let myChart = echarts.init(document.getElementById('order'));
  /* 进行循环的代码功能 */
  let len = Math.ceil(xData.length / num);
  for (var i = 1; i <= len; i++) {
    timeLineData.push(i);
    let obj = {
      // title: {
      //   text: '设备第' + i + '页'
      // },
      series: [
        { data: y1.splice(0, num) }, // 系列一的数据
        { data: y2.splice(0, num) }, // 系列二的数据
        { data: y3.splice(0, num) }, // 系列二的数据
      ],
      xAxis: {
        type: "category",
        data: xData.splice(0, num)
      },
    };
    optionArr.push(obj)
  }
    /* 进行循环的代码功能 结束 */
  var option = {
    baseOption: {
      timeline: {
        autoPlay: true,
        // bottom: -23,
        controlStyle: {
          show: false
        },
        show: false,
        playInterval: 5000,
        data: timeLineData
      },
      // backgroundColor: '#00265f',
      tooltip: {
        trigger: 'axis',
        axisPointer: {
          type: 'shadow'
        }
      },
      legend: {
        data: ['订单数', '裁剪数', '配套数'],
        left: 'right',
        icon: ' circular',
        align: 'left',
        top: '2%',
        textStyle: {
          color: "#fff"
        },
        itemWidth: 8,
        itemHeight: 8,
        // itemGap: 35
      },
      grid: {
        left: '3%',
        right: '4%',
        bottom: '3%',
        top: '15%',
        containLabel: true
      },
      xAxis: [{
        type: 'category',
        data: xData,
        axisLine: {
          show: true,
          lineStyle: {
            color: "#00c7ff",
            width: 1,
            type: "solid"
          }
        },
        axisTick: {
          show: true,
        },
        axisLabel: {
          show: true,
          textStyle: {
            color: "#00c7ff",
          }
        },
      }],
      yAxis: [{
        type: 'value',
        // name:'万m³',
        // axisLabel: {
        //     formatter: '{value} m³'
        // },
        axisTick: {
          show: false,
        },
        axisLine: {
          show: true,
          lineStyle: {
            color: "#00c7ff",
            width: 1,
            type: "solid"
          },
        },
        splitLine: {
          show: false
        }
      }],
      series: [
        {
          name: '订单数',
          type: 'bar',
          data: y1,
          barWidth: 16, //柱子宽度
          barGap: '140%',
          label: {
            normal: {
              show: true,
              position: 'top',
              // "formatter": "{c}%"
              fontSize: 12,
              color: '#DADADA',
            },
          },
          itemStyle: {
            normal: {
              // color: new echarts.graphic.LinearGradient(0, 0, 0, 1, [{
              //   offset: 0,
              //   color: 'rgba(50,197,255,0.8)'
              // }, {
              //   offset: 1,
              //   color: 'rgba(50,197,255,0)'
              // }]),
              color: 'rgba(50,197,255,0.8)',
              opacity: 1,
              barBorderRadius: 12,
            }
          }
        },
        {
          name: '裁剪数',
          type: 'bar',
          data: y2,
          barWidth: 16,
          barGap: '140%',
          // barGap: 1,
          label: {
            normal: {
              show: true,
              position: 'top',
              // "formatter": "{c}%"
              fontSize: 12,
              color: '#DADADA',
            },
          },
          itemStyle: {
            normal: {
              // color: new echarts.graphic.LinearGradient(0, 0, 0, 1, [{
              //   offset: 0,
              //   color: '#F4BB61'
              // }, {
              //   offset: 1,
              //   color: 'rgba(244,187,97,0)'
              // }]),
              color: '#F4BB61',
              opacity: 1,
              barBorderRadius: 12,
            }
          }
        },
        {
          name: '配套数',
          type: 'bar',
          data: y3,
          barWidth: 16,
          barGap: '140%',
          // barGap: 1,
          label: {
            normal: {
              show: true,
              position: 'top',
              // "formatter": "{c}%"
              fontSize: 12,
              color: '#DADADA',
            },
          },
          itemStyle: {
            normal: {
              // color: new echarts.graphic.LinearGradient(0, 0, 0, 1, [{
              //   offset: 0,
              //   color: '#FE5166'
              // }, {
              //   offset: 1,
              //   color: 'rgba(252,146,73,0)'
              // }]),
              color: '#FE5166',
              opacity: 1,
              barBorderRadius: 12,
            }
          }
        }]
    },
    options: optionArr,
  }
  myChart.setOption(option);
}
</script>

<style lang="scss" scoped>

</style>


 317
317


 被折叠的 条评论
为什么被折叠?
被折叠的 条评论
为什么被折叠?
 到【灌水乐园】发言


