


一、nmon和nmon_analyser资源下载
(1)《nmon官网下载地址链接》
(2)百度云盘链接
链接:https://pan.baidu.com/s/1EExs_ENQB7k8H9c3XfG5lA
提取码:8t5n
二、解压nmon
大家可以选择自己相应版本的nmon,我这边用的是nmon_power_64le_centos7。
root@czg2 pkg]# tar -xvf nmon16m_helpsystems\ \(1\).tar.gz
nmon_power_64_centos6
nmon_power_64_centos7
nmon_power_64_linux
nmon_power_64_rhel6
nmon_power_64_rhel7
nmon_power_64_sles11
nmon_power_64le_centos7
nmon_power_64le_centos8
nmon_power_64le_linux
nmon_power_64le_rhel7
nmon_power_64le_rhel7_gpu
nmon_power_64le_rhel8
nmon_power_64le_sles12
nmon_power_64le_ubuntu14
nmon_power_64le_ubuntu16
nmon_power_64le_ubuntu18
nmon_x86_64_centos5
nmon_x86_64_centos6
nmon_x86_64_centos7
nmon_x86_64_centos8
nmon_x86_64_debian08
nmon_x86_64_debian09
nmon_x86_64_debian10
nmon_x86_64_mint18
nmon_x86_64_mint19
nmon_x86_64_oel5
nmon_x86_64_oel6
nmon_x86_64_oel7
nmon_x86_64_oel8
nmon_x86_64_opensuse10
nmon_x86_64_opensuse11
nmon_x86_64_opensuse12
nmon_x86_64_opensuse15
nmon_x86_64_rhel5
nmon_x86_64_rhel6
nmon_x86_64_rhel7
nmon_x86_64_rhel8
nmon_x86_64_sles10
nmon_x86_64_sles11
nmon_x86_64_sles12
nmon_x86_64_sles15
nmon_x86_64_ubuntu14
nmon_x86_64_ubuntu16
nmon_x86_64_ubuntu18
nmon_x86_64_ubuntu19
三、nmon帮助
[root@czg2 nmon]# ./nmon_x86_64_centos7 -h
Hint for nmon_x86_64_centos7 version 16m
        Full Help Info : nmon_x86_64_centos7 -h

        On-screen Stats: nmon_x86_64_centos7
        Data Collection: nmon_x86_64_centos7 -f [-s <seconds>] [-c <count>] [-t|-T]
        Capacity Plan  : nmon_x86_64_centos7 -x
Interactive-Mode:
        Read the Welcome screen & at any time type: "h" for more help
        Type "q" to exit nmon

For Data-Collect-Mode
        -f            Must be the first option on the line (switches off interactive mode)
                      Saves data to a CSV Spreadsheet format .nmon file in then local directory
                      Note: -f sets a defaults -s300 -c288    which you can then modify
        Further Data Collection Options:
        -s <seconds>  time between data snapshots
        -c <count>    of snapshots before exiting
        -t            Includes Top Processes stats (-T also collects command arguments)
        -x            Capacity Planning=15 min snapshots for 1 day. (nmon -ft -s 900 -c 96)
---- End of Hints
---- Full Help Information for nmon 16m

For Interactive and Data Collection Mode:
        User Defined Disk Groups (DG) - This works in both modes
        It is a work around Linux issues, where disks & partitions are mixed up in /proc files
        & drive driver developers use bizarre device names, making it trick to separate them.
        -g <filename> Use this file to define the groups
                      - On each line: group-name <disks-list>   (space separated list)
                      - Example line: database sdb sdc sdd sde
                      - Up to 64 disk groups, 512 disks per line
                      - Disks names can appear more than one group
        -g auto       - Will generate a file called "auto" with just disks from "lsblk|grep disk" output
         For Interactive use define the groups then type: g or G
         For Data Capture defining the groups switches on data collection

Data-Collect-Mode = spreadsheet format (i.e. comma separated values)
        Note: Use only one of f, F, R, x, X or z to switch on Data Collection mode
        Note: Make it the first argument then use other options to modify the defaults
        Note: Don't collect data that you don't want - it just makes the files too large
        Note: Too many snapshots = too much data and crashes Analyser and other tools
        Note: 500 to 800 snapshots make a good graph on a normal size screen
        Recommended normal minimal options: snapshots every 2 minutes all day:
                Simple capture:      nmon -f  -s 120 -c 720
                With Top Procs:      nmon -fT -s 120 -c 720
                Set the directory:   nmon -fT -s 120 -c 720 -m /home/nag/nmon
                Capture a busy hour: nmon -fT -s   5 -c 720 -m /home/nag/nmon

For Data-Collect-Mode Options
        -f            spreadsheet output format [note: default -s300 -c288]
                         output file is <hostname>_YYYYMMDD_HHMM.nmon
        -F <filename> same as -f but user supplied filename
                         Not recommended as the default file name is perfect
        The other options in alphabetical order:
        -a            Include Accelerator GPU stats
        -b            Online only: for black and white mode (switch off colour)
        -c <number>   The number of snapshots before nmon stops
        -d <disks>    To set the maximum number of disks [default 256]
                      Ignores disks if the systems has 100's of disk or the config is odd!
        -D            Use with -g to add the Disk Wait/Service Time & in-flight stats
        -f and -F     See above
        -g <filename> User Defined Disk Groups (see above) - Data Capture: Generates  BBBG & DG lines
        -g auto       See above but makes the file "auto" for you of just the disks like sda etc.
        -h            This help output
        -I <percent>  Set the ignore process & disks busy threshold (default 0.1%)
                      Don't save or show proc/disk using less than this percent
        -J            Switch-off Journel Filesystem stats collection (can causes issues with automound NFS)
        -l <dpl>      Disks per line in data capture to avoid spreadsheet width issues. Default 150. EMC=64.
        -m <directory> nmon changes to this directory before saving to file
                      Useful when starting nmon via cron
        -M              Adds MHz stats for each CPU thread. Some POWER8 model CPU cores can be different frequencies
        -N            Include NFS Network File System for V2, V3 and V4
        -p            nmon outputs the PID when it starts. Useful in scripts to capture the PID for a later safe stop.
        -r <runname>  Use in a benchmark to record the run details for later analysis [default hostname]
        -R              Old rrdtool format used by some - may be removed in the future. If you use this email Nigel
        -s <seconds>  Time between snap shots - with "-c count" decides duration of the data capture
        -t            Include Top Processes in the output
        -T            As -t plus it saves command line arguments in UARG section
        -U            Include the Linux 10 CPU utilisation stats (CPUUTIL lines in the file)
        -V            Print nmon version & exit immediately

        To manually load nmon files into a spreadsheet:
                sort -A *nmon >stats.csv
                Transfer the stats.csv file to your PC
                Start spreadsheet & then Open with type=comma-separated-value ASCII file
                This puts every datum in a different cell
                Now select the data of one type (same 1st column) and graph it
                The nmon Analyser & other tools do not need the file sorted.

Capacity Planning mode - use cron to run each day
        -x            Sensible spreadsheet output for one day
                      Every 15 mins for 1 day ( i.e. -ft -s 900 -c 96)
        -X            Sensible spreadsheet output for busy hour
                      Every 30 secs for 1 hour ( i.e. -ft -s 30 -c 120)
        -z            Like -x but the output saved in /var/perf/tmp assuming root user

Interactive Mode Keys in Alphabetical Order
    Start nmon then type the letters below to switch on & off particular stats
    The stats are always in the same order on-screen
    To see more stats: make the font smaller or use two windows

        Key --- Toggles on off to control what is displayed ---
        b   = Black and white mode (or use -b command line option)
        c   = CPU Utilisation stats with bar graphs (CPU core threads)
        C   = CPU Utilisation as above but concise wide view (up to 192 CPUs)
        d   = Disk I/O Busy% & Graphs of Read and Write KB/s
        D   = Disk I/O Numbers including Transfers, Average Block Size & Peaks (type: 0 to reset)
        g   = User Defined Disk Groups            (assumes -g <file> when starting nmon)
        G   = Change Disk stats (d) to just disks (assumes -g auto   when starting nmon)
        h   = This help information
        j   = File Systems including Journal File Systems
        J   =  Reduces "j" output by removing unreal File Systems
        k   = Kernel stats Run Queue, context-switch, fork, Load Average & Uptime
        l   = Long term Total CPU (over 75 snapshots) via bar graphs
        L   = Large and =Huge memory page stats
        m   = Memory & Swap stats
        M   = MHz for machines with variable frequency 1st=Threads 2nd=Cores 3=Graphs
        n   = Network stats & errors (if no errors it disappears)
        N   = NFS - Network File System
              1st NFS V2 & V3, 2nd=NFS4-Client & 3rd=NFS4-Server
        o   = Disk I/O Map (one character per disk pixels showing how busy it is)
              Particularly good if you have 100's of disks
        q   = Quit
        r   = Resources: Machine type, name, cache details & OS version & Distro + LPAR
        t   = Top Processes: select the data & order 1=Basic, 3=Perf 4=Size 5=I/O=root only
        u   = Top Process with command line details
        U   = CPU utilisation stats - all 10 Linux stats:
              user, user_nice, system, idle, iowait, irq, softirq, steal, guest, guest_nice
        v   = Experimental Verbose mode - tries to make recommendations
        V   = Virtual Memory stats

        Key --- Other Interactive Controls ---
        +   = Double the screen refresh time
        -   = Halves the screen refresh time
        0   = Reset peak counts to zero (peak highlight with ">")
        1   = Top Processes mode 1 Nice, Priority, Status
        3   = Top Processes mode 3 CPU, Memory, Faults
        4   = Top Processes mode 4 as 3 but order by memory
        5   = Top Processes mode 5 as 3 but order by I/O (if root user)
        6   = Highlights 60% row on Long Term CPU view
        7   = Highlights 70% row on Long Term CPU view
        8   = Highlights 80% row on Long Term CPU view
        9   = Highlights 90% row on Long Term CPU view
        .   = Minimum mode i.e. only busy disks and processes shown
        space = Refresh screen now

Interactive Start-up Control
        If you find you always type the same toggles every time you start
        then place them in the NMON shell variable. For example:
         export NMON=cmdrtn

Other items for Interactive and Data Collection mode:
        a) To limit the processes nmon lists (online and to a file)
            either set NMONCMD0 to NMONCMD63 to the program names
            or use -C cmd:cmd:cmd etc. example: -C ksh:vi:syncd
Other items for Data Collection mode:
        b) To you want to stop nmon use: kill -USR2 <nmon-pid>
        c) Use -p and nmon outputs the background process pid
        d) If you want to pipe nmon output to other commands use a FIFO:
            mkfifo /tmp/mypipe
            nmon -F /tmp/mypipe &
            tail -f /tmp/mypipe
        e) If nmon fails please report it with:
           1) nmon version like: 16m
           2) the output of: cd /proc; cat cpuinfo meminfo partitions stat vmstat
           3) some clue of what you were doing
           4) I may ask you to run the debug version or collect data files
        f) If box & line characters are letters then check: terminal emulator & $TERM
        g) External Data Collectors - nmon will execute a command or script at each snapshot time
           They must output to a different file which is merge afterwards with the nmon output
           Set the following shell variables:
            NMON_START  = script to generate CVS Header test line explaining the columns
                 Generate: TabName,DataDescription,Column_name_and_units,Column_name_and_units ...
            NMON_SNAP   = script for each snapshots data, the parameter is the T0000 snapshot number
                 Generate: TabName,T00NN,Data,Data,Data ...
            NMON_END    = script to clean up or finalise the data
            NMON_ONE_IN = call NMON_START less often (if it is heavy in CPU terms)
            Once capture done: cat nmon-file data-file >merged-file ; ready for Analyser or other tools
            The nmon Analyser will automatically do its best to graph the data on a new Tab sheet

        Developer: Nigel Griffiths      See http://nmon.sourceforge.net
        Feedback welcome - On the current release only
        No warranty given or implied. (C) Copyright 2009 Nigel Griffiths GPLv3
[root@czg2 nmon]# ./nmon_x86_64_centos7
nmon─16m─────────────────────Hostname=czg2─────────Refresh= 2secs ───11:14.07──────────────────────────────────────────────────────────────────────────────┐
│ │
│ ------------------------------ │
│ _ __ _ __ ___ ___ _ __ For help type H or ... │
│ | '_ \| '_ ` _ \ / _ \| '_ \ nmon -? - hint │
│ | | | | | | | | | (_) | | | | nmon -h - full details │
│ |_| |_|_| |_| |_|\___/|_| |_| │
│ To stop nmon type q to Quit │
│ ------------------------------ │
│ │
│ CentOS Linux release 7.9.2009 (Core) VERSION="7 (Core)" │
│ Vendor=GenuineIntel Model=Intel(R) Core(TM) i5-1035G1 CPU @ 1.00GHz │
│ MHz=1190.387 bogomips=2380.77 lscpu:CPU=2 Little Endian │
│ ProcessorChips=1 PhysicalCores=2 Sockets=0 Cores=2 Thrds=1 │
│ VirtualCPUs =2 MHz=0 max=0 min=0 │
│ │
│ Use these keys to toggle statistics on/off: │
│ c = CPU l = CPU Long-term - = Faster screen updates │
│ C = " WideView U = Utilisation + = Slower screen updates │
│ m = Memory V = Virtual memory j = File Systems │
│ d = Disks n = Network . = only busy disks/procs │
│ r = Resource N = NFS h = more options │
│ k = Kernel t = Top-processes q = Quit │
│───────────────────────────────────────────────────────────────────────────────────────────────────────────────────────────────────────────────────────────│
│ │
└───────────────────────────────────────────────────────────────────────────────────────────────────────────────────────────────────────────────────────────┘四、监控项
1、磁盘
1.1、命令d
(1)样例

(2)指标解释
指标名 | 解释 |
DiskName | 磁盘的名字。 |
Busy | 磁盘平均负载百分比。 |
Read | 每秒读取的数据量。 |
Write | 每秒写入的数据量。 |
2、进程
1.1、命令t加4(按照内存排序)
(1)样例
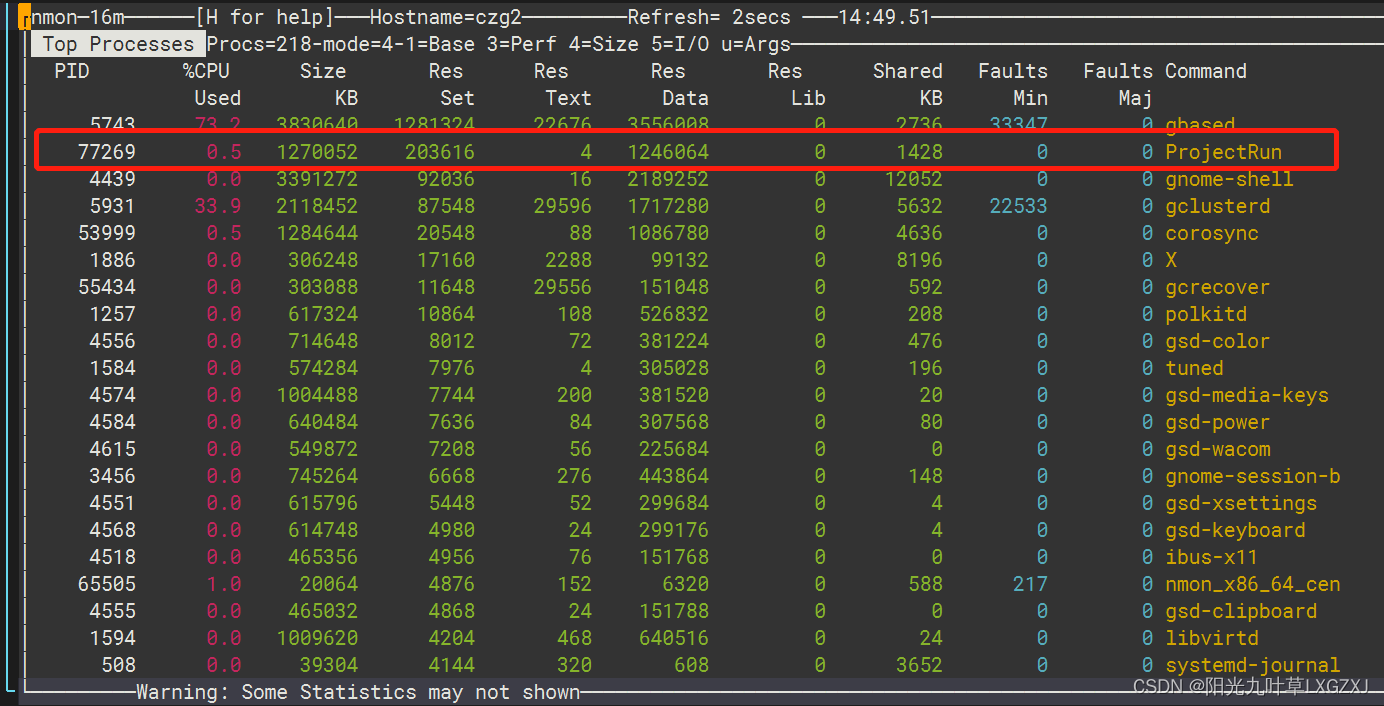
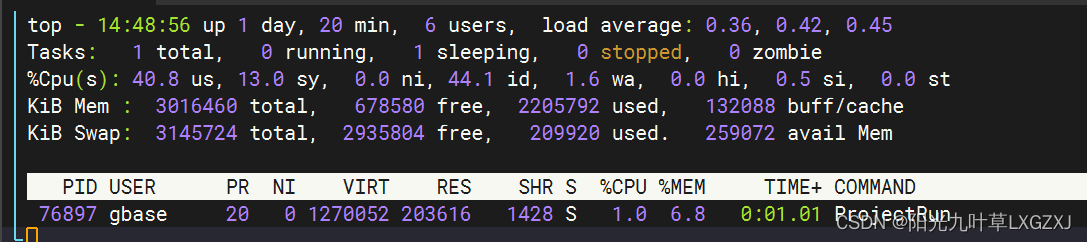
对比top
(2)指标解释
指标名 | 解释 |
PID | 进程号。 |
%CPU Used | 进程使用的CPU百分比。 |
Size KB | 进程申请的总内存大小。 |
Res Set | 进程实际占用的总内存大小。 |
Command | 进程名 |
其他几个指标不太理解,后续了解了,再补充上去。
3、CPU
1.1、命令c
(1)样例
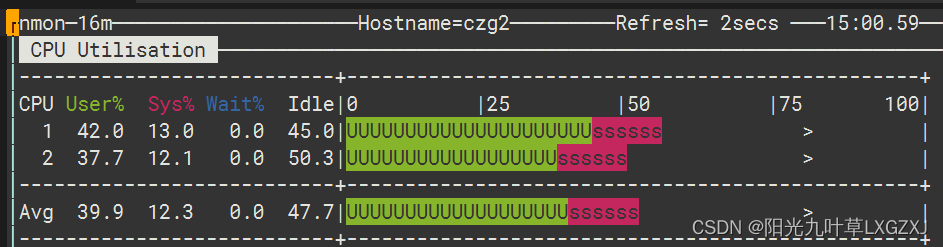
(2)指标解释
指标名 | 解释 |
CPU | CPU的编号。 |
User% | 用户使用CPU的百分比。 |
Sys% | 系统使用CPU的百分比。 |
Wait% | CPU等待的百分比。 |
Idle | CPU空闲的百分比。 |
4、内存
1.1、命令m
(1)样例
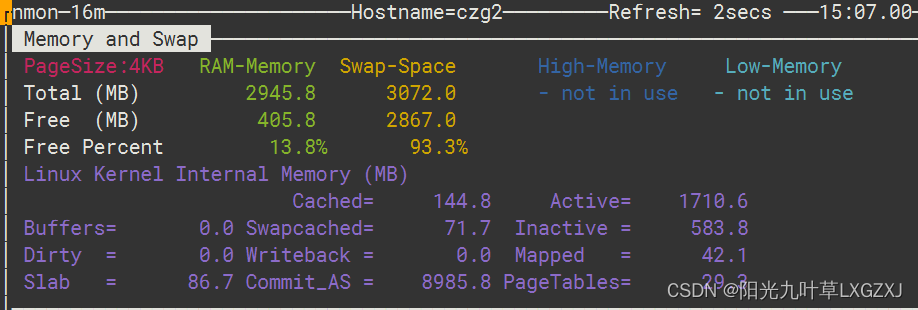
(2)指标解释
指标名 | 解释 |
RAM-Memory | 物理内存使用情况。 |
Swap-Space | 交换分区使用情况。 |
Total (MB) | 总的情况。 |
Free (MB) | 剩余的情况。 |
Free Percent | 剩余百分比情况。 |
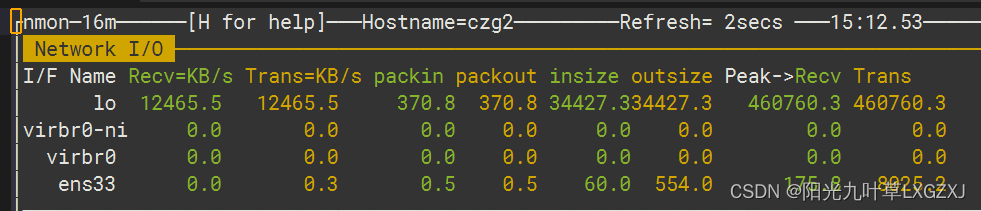
5、网络
1.1、命令m
(1)样例
(2)指标解释
指标名 | 解释 |
I/F Name | 网卡名字。 |
Recv=KB/s | 间隔时间内每秒接收数据的大小。 |
Trans=KB/s | 间隔时间内每秒发送数据的大小。 |
packin | 间隔时间内接收数据包的数量。 |
packout | 间隔时间内发送数据包的数量。 |
insize | 间隔时间内接收数据包的平均大小。 |
outsize | 间隔时间内发送数据包的平均大小。 |
Peak->Recv | 每秒接收数据的峰值大小。 |
Trans | 每秒发送数据的峰值大小。 |
五、参数表
参数名 | 说明 |
-f | 必须是第一个参数(关闭交互模式),将数据保存到本地目录中的 CSV 电子表格格式 .nmon 文件中 注意:-f 设置默认值 -s300 -c288 |
-s | <单位:秒> 两个快照数据之间的时间间隔。 |
-c | <单位:个> 生成多少个快照后退出程序。 |
-t | 包括TOP进程统计信息(-T 还收集命令参数) |
-x | 容量规划 = 1 天 15 分钟快照。(nmon -ft -s 900 -c 96) |
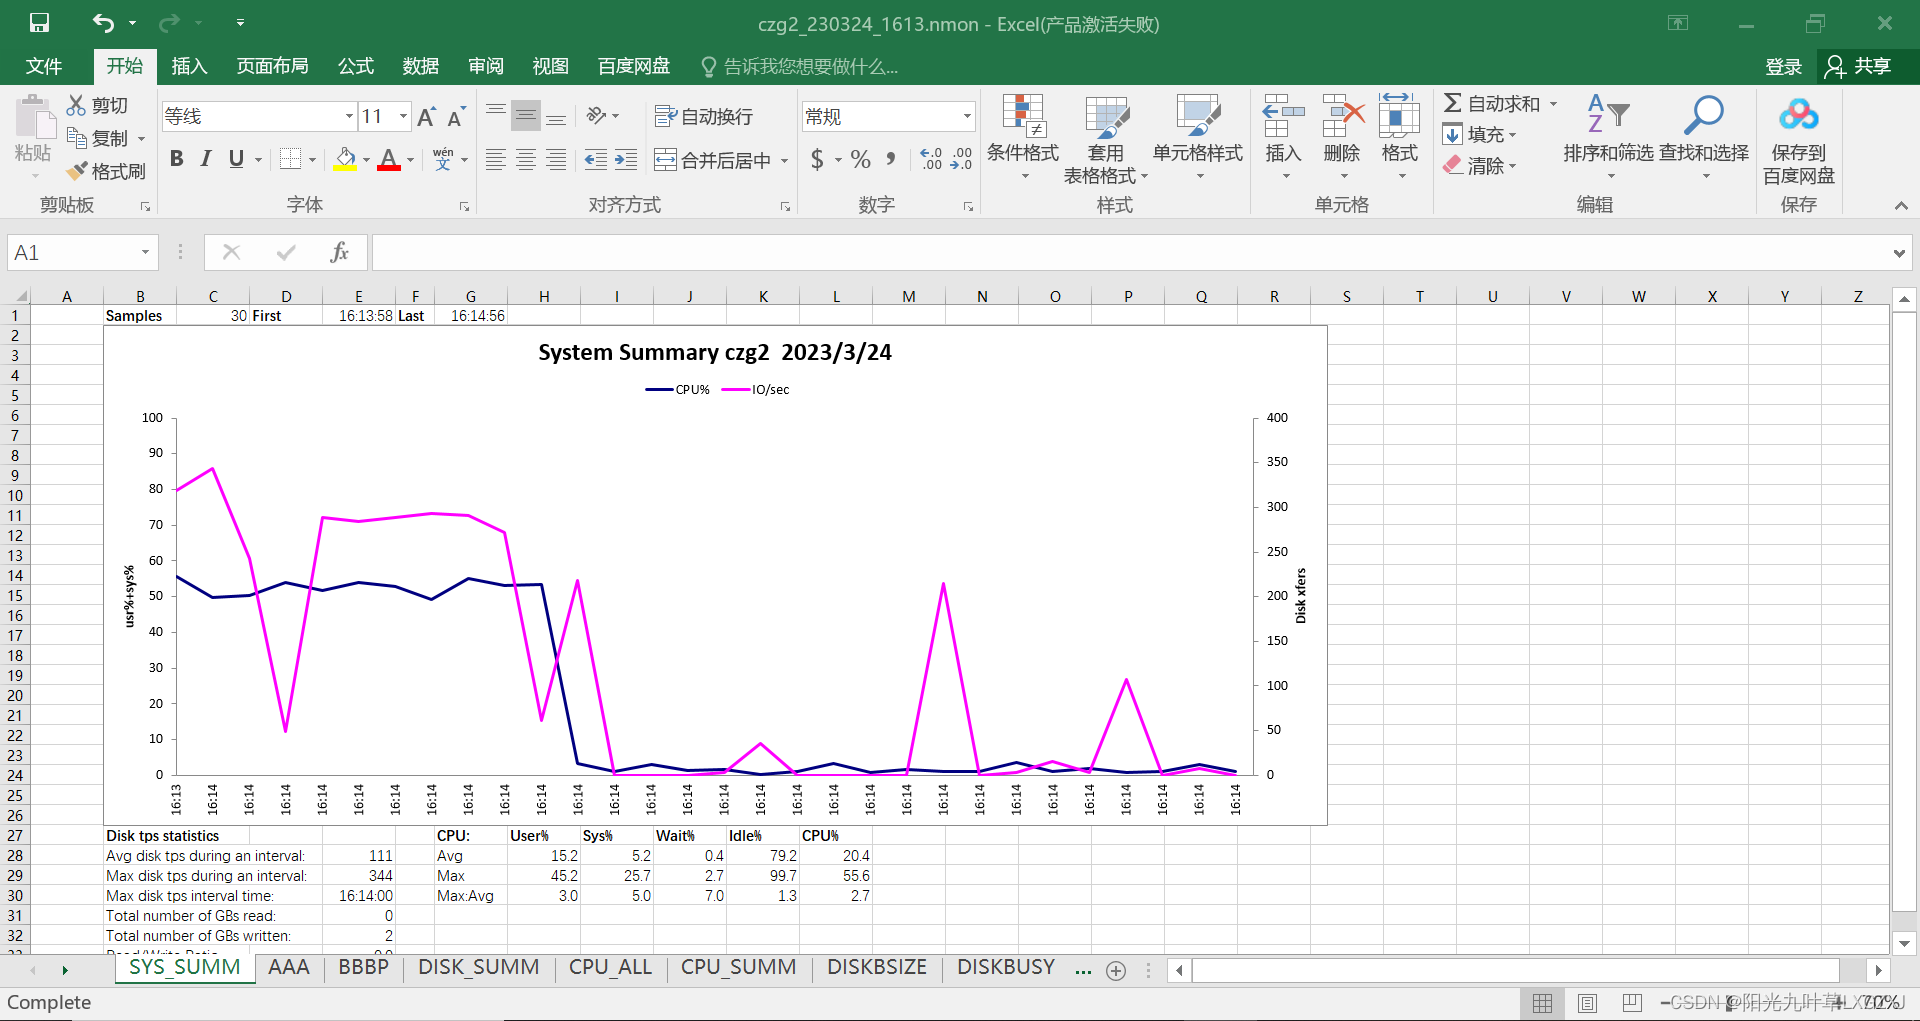
六、生成Excel性能分析图
1、执行nmon命令
[root@czg2 nmon]# ./nmon_x86_64_centos7 -ft -s 2 -c 30间隔两秒,一共生成30个快照。
2、查看文件
[root@czg2 nmon]# ll
总用量 468
-rw-r--r-- 1 root root  70779 3月  24 16:14 czg2_230324_1613.nmon
-rwxr----- 1 root root 404896 3月  24 10:00 nmon_x86_64_centos7
3、分析文件
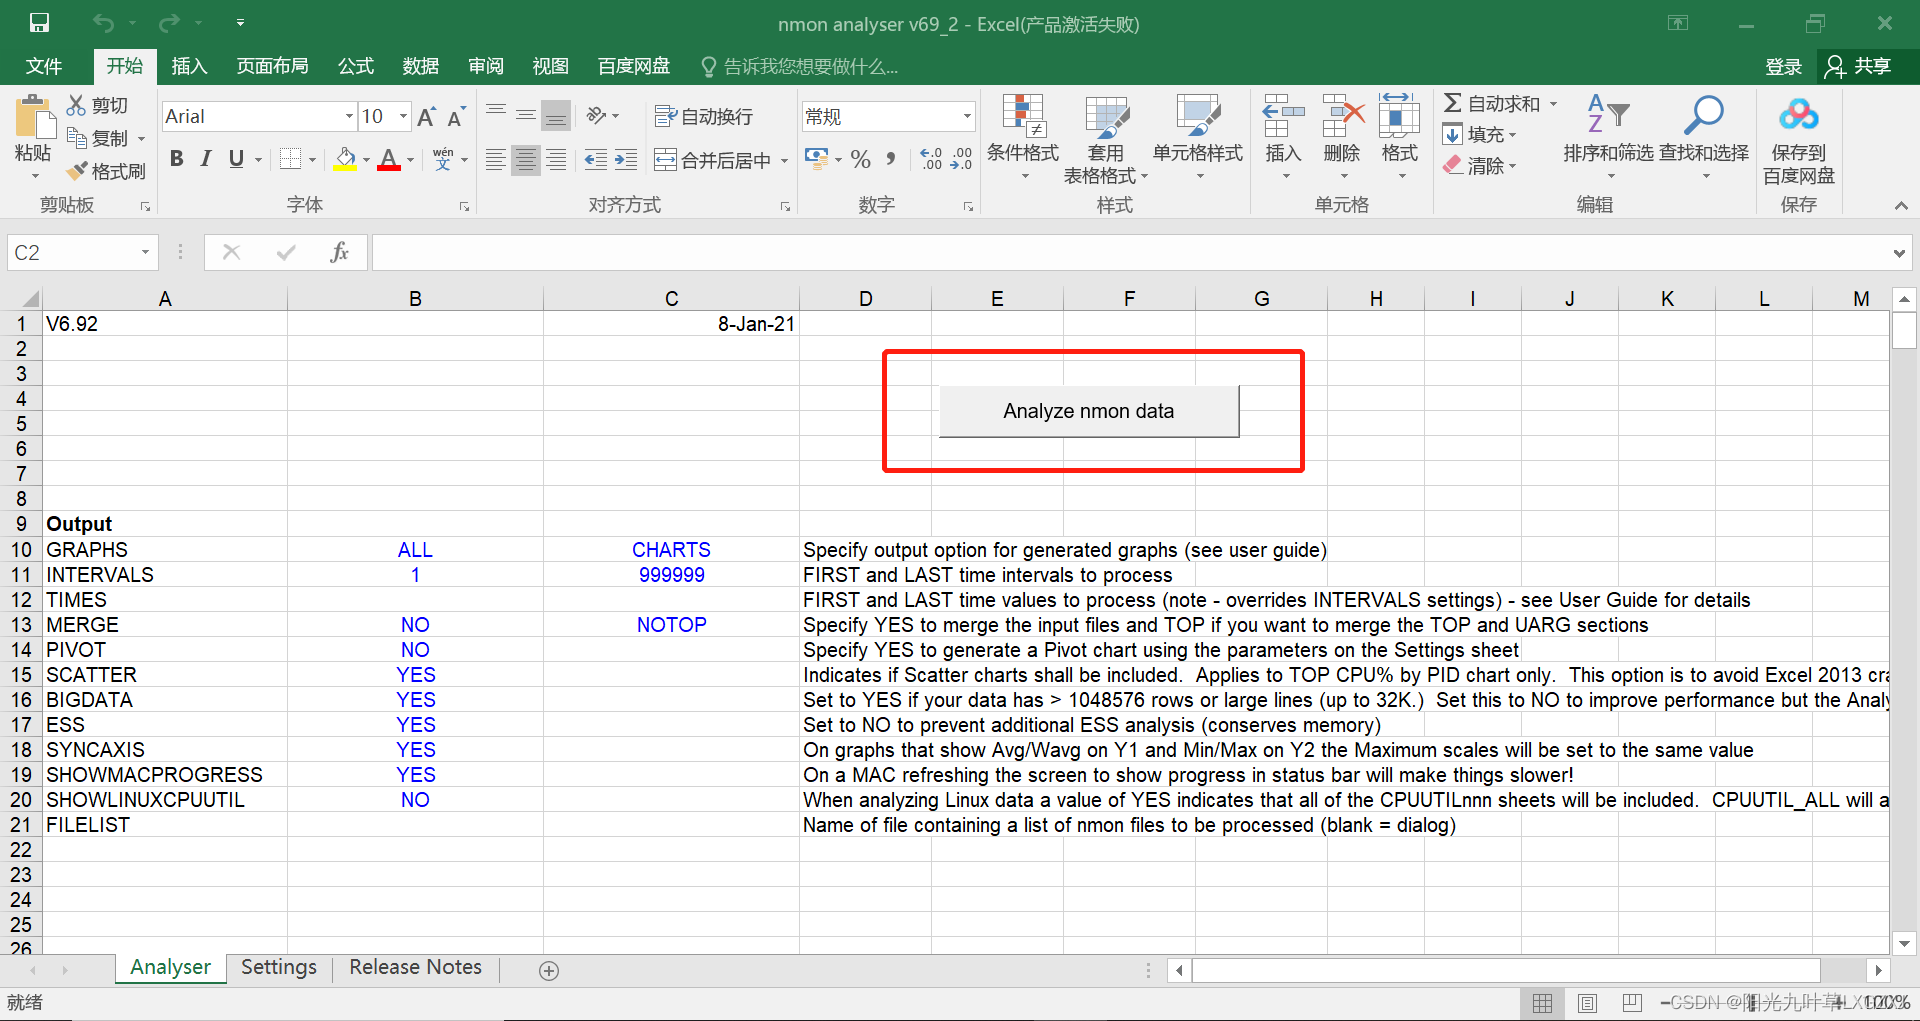
打开nmon analyser v69_2,点击红色按钮,选择czg2_230324_1613.nmon文件,可能会出现宏加载失败,选择左上角的文件,里面有一个启用宏就可以正常打开了。


 327
327


 被折叠的 条评论
为什么被折叠?
被折叠的 条评论
为什么被折叠?
 到【灌水乐园】发言


