


这里为了化繁为简只展示了三个页面,当然可以加一些首页、团队之类的页面。也可以用css,html进行装饰美化。
推荐:
moban.com 包含一些css的版本可以自己选择,不免费
iconfont.cn 包含一些图标,免费的
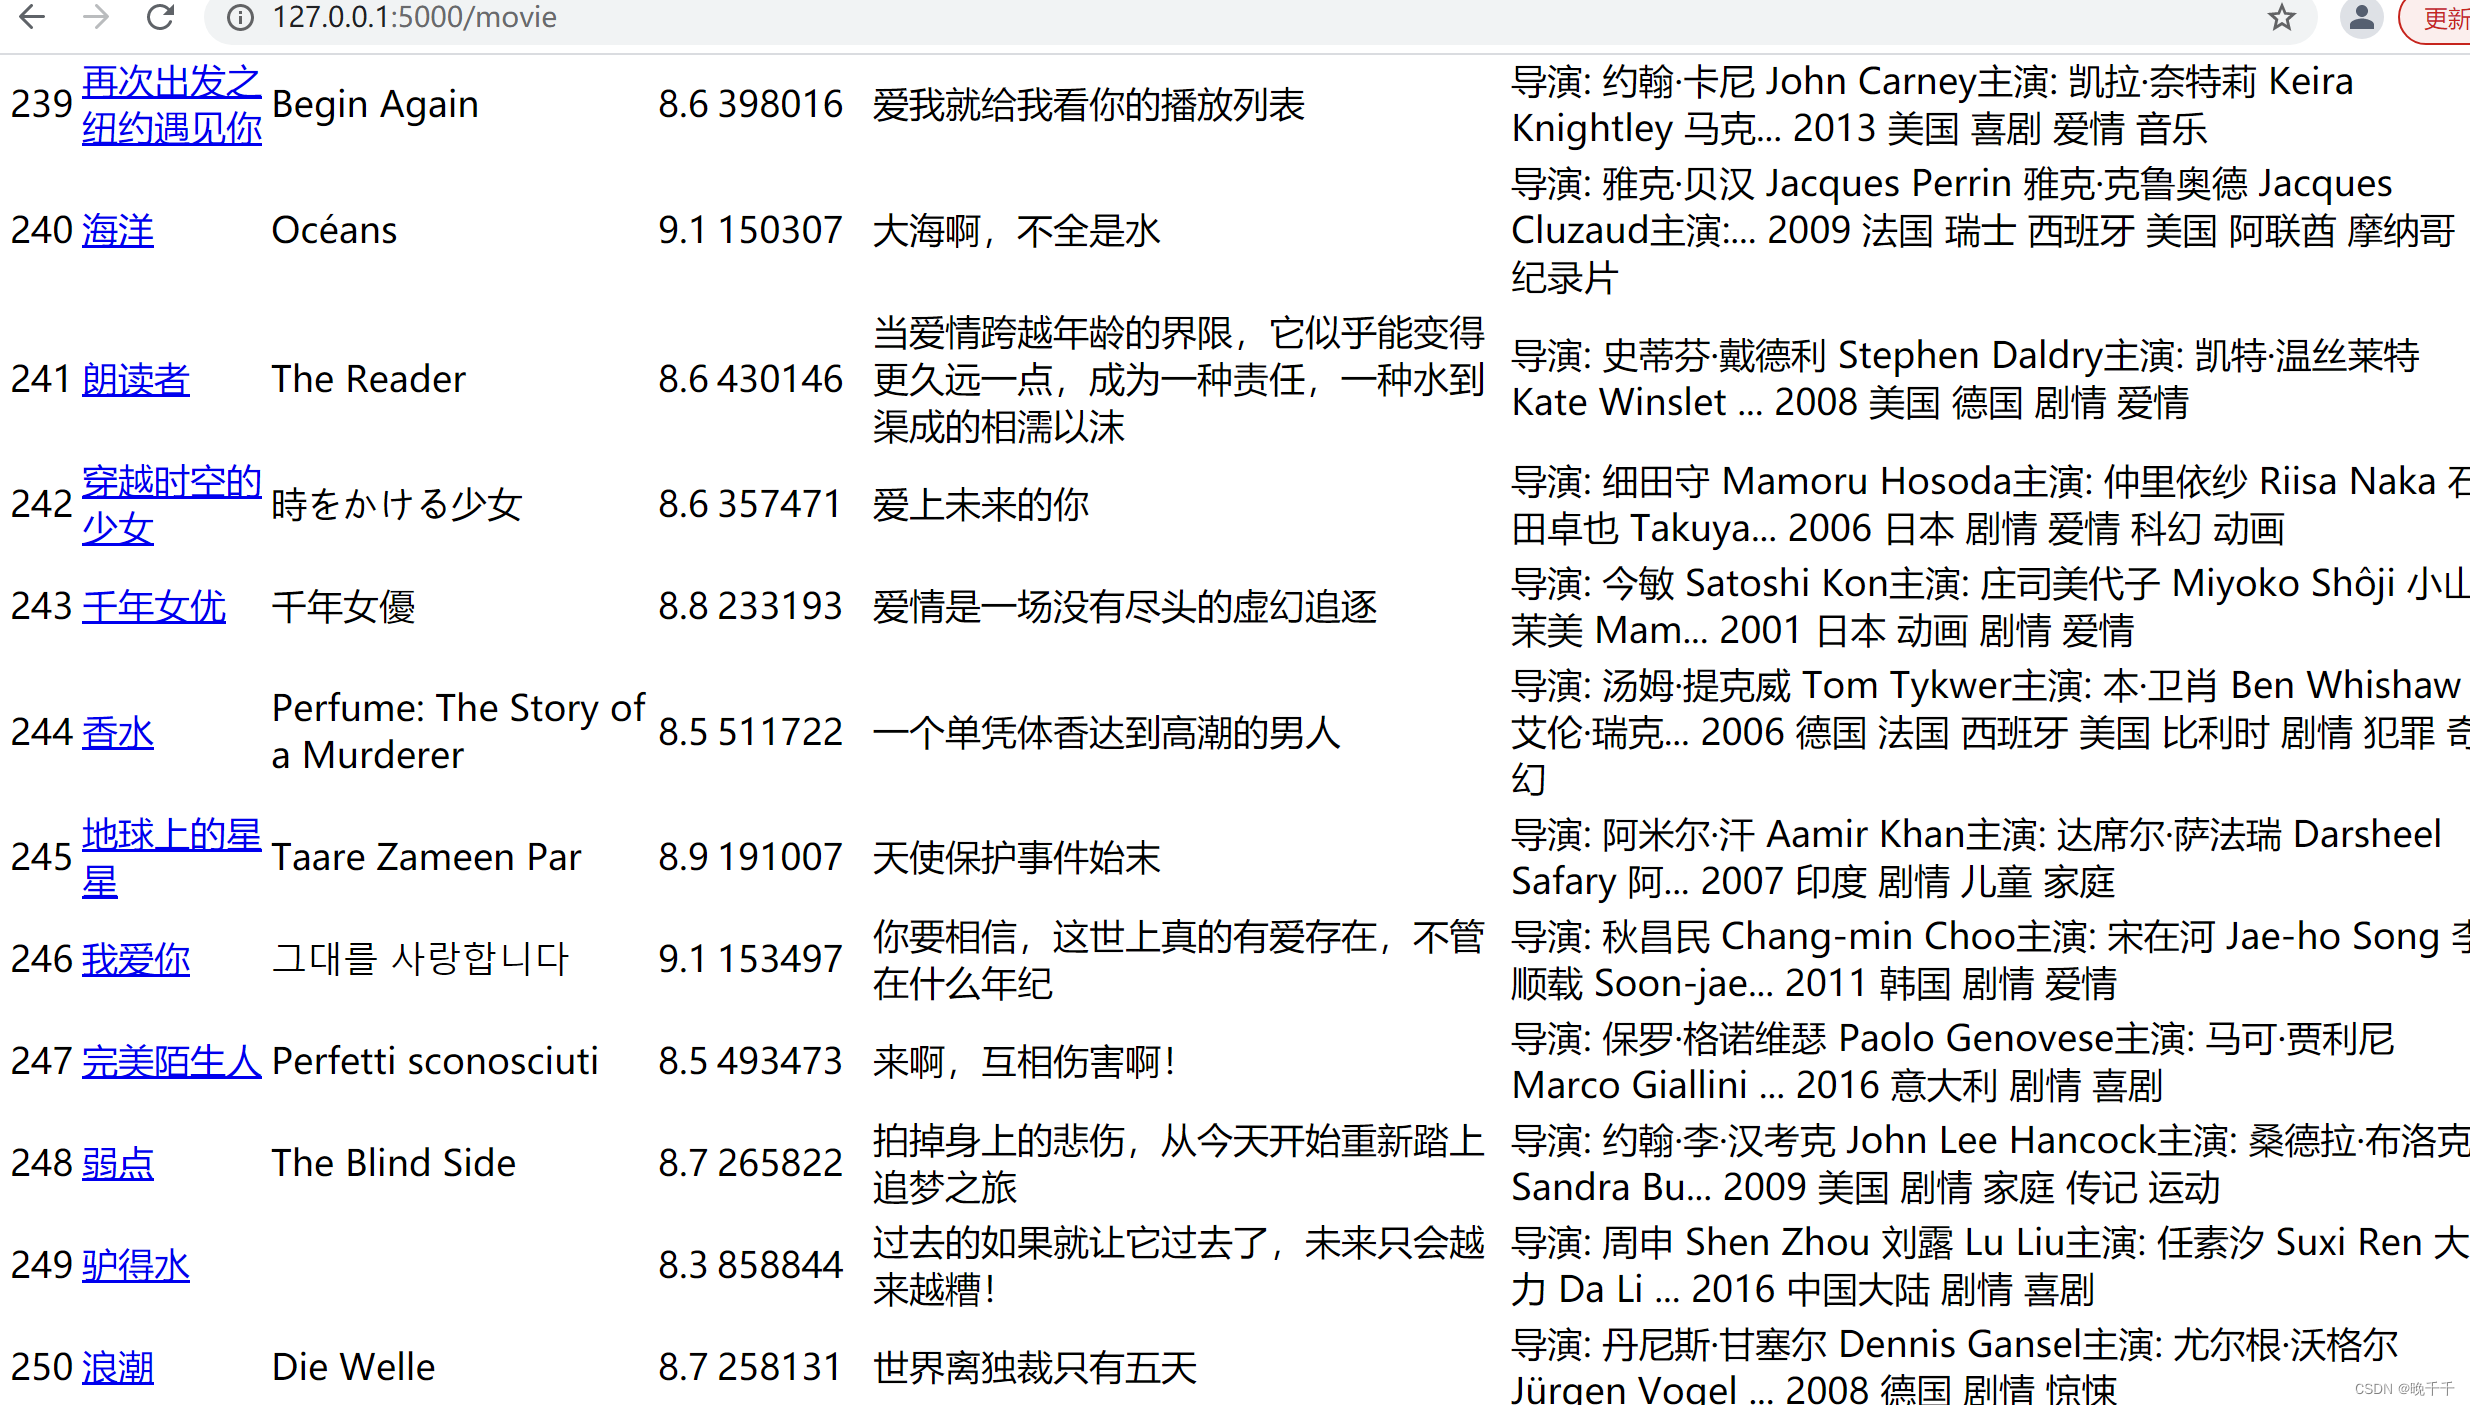
一、Flask框架展示页面
- 创建flask项目,将写好的movie.db导入
- 在templates创建movie.html页面,编写此页面以及app.py。
app.py代码
from flask import Flask,render_template
import sqlite3
app = Flask(__name__)

@app.route('/movie')
def movie():
    datalist = []
    con = sqlite3.connect("movie.db")
    cur = con.cursor()
    sql = "select * from movie250"
    data = cur.execute(sql)
    #在游标和链接关闭之前保存数据,否则数据丢失
    for items in data:
        datalist.append(items)
    cur.close()
    con.close()
    return render_template("movie.html",datalist = datalist)

if __name__ == '__main__':
    app.run()
movie.html页面如下
<!DOCTYPE html>
<html lang="en">
<head>
    <meta charset="UTF-8">
    <title>movie</title>
</head>
<body>
    <table class="table table-striped" style="font-size: large" >
        <tr>
            <td>排名</td>
            <td>中文名</td>
            <td>英文名</td>
            <td>评分</td>
            <td>评价人数</td>
            <td>概况</td>
            <td>其他信息</td>
        </tr>
        {% for movie in datalist %}
        <tr>
            <td>{{ movie[0] }}</td>
            <td>
                <a href="{{ movie[1] }}">
                {{ movie[3] }}
                </a>
            </td>
            <td>{{ movie[4] }}</td>
            <td>{{ movie[5] }}</td>
            <td>{{ movie[6] }}</td>
            <td>{{ movie[7] }}</td>
            <td>{{ movie[8] }}</td>
        </tr>
        {% endfor %}
    </table>

</body>
</html>
最让人有成就感的画面来了
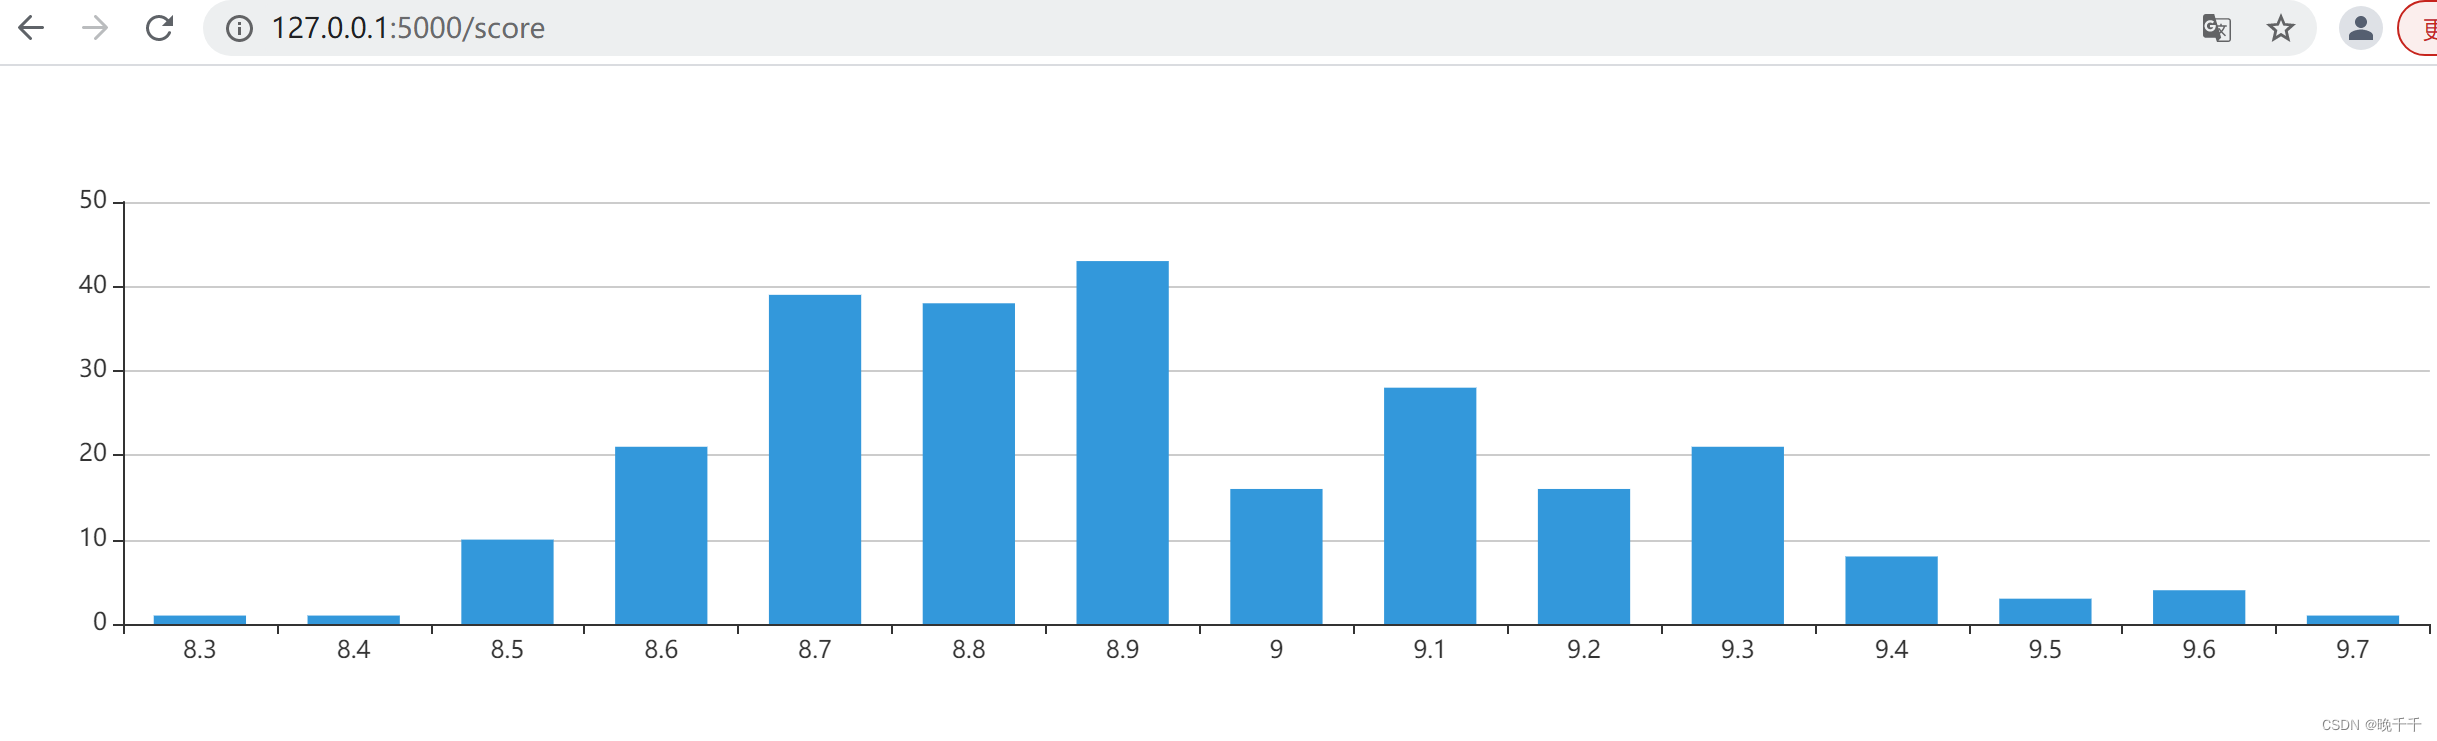
二、Echarts应用
将评分和评分人数以图表形式绘制
- 在static文件夹中引入Js文件 echarts.min.js
- 在templatest中创建score.html,编写Html以及app.py文件
score.html
<!DOCTYPE html>
<html lang="en">
<head>
    <meta charset="UTF-8">
    <title>评分表</title>
    <script src="static/js/echarts.min.js"></script>
</head>
<body>
    <!-- 为 ECharts 准备一个具备大小(宽高)的 DOM -->
    <div id="main" style="width: 100%;height:300px"></div>
    <script type="text/javascript">
        var dom = document.getElementById("main");
        var myChart = echarts.init(dom);
        var app = {};
        option = null;
        option = {

            color:['#3398DB'],
            tooltip: {
            trigger: 'axis',
            axisPointer: {
            type: 'shadow'}
        },
        grid: {
            left: '3%',
            right:'4%',
            bottom:'3%',
            containLabel:true
        },
        xAxis: {
            type: 'category',
            data: {{ score|tojson }}
            <!--['Mon', 'Tue', 'Wed', 'Thu', 'Fri', 'Sat', 'Sun','999']-->
        },
        yAxis: {
            type: 'value'
        },
        series: [{
            data: {{ num }},
                <!--[120, 20, 150, 80, 70, 110, 130,200],-->
            barWidth:'60%',
            type:'bar'
        }]
    };
    ;
    if (option && typeof option === "object") {
        myChart.setOption(option, true);
    }
    </script>

</body>
</html>
app.py中添加
@app.route('/score')
def score():
    score = []  # 评分
    num = []  # 每个评分所统计出的电影数量
    con = sqlite3.connect("movie.db")
    cur = con.cursor()
    sql = "select score,count(score) from movie250 group by score"
    data = cur.execute(sql)
    for item in data:
        score.append(str(item[0]))
        num.append(item[1])
    cur.close()
    con.close()
    return render_template("score.html", score=score, num=num)
结果如下:
三、WordClod应用
词云展示概括
- 首先要ps一张图,有轮廓,背景干净,导入static/img中
- 创建ciyun.py用来生成词云图片word.jpg(路径也在img中)
- 创建word.html用来展示图片和补充app.py
ciyun.py如下
#前三个要导包
import jieba        #分词
from matplotlib import pyplot as plt    #绘图,数据可视化
from wordcloud import WordCloud         #词云

from PIL import Image                   #图片处理
import numpy as np                      #矩阵运算
import sqlite3                          #数据库


#准备词云所需的文字(词)
con = sqlite3.connect('movie.db')
cur = con.cursor()
sql = 'select instroduction from movie250'
data = cur.execute(sql)
text = ""
for item in data:
    text =  text + item[0]
    #print(item[0])
#print(text)
cur.close()
con.close()

#分词
cut = jieba.cut(text)
string = ' '.join(cut)
print(len(string))


img = Image.open(r'.\static\img\tree.jpg')   #打开遮罩图片
img_array = np.array(img)   #将图片转换为数组
wc = WordCloud(
    background_color='white',
    mask=img_array,
    font_path="msyh.ttc"    #字体所在位置:C:\Windows\Fonts
)
wc.generate_from_text(string)


#绘制图片
fig = plt.figure(1)
plt.imshow(wc)
plt.axis('off')     #是否显示坐标轴

#plt.show()    #显示生成的词云图片

#输出词云图片到文件
plt.savefig(r'.\static\img\word.jpg',dpi=500)
可以看到static/img下有一个word.jpg
word.html
<!DOCTYPE html>
<html lang="en">
<head>
    <meta charset="UTF-8">
    <title>词云</title>
</head>
<body>
    <img src="static/img/word.jpg" class="img-fluid" alt="" width="700px" height="500px"/>
</body>
</html>
app.py中添加
@app.route('/word')
def word():
    return render_template("word.html")
展示吧!


 被折叠的 条评论
为什么被折叠?
被折叠的 条评论
为什么被折叠?
 到【灌水乐园】发言


