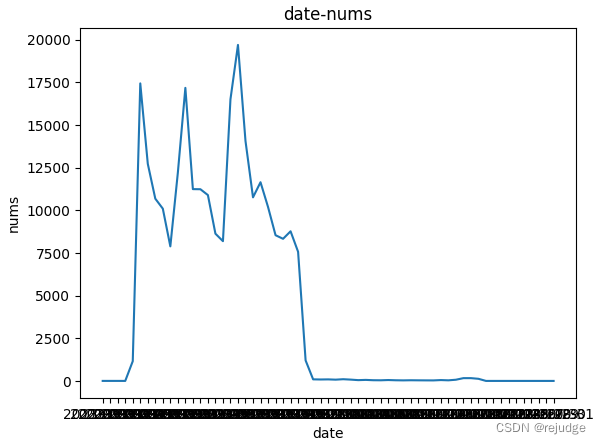
import matplotlib.pyplot as plt
date =['2023-09-01','2023-09-02','2023-09-03','2023-09-04','2023-09-05','2023-09-06','2023-09-07','2023-09-08','2023-09-09','2023-09-10','2023-09-11','2023-09-12','2023-09-13','2023-09-14','2023-09-15','2023-09-16','2023-09-17','2023-09-18','2023-09-19','2023-09-20','2023-09-21','2023-09-22','2023-09-23','2023-09-24','2023-09-25','2023-09-26','2023-09-27','2023-09-28','2023-09-29','2023-09-30','2023-10-01','2023-10-02','2023-10-03','2023-10-04','2023-10-05','2023-10-06','2023-10-07','2023-10-08','2023-10-09','2023-10-10','2023-10-11','2023-10-12','2023-10-13','2023-10-14','2023-10-15','2023-10-16','2023-10-17','2023-10-18','2023-10-19','2023-10-20','2023-10-21','2023-10-22','2023-10-23','2023-10-24','2023-10-25','2023-10-26','2023-10-27','2023-10-28','2023-10-29','2023-10-30','2023-10-31']
nums =[1,1,1,0,1156,17435,12722,10679,10094,7885,12203,17173,11239,11233,10890,8628,8189,16502,19689,14063,10757,11643,10193,8538,8328,8768,7567,1201,92,84,90,74,100,77,46,60,41,37,52,38,32,39,35,32,30,50,35,70,163,163,124,0,0,0,0,0,0,0,0,0,0]
plt.xlabel('date')
plt.ylabel('nums')
plt.title('date-nums')
plt.plot(date, nums)# 多个折线,多次plt.plot(date, y)
plt.legend()# 显示标签
plt.show()
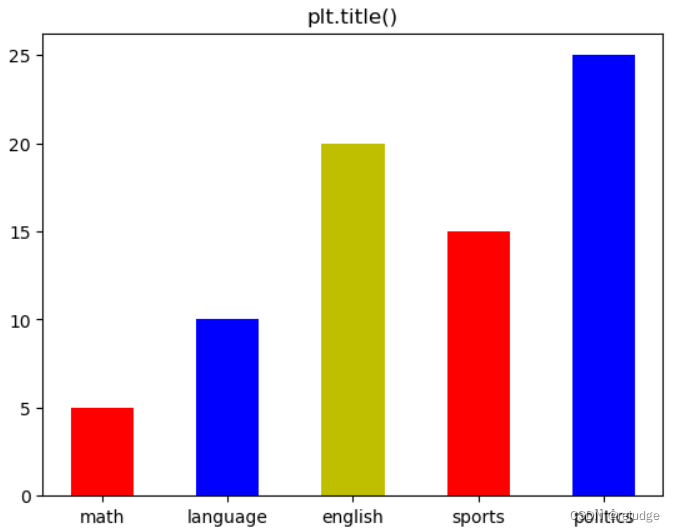
2. 柱状图
import matplotlib.pyplot as plt
y =[5,10,20,15,25]
x =['math','language','english','sports','politics']
plt.title("plt.title()")
plt.bar(x, y, color=['r','b','y'], width=0.5)
plt.show()


 890
890


 被折叠的 条评论
为什么被折叠?
被折叠的 条评论
为什么被折叠?
 到【灌水乐园】发言


