


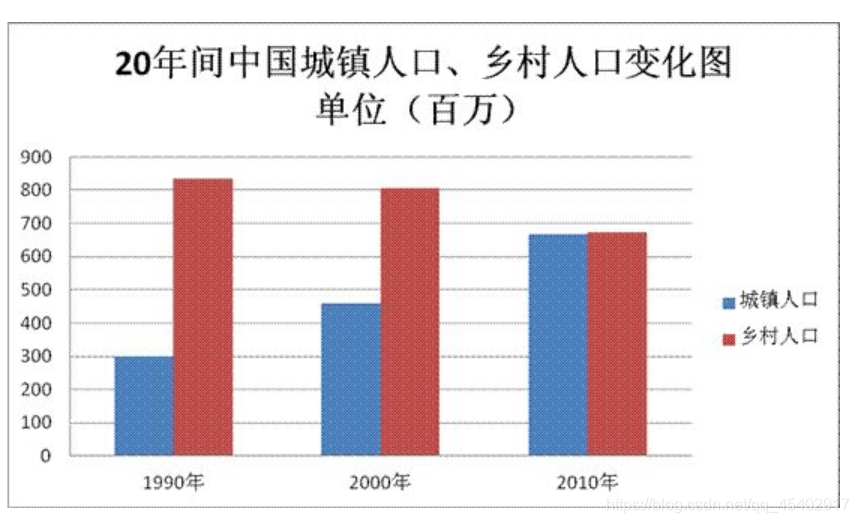
 这篇博客解析了2014年考研英语二的图表作文,展示了1990年至2010年中国城市和农村人口的变化趋势。城市人口稳步上升,达到6.7亿,而农村人口下降至6.8亿。原因在于大规模的城市化进程和农村居民向城市的迁移。预计未来城市人口将继续增长,带来人口过剩和交通拥堵等问题,政府需关注并解决由此产生的问题。
题目
Write an essay based on the following chart, in which you should
-
interpret the chart, and
-
give your comments
You should write about 150 words on the ANSWER SHEET.(15 points)
注意点
1.图表题在第一段描述图表信息时,一定要写清楚y轴变化具体数据
2.第二段写出现图表上情况的原因
3.第三段写图表上造成的情况和关于这个的一些建议.
答案
The bar chart shows the urban and rural population in China in three different periods. To be specific, the urban population has experienced a steady increase, from 300 million to about 670 million, while rural dwellers have dropped from 820 million to around 680 million, almost the same level of city dwellers.
The causes of this trend are well known. First, China has under
 最低0.47元/天 解锁文章


 被折叠的 条评论
为什么被折叠?
被折叠的 条评论
为什么被折叠?
 到【灌水乐园】发言


