vue 双y轴echarts x轴显示省略号 鼠标滑入显示提示窗

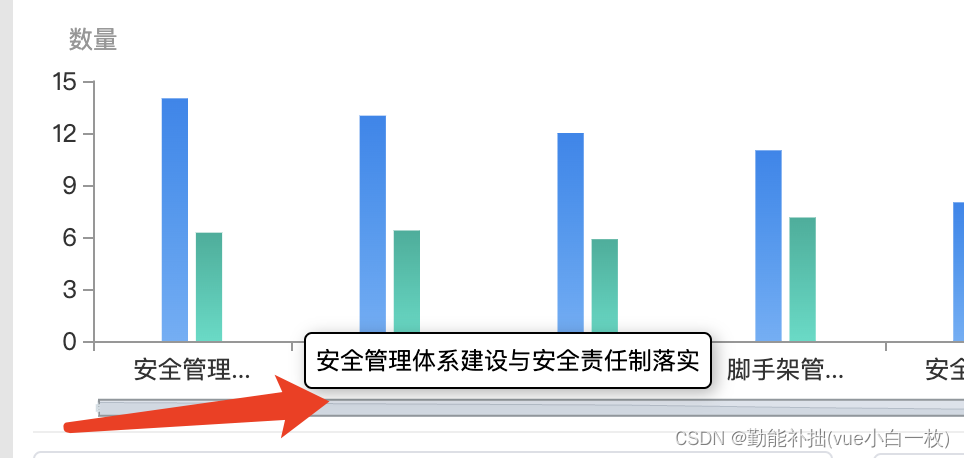
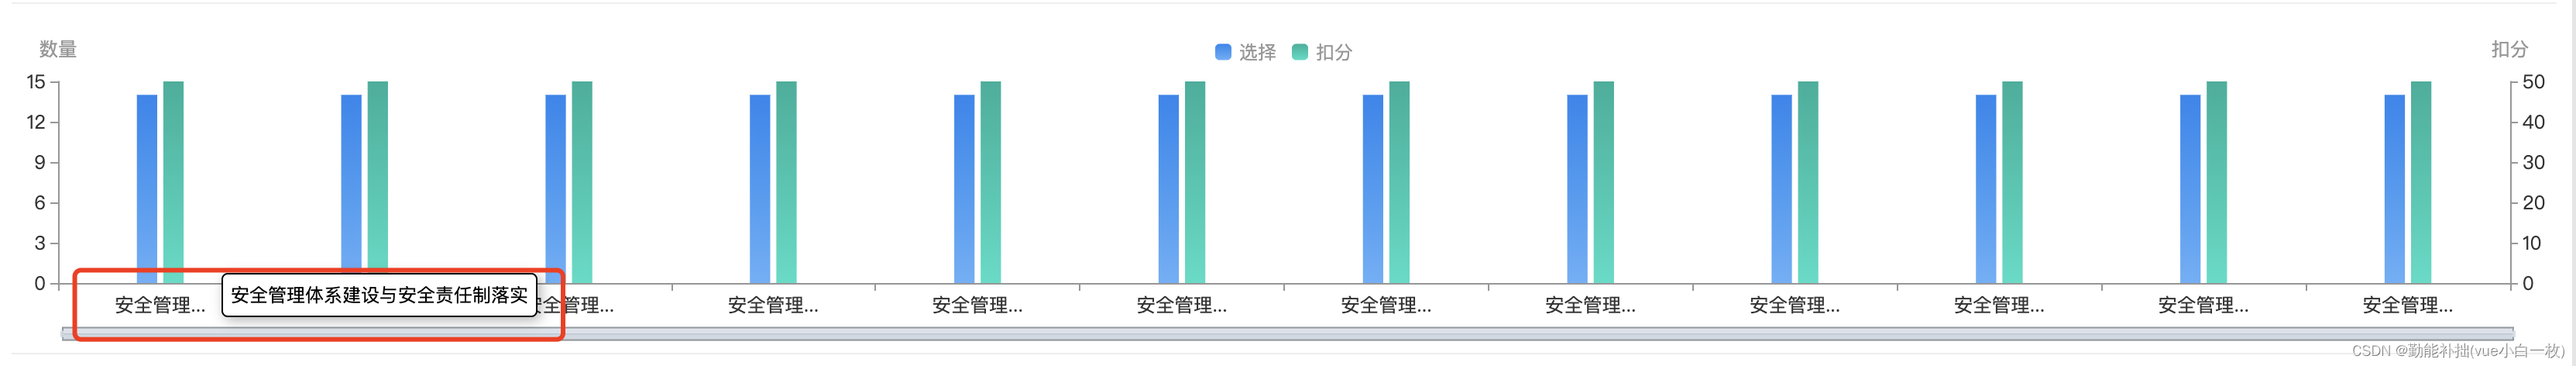
需求:鼠标移入x轴显示全部文字并且是悬浮窗的形式

效果图


上代码 cv直接用 

html代码

<div id="histogramEchart" style="margin-top:20px;height:200px;width:100%"></div>

js代码

悬浮窗核心代码

reminder(myChart) {
      // params.componentType == 'xAxis'或者  params.componentType == 'yAxis' 看你需求是x还是y
      // 显示悬浮窗 获取div 有就不创建没有创建
      var divData = document.getElementById("extensionId");
      if (!divData) {
        var div = document.createElement("div");
        div.setAttribute("id", "extensionId");
        div.style.display = "block";
        document.querySelector("html").appendChild(div);
      }
      // 鼠标移入事件
      myChart.on("mouseover", function(params) {
        if (params.componentType == "xAxis") {
          var divData = document.querySelector("#extensionId");
          //显示的样式 自己写就行
          var elementStyle =
            "position: absolute;z-index: 99999;color: #000;font-size: 12px;padding: 5px;display: inline;border-radius: 4px;background-color: #fff;box-shadow: rgba(0, 0, 0, 0.3) 2px 2px 8px;border:1px solid #000";
          divData.style.cssText = elementStyle;
          divData.innerHTML = params.value;
          document.querySelector("html").onmousemove = function(event) {
            var divData = document.querySelector("#extensionId");
            var xx = event.pageX + 40; //x位置 自己调整
            var yy = event.pageY - 20; //y位置 自己调整
            divData.style.top = yy + "px";
            divData.style.left = xx + "px";
          };
        }
      });
      // 鼠标移出事件
      myChart.on("mouseout", function(params) {
        if (params.componentType == "xAxis") {
          var divData = document.querySelector("#extensionId");
          divData.style.cssText = "display:none";
        }
      });
    },

柱状图核心代码

在下面得到echarts之后 传入这个方法 当然也可以写到一起
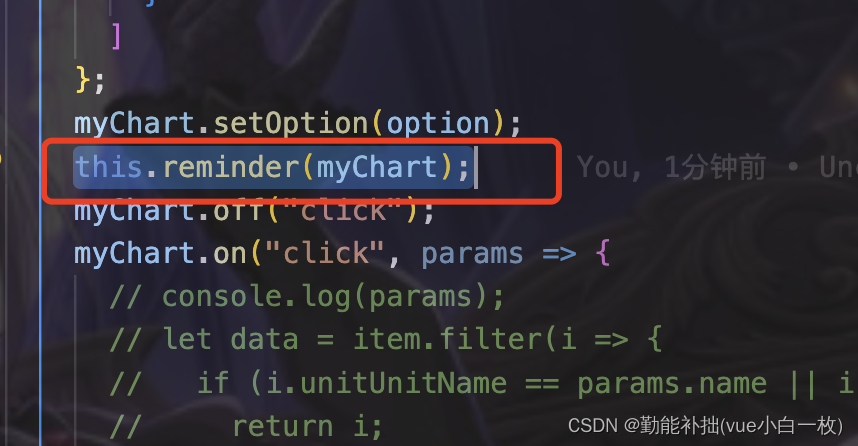


柱状图代码

// 柱状图 评价标准echarts
    barEchartData() {
      var data = [
        {
          evaluation: "安全管理体系建设与安全责任制落实",
          pointcount: 50,
          unitcount: 14
        },
        {
          evaluation: "安全管理体系建设与安全责任制落实",
          pointcount: 50,
          unitcount: 14
        },
        {
          evaluation: "安全管理体系建设与安全责任制落实",
          pointcount: 50,
          unitcount: 14
        },
        {
          evaluation: "安全管理体系建设与安全责任制落实",
          pointcount: 50,
          unitcount: 14
        },
        {
          evaluation: "安全管理体系建设与安全责任制落实",
          pointcount: 50,
          unitcount: 14
        },
        {
          evaluation: "安全管理体系建设与安全责任制落实",
          pointcount: 50,
          unitcount: 14
        },
        {
          evaluation: "安全管理体系建设与安全责任制落实",
          pointcount: 50,
          unitcount: 14
        },
        {
          evaluation: "安全管理体系建设与安全责任制落实",
          pointcount: 50,
          unitcount: 14
        },
        {
          evaluation: "安全管理体系建设与安全责任制落实",
          pointcount: 50,
          unitcount: 14
        },
        {
          evaluation: "安全管理体系建设与安全责任制落实",
          pointcount: 50,
          unitcount: 14
        },
        {
          evaluation: "安全管理体系建设与安全责任制落实",
          pointcount: 50,
          unitcount: 14
        },
        {
          evaluation: "安全管理体系建设与安全责任制落实",
          pointcount: 50,
          unitcount: 14
        },
      ];
      var xData = [];
      var yProductNum = [];
      var yNumber = [];
      var myChart = echarts.init(document.getElementById("histogramEchart"));
      myChart.clear();
      data.forEach(it => {
        xData.push(it.evaluation);
        if (!it.pointcount) {
          it.pointcount = 0;
        }
        if (!it.unitcount) {
          it.unitcount = 0;
        }
        yProductNum.push(it.unitcount);
        yNumber.push(it.pointcount);
      });
      // 指定图表的配置项和数据
      var option = {
        tooltip: {
          trigger: "axis",
          backgroundColor: "rgba(0,0,0,0)", // 提示框浮层的背景颜色。
          position: function(point, params, dom, rect, size) {
            var x = 0; // x坐标位置
            var y = 0; // y坐标位置
            // 当前鼠标位置
            var pointX = point[0];
            var pointY = point[1];
            // 提示框大小
            var boxWidth = size.contentSize[0];
            var boxHeight = size.contentSize[1];

            // boxWidth > pointX 说明鼠标左边放不下提示框
            if (boxWidth > pointX) {
              x = pointX + 10;
            } else {
              // 左边放的下
              x = pointX - boxWidth - 10;
            }

            // boxHeight > pointY 说明鼠标上边放不下提示框
            if (boxHeight > pointY) {
              y = 5;
            } else {
              // 上边放得下
              y = pointY - boxHeight;
            }
            return [x, y];
          },

          formatter: function(params) {
            var res = "";
            res += `
            <div
                style="
                width: 180px;
                min-height: 60px;
                padding-bottom:5px;
                background: #fff;
                box-shadow: 0px 0px 6px 1px rgba(106, 106, 106, 0.16);
                border-radius: 5px 5px 5px 5px;
                "
            >
                <div
                style="
                    width: 140px;
                    font-size: 14px;
                    font-weight: 500;
                    color: #333333;
                    line-height: 20px;
                    padding-top: 15px;
                    margin-left: 20px;
                    margin-right: 20px;
                    margin-bottom: 6px;
                "
                >
                ${String(params[0].name).replace(/(.{10})/g, "$1<br/>")}
                </div>
                <div
                style="
                    margin-top: 6px;
                    margin-bottom: 6px;
                    margin-left: 20px;
                    margin-right: 20px;
                    display: flex;
                    align-items: center;
                    justify-content: space-between;
                "
                >
                <div style="display: flex; align-items: center">
                    <div
                    style="
                        width: 8px;
                        height: 8px;
                        background: linear-gradient(181deg, #1887ef 0%, #62b0f9 100%);
                        border-radius: 0px 0px 0px 0px;
                    "
                    ></div>
                    <div
                    style="
                        font-size: 14px;
                        width: 84px;
                        font-weight: 400;
                        color: #333333;
                        margin-right: 6px;
                        margin-left: 6px;
                    "
                    >
                    总单位选择
                    </div>
                </div>
                <div style="font-size: 14px; font-weight: 400; color: #333333">${
                  params[0].value
                }</div>
                </div>
                <div
                style="
                    margin-top: 6px;
                    margin-bottom: 6px;
                    margin-left: 20px;
                    margin-right: 20px;
                    display: flex;
                    align-items: center;
                    justify-content: space-between;
                "
                >
                <div style="display: flex; align-items: center">
                    <div
                    style="
                        width: 8px;
                        height: 8px;
                        background: linear-gradient(180deg, #00b09a 0%, #27ddc6 100%);
                        border-radius: 0px 0px 0px 0px;
                    "
                    ></div>
                    <div
                    style="
                        font-size: 14px;
                        width: 84px;
                        font-weight: 400;
                        color: #333333;
                        margin-right: 6px;
                        margin-left: 6px;
                    "
                    >
                    总扣分
                    </div>
                </div>
                <div style="font-size: 14px; font-weight: 400; color: #333333">
                    ${params[1].value}
                </div>
                </div>
            </div>
            `;
            return res;
          }
        },
        grid: {
          //调整统计图上下左右边距
          top: 30,
          right: 30,
          left: 30,
          bottom: 40
        },
        legend: {
          orient: "horizontal",
          x: "center",
          y: "top",
          textStyle: {
            color: "#989898"
          },
          itemWidth: this.$fontChart(0.12),
          itemHeight: this.$fontChart(0.12),
          align: "left"
        },
        dataZoom: [
          {
            id: "dataZoomX",
            show: true,
            showDetail: false,
            height: this.$fontChart(0.1),
            xAxisIndex: [0],
            bottom: 3,
            startValue: 0,
            endValue: 15,
            handleStyle: {
              color: "#d3dee5"
            },
            textStyle: {
              color: "#fff"
            },
            borderColor: "#90979c"
          }
        ],
        xAxis: [
          {
            type: "category",
            data: xData,
            axisPointer: {
              type: "shadow"
            },
            triggerEvent: true,
            axisLabel: {
              show: true,
              textStyle: {
                color: "#333",
                fontSize: this.$fontChart(0.14)
              },
              interval: 0,

              formatter: function(value) {
                if (value) {
                  if (value.length >= 4) {
                    return `${value.slice(0, 4)}...`;
                  } else {
                    return value;
                  }
                }
              }
            },
            axisLine: {
              // X轴线的颜色
              lineStyle: {
                color: "#979797",
                width: 1
              }
            }
          }
        ],
        yAxis: [
          {
            splitLine: {
              //控制刻度横线的显示
              show: false
            },
            type: "value",
            name: "数量",
            nameTextStyle: {
              ameLocation: "start",
              fontSize: this.$fontChart(0.14)
            },
            axisLabel: {
              formatter: "{value}",
              show: true,
              textStyle: {
                color: "#333",
                fontSize: this.$fontChart(0.14)
              }
            },
            axisLine: {
              // Y轴线的颜色、和轴线的宽度
              lineStyle: {
                color: "#979797",
                width: 1
              }
            }
          },
          {
            splitLine: {
              show: false
            },
            name: "扣分",
            type: "value",
            nameTextStyle: {
              fontSize: this.$fontChart(0.14)
            },
            axisLabel: {
              formatter: "{value}",
              show: true,
              textStyle: {
                color: "#333",
                fontSize: this.$fontChart(0.14)
              }
            },
            axisLine: {
              lineStyle: {
                color: "#979797",
                width: 1
              }
            }
          }
        ],
        series: [
          {
            name: "选择",
            type: "bar",
            barWidth: this.$fontChart(0.15),
            yAxisIndex: 0,
            data: yProductNum,
            itemStyle: {
              //双Y轴B柱的柱体颜色
              normal: {
                color: new echarts.graphic.LinearGradient(0, 0, 0, 1, [
                  { offset: 0, color: "#1887EF" },
                  { offset: 1, color: "#62B0F9" }
                ])
              }
            }
          },

          {
            name: "扣分",
            type: "bar",
            barWidth: this.$fontChart(0.15),
            yAxisIndex: 1,
            data: yNumber,
            itemStyle: {
              //双Y轴A柱的柱体颜色
              normal: {
                // 颜色渐变
                color: new echarts.graphic.LinearGradient(0, 0, 0, 1, [
                  { offset: 0, color: "#00B09A" },
                  { offset: 1, color: "#27DDC6" }
                ])
              }
            }
          }
        ]
      };
      myChart.setOption(option);
      this.reminder(myChart);
      myChart.off("click");
      myChart.on("click", params => {
         //点击事件
      });
      myChart.resize();
      window.addEventListener("resize", function() {
        myChart.resize();
      });
    }

  • 2
    点赞
  • 3
    收藏
    觉得还不错? 一键收藏
  • 打赏
    打赏
  • 0
    评论
要在 Vue2 中使用 ECharts 实现 x 轴 y 轴气泡图,你需要先安装 ECharts。 可以通过 npm 或 yarn 安装 ECharts: ```bash npm install echarts --save # 或者 yarn add echarts ``` 安装完成后,在 Vue 组件中引 ECharts: ```javascript import echarts from 'echarts' ``` 然后在组件的 mounted 钩子函数中初始化 ECharts 实例: ```javascript mounted () { // 初始化 ECharts 实例 const chart = echarts.init(this.$refs.chart) // 具体的 ECharts 配置 const option = { // 配置项 } // 使用刚指定的配置项和数据显示图表 chart.setOption(option) } ``` 对于气泡图,可以使用 scatter 和 visualMap 组件实现。以下是一个简单的示例: ```javascript mounted () { // 初始化 ECharts 实例 const chart = echarts.init(this.$refs.chart) // ECharts 配置 const option = { xAxis: { type: 'value', scale: true }, yAxis: { type: 'value', scale: true }, visualMap: { min: 0, max: 100, dimension: 2, calculable: true, orient: 'horizontal', left: 'center', bottom: '15%' }, series: [{ type: 'scatter', data: [ [10.0, 8.04, 10], [8.0, 6.95, 30], [13.0, 7.58, 20], [9.0, 8.81, 50], [11.0, 8.33, 80], [14.0, 9.96, 40], [6.0, 7.24, 70], [4.0, 4.26, 90], [12.0, 10.84, 60], [7.0, 4.82, 100], [5.0, 5.68, 10] ], symbolSize: function (data) { return Math.sqrt(data[2]) }, label: { emphasis: { show: true, formatter: function (param) { return param.data[2] }, position: 'top' } }, itemStyle: { normal: { shadowBlur: 10, shadowColor: 'rgba(120, 36, 50, 0.5)', shadowOffsetY: 5, color: new echarts.graphic.RadialGradient(0.4, 0.3, 1, [{ offset: 0, color: 'rgb(251, 118, 123)' }, { offset: 1, color: 'rgb(204, 46, 72)' }]) } } }] } // 使用刚指定的配置项和数据显示图表 chart.setOption(option) } ``` 在模板中添加一个 div 占位符,并设置 ref 属性为 chart: ```html <template> <div ref="chart" style="width: 100%; height: 400px;"></div> </template> ``` 这样就可以在 Vue2 中使用 ECharts 实现 x 轴 y 轴气泡图了。

“相关推荐”对你有帮助么?

  • 非常没帮助
  • 没帮助
  • 一般
  • 有帮助
  • 非常有帮助
提交
评论
添加红包

请填写红包祝福语或标题

红包个数最小为10个

红包金额最低5元

当前余额3.43前往充值 >
需支付:10.00
成就一亿技术人!
领取后你会自动成为博主和红包主的粉丝 规则
hope_wisdom
发出的红包

打赏作者

new Vue()

你的鼓励将是我创作的最大动力

¥1 ¥2 ¥4 ¥6 ¥10 ¥20
扫码支付:¥1
获取中
扫码支付

您的余额不足,请更换扫码支付或充值

打赏作者

实付
使用余额支付
点击重新获取
扫码支付
钱包余额 0

抵扣说明:

1.余额是钱包充值的虚拟货币,按照1:1的比例进行支付金额的抵扣。
2.余额无法直接购买下载,可以购买VIP、付费专栏及课程。

余额充值