eacharts柱状图
先看效果图
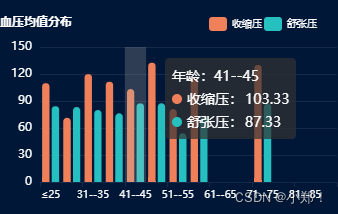
<div id="distribution_BP_AVG" style="width:600px;height:400px;"></div>
drawLine(){
var TypeArr =['≤25', '26--30', '31--35', '36--40', '41--45', '46--50', '51--55', '56--60', '61--65', '66--70', '71--75', '76--80', '81--85', ' ≥86'];//横轴
      var TotalOArr =['109.76', '71.50', '119.80', '111.33', '103.33', '132.50', '81.00', '115.00', 0, 0, '130.00', 0, 0, 0]//收缩压
      var TotalTArr = ['84.12', '83.33', '80.00', '76.33', '87.33', '87.50', '54.17', '72.40', 0, 0, '87.50', 0, 0, 0];//舒张压
// 基于准备好的dom,初始化echarts实例
        let myChart = this.$echarts.init(document.getElementById('distribution_BP_AVG'))
        // 绘制图表
        myChart.setOption({
          // backgroundColor: "#cccccc",
          title: {
            text: '血压均值分布',
            x: 'left',      //可设定图例在左、右、居中
            y: 'top',     //可设定图例在上、下、居中
            padding: [10, 30, 0, 0],
            textStyle: {//图例文字的样式
              color: '#fff',
              fontSize: 12
            }
          },
          tooltip: {
            trigger: 'axis',
            axisPointer: {
              type: 'shadow'
            },
            formatter: function (params, ticket, callback) {
              // console.log('params', params, ticket,)
              var axisValueLabel = "";
              var html = ''
              for (let i = 0; i < params.length; i++) {
                axisValueLabel = params[i].name
                html += '<tr>';
                html += '	<td style="text-align:right;">' + params[i].marker + params[i].seriesName + ':</td>';
                html += '	<td style="text-align:left;">' + params[i].data + '</td>';
                html += '</tr>';
              }
              return '<table><tr><td colspan=2 style="text-align:left;">年龄:' + axisValueLabel + '</td></tr>' + html + '</table>';
            }
          },
          legend: {
            data: ["收缩压", "舒张压"],
            x: 'right',      //可设定图例在左、右、居中
            y: 'top',     //可设定图例在上、下、居中
            padding: [10, 30, 0, 0],   //可设定图例[距上方距离,距右方距离,距下方距离,距左方距离]
            itemGap: 2,
            itemWidth: 18,
            itemHeight: 14,
            textStyle: {//图例文字的样式
              color: '#fff',
              fontSize: 10
            }
          },
          calculable: false,
          grid: {
            borderWidth: 1,
            top: '40',
            left: '40',
            right: '10',
            bottom: '25'
          },
          xAxis: [
            {
              type: 'category',
              data: TypeArr,
              axisLabel: {
                textStyle: {
                  color: '#fff',
                  fontSize: 10,
                }
              },
              axisLine: {
                show: true,//是否显示轴线
                lineStyle: {
                  color: '#152948',//刻度线的颜色
                }
              },
            }
          ],
          yAxis: [
            {
              type: 'value',
              axisLabel: {
                show: true,
                textStyle: {
                  color: '#fff'
                }
              },
              minInterval: 1,
              axisLine: false,
              splitLine: {
                lineStyle: {
                  color: "#152948",
                }
              }

            }
          ],
      series: [{
        name: "收缩压",
        type: "bar",
        data: TotalOArr,
        // data: this.weight,
        lineStyle: {
          color: "#f0805a",
        },
        itemStyle: {
          normal: {
            color: "#f0805a",
            barBorderRadius: [20, 20, 0, 0]
          },
        },
      },
      {
        name: "舒张压",
        type: "bar",
        data: TotalTArr,
        // data: this.bmi_value,
        lineStyle: {
          color: "#26c0c0",
        },
        itemStyle: {
          normal: {
            color: "#26c0c0",
            barBorderRadius: [20, 20, 0, 0]
          },
        },
      },]
    });
  })
}


 535
535


 被折叠的 条评论
为什么被折叠?
被折叠的 条评论
为什么被折叠?
 到【灌水乐园】发言


