


目录
一、jmeter、prometheus、grafana安装
我这里用的软件版本:jdk-11.0.21,jmeter-5.4.2,prometheus-2.47.2、grafana-10.0.3
本地Mac系统:jdk、Charles、GoReplay、NodeJs、grafana在Mac环境安装教程
服务器Linux系统:JDK、python、influxdb、jmeter在Linux服务器测试环境搭建教程
二、jmeter配置prometheus监听器
1、下载jmeter对应的prometheus监听器插件
目前jmeter对应的prometheus监听器插件github上有多个,我这里用的是下载量最多的jmeter-prometheus-plugin插件,版本jmeter-prometheus-plugin-0.7.1
常用的Prometheus Listener for Jmete插件
| 名称 | 适用平台 | 插件下载地址 | 开源地址 | 简介 | 备注 |
|---|---|---|---|---|---|
| jmeter-prometheus-plugin | window mac Linux | https://github.com/johrstrom/jmeter-prometheus-plugin/releases | https://github.com/johrstrom/jmeter-prometheus-plugin | 这个 JMeter 插件是高度可配置的监听器(和配置元素),允许用户定义他们自己的指标(名称、类型等),并通过 Prometheus /metrics API 公开它们,以供 Prometheus 服务器抓取。 | 需要自己配置自定义指标,只支持pull方式公开指标,有对应的grafana监控面板 |
| jmeter-prometheus-listener | window、 mac Linux | https://github.com/kolesnikovm/jmeter-prometheus-listener/releases | https://github.com/kolesnikovm/jmeter-prometheus-listener | 用于 Prometheus 指标导出的 Apache JMeter 后端侦听器实现。基于拉式和基于推式的模型都通过不同的实现来支持。 | 不需要自定义指标,支持通过pull跟push两种方式采集指标,需要自己配置监控面板 |
| jmeter_prom_exporter | docker | 启动命令:docker run --rm --name jmeter -i -v 密码:\tmp -p 9270:9270 chiabre/jmeter_prom_exporter:5.4.1-0.6.0 -t [YOUR_SCRIPT].jmx | https://github.com/chiabre/jmeter_prom_exporter | 复用jmeter-prometheus-plugin插件打包的docker镜像 | 这个没用过,自测 |
我这里用的示范是第一个插件,下载jmeter-prometheus-plugin-0.7.1.jar插件后,放在对应的jmeter/lib/ext目录下,重启jmeter
2、添加取样器
添加线程组-->添加http请求→添加查看结果树/聚合报告等
如果只需要测试一下插件是否可用,直接添加一个java请求测试一下即可
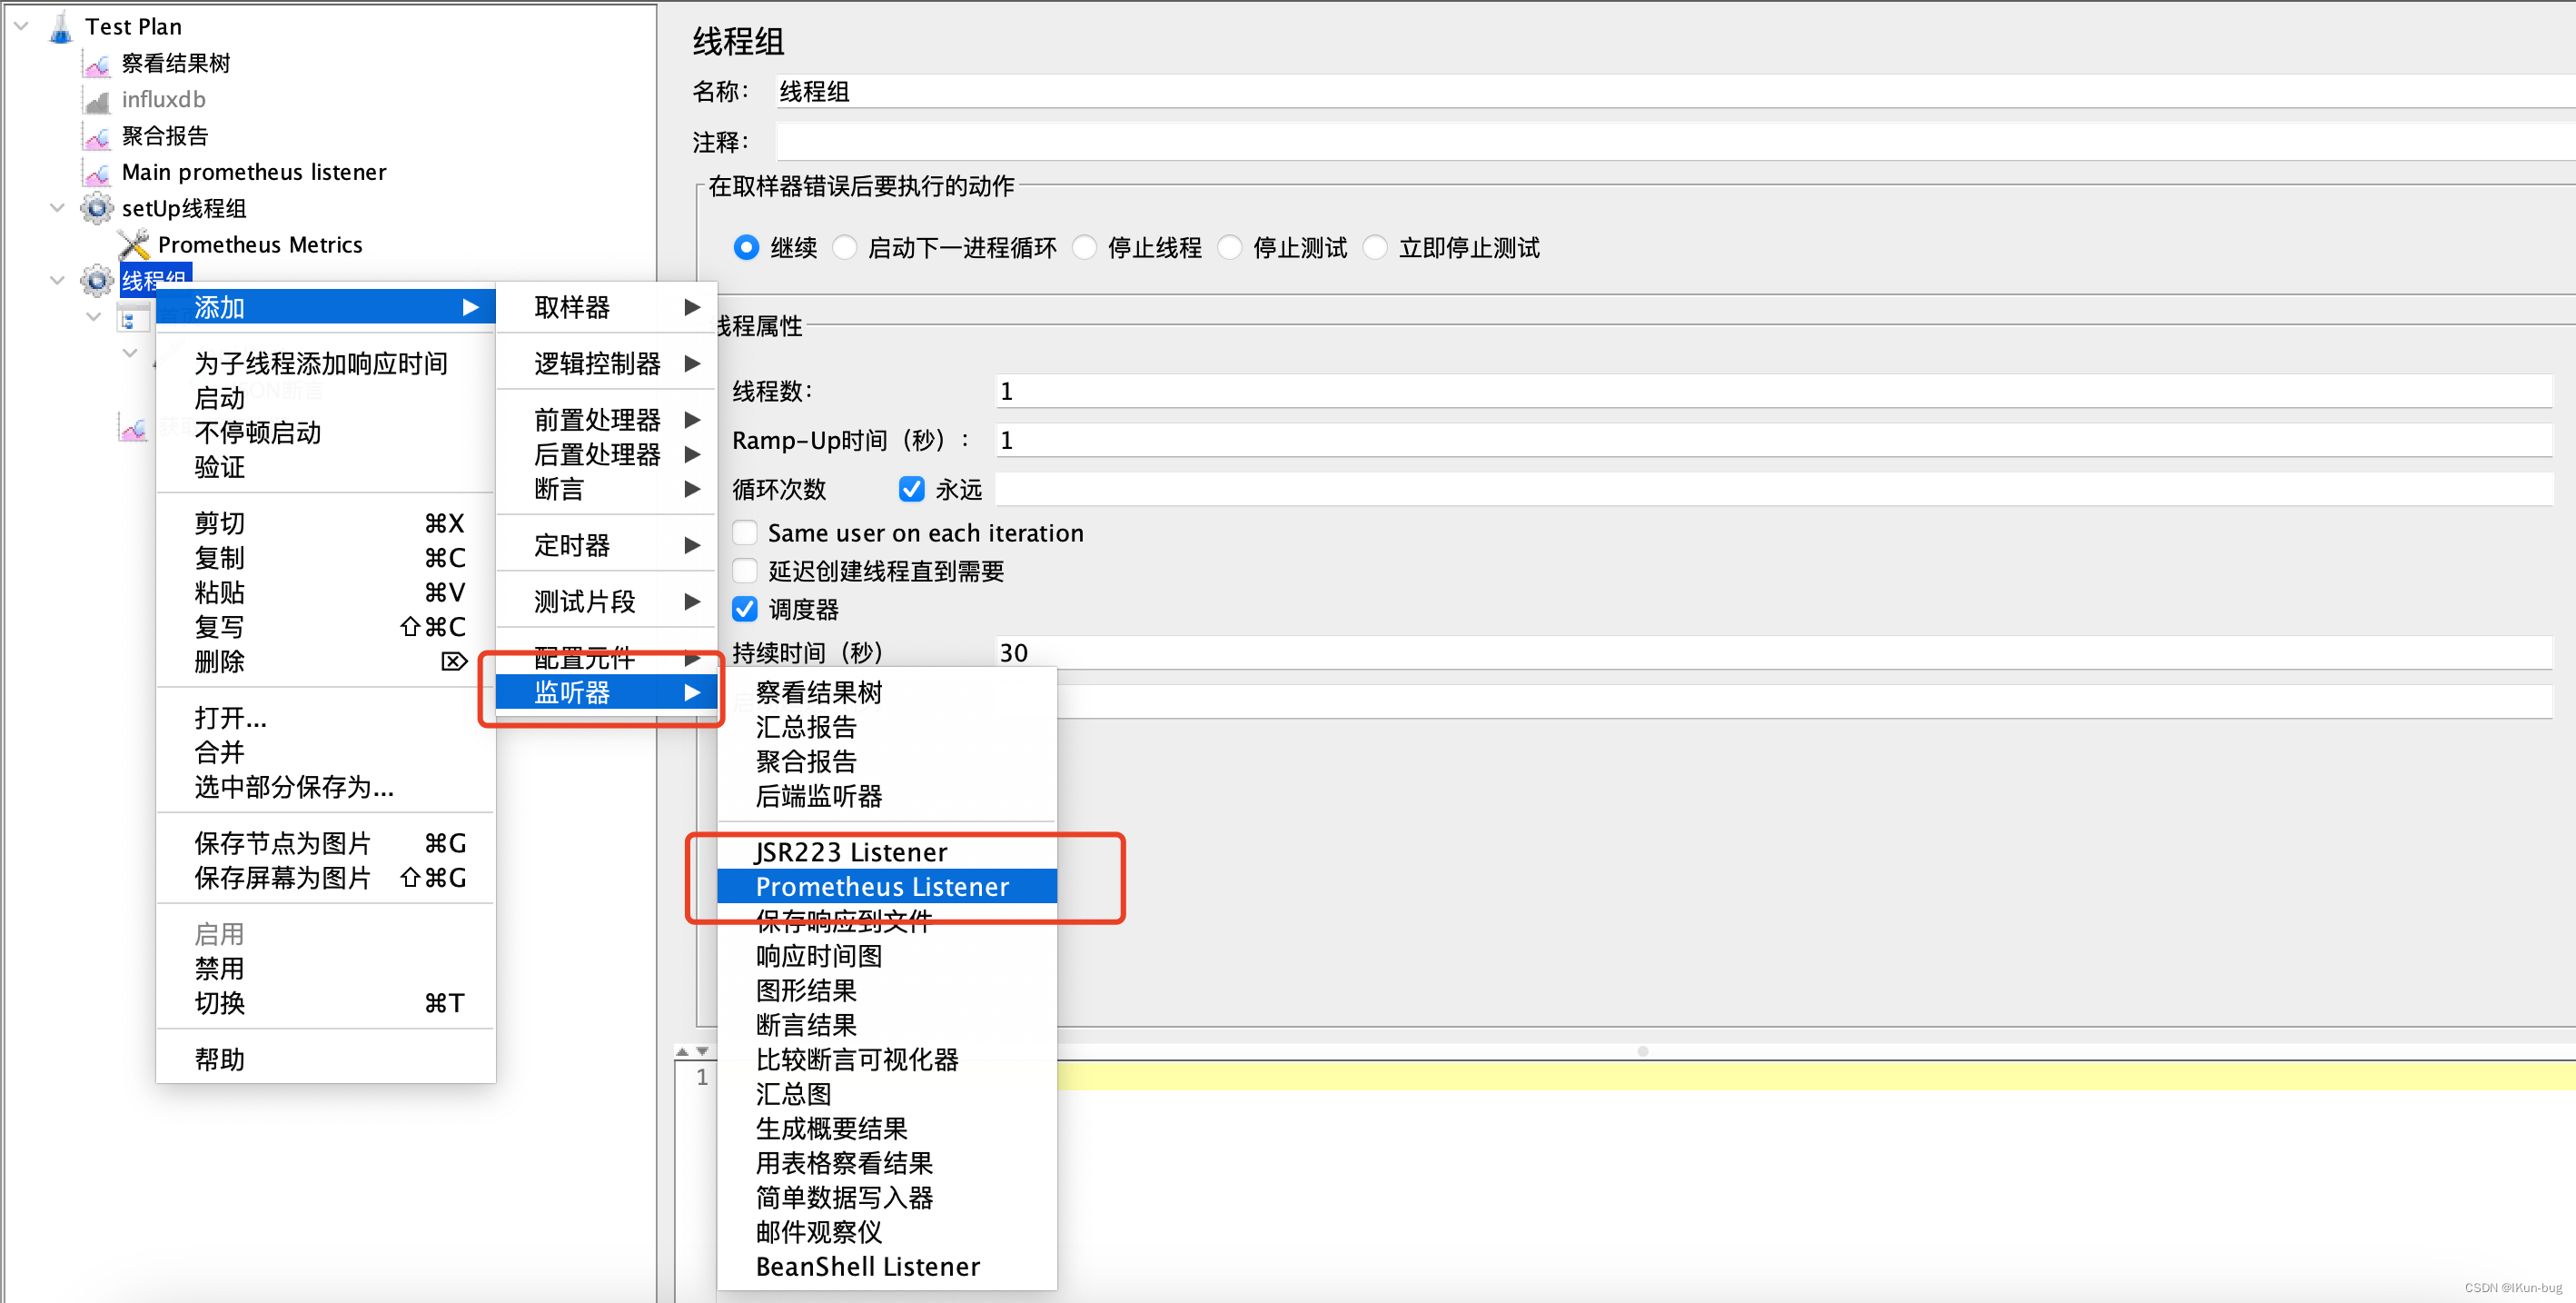
3、添加prometheus监听器
线程组-->添加Prometheus Listener,如果没有找到Prometheus Listener,请检查下载的jar包放的路径是否正确,需要重启jmeter

4、暴露相关指标
1、配置插件默认指标
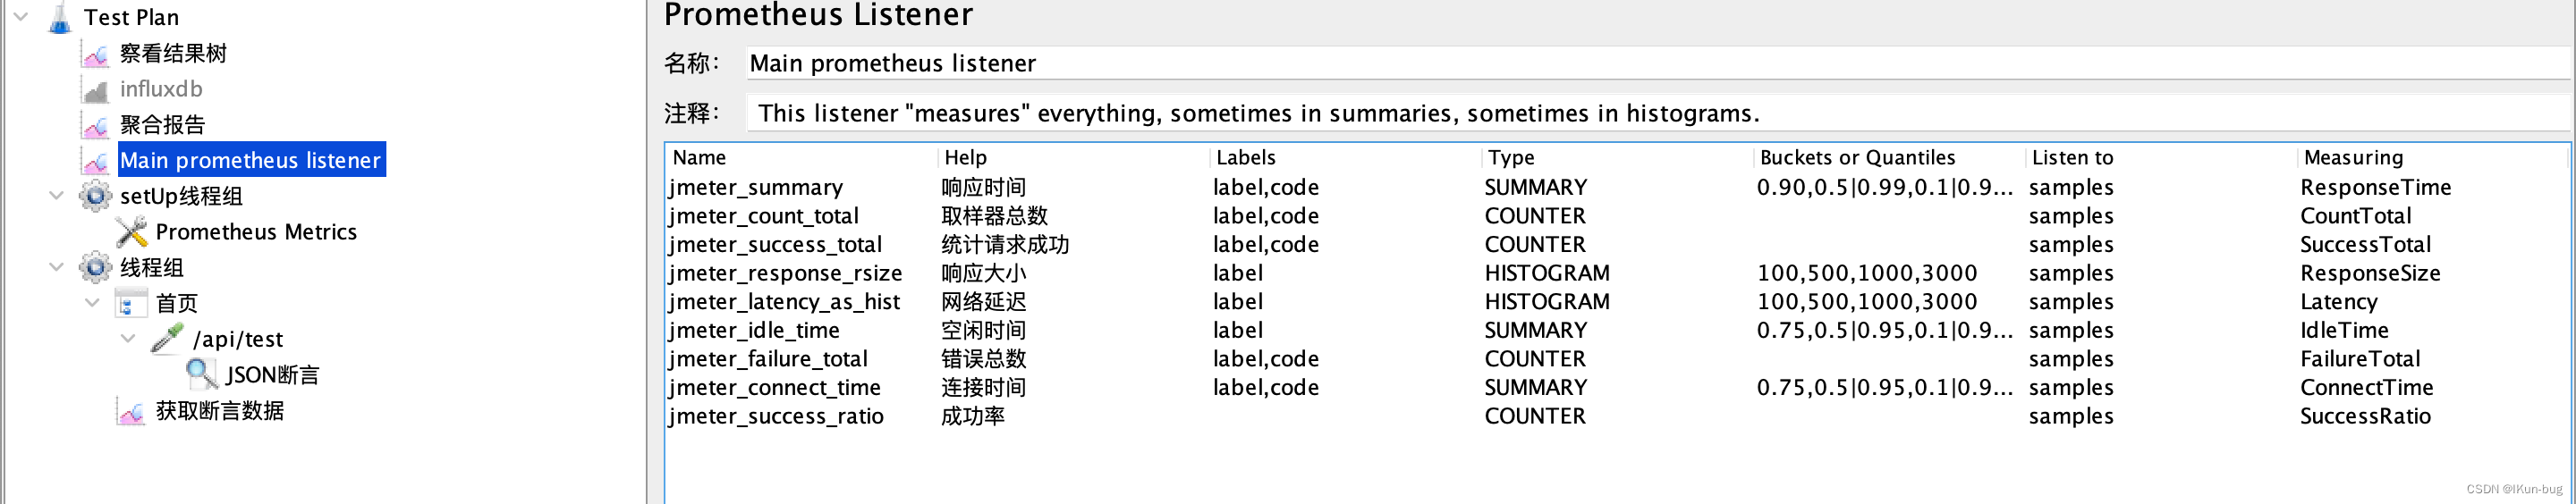
需要暴露自带的指标,需要自己配置现有的指标名称跟类型,以下是插件内默认的指标跟类型
可以按如下图配置监听面板
第一列表示插件定义好的指标名,第一行表示对应的指标类型,x表示这个指标名称可以定义的指标类型
这是哪些指标类型可以衡量哪些指标的矩阵,如果你定义的指标名不在以下指标类型中,则该插件可能不会执行任何操作来更新该指标
| Histogram | Summary | Counter | Guage | Success Ratio | |
|---|---|---|---|---|---|
| Response time | x | x | |||
| Response size | x | x | |||
| Latency | x | x | |||
| Idle time | x | x | |||
| Connect time | x | x | |||
| Count total | x | ||||
| Failure total | x | ||||
| Success total | x | ||||
| Success Ratio | x |
2、默认指标添加标签
默认的指标标签,只有label跟code,我需要手动添加断言名称跟断言结果指标
使用JSR223监听器
import org.apache.jmeter.assertions.AssertionResult

// 获取当前采样器的名称
String samplerName = sampleResult.getSampleLabel();
// 获取响应代码
String responseCode = prev.getResponseCode();

// 获取前一个采样器的断言结果
AssertionResult[] assertionResults = prev.getAssertionResults();
for (AssertionResult assertionResult : assertionResults) {
    if (assertionResult.isFailure() || assertionResult.isError()) {
        // 如果断言失败或出现错误,获取断言名称、失败消息和断言类型,并存储为 JMeter 变量
        String assertionName = assertionResult.getName();
        String failureMessage = assertionResult.getFailureMessage();
        vars.put("assertionName", assertionName);
        vars.put("failureMessage", failureMessage);
    }
} |
然后在prometheus listener监听器配置标签名称,直接引用jmeter变量即可
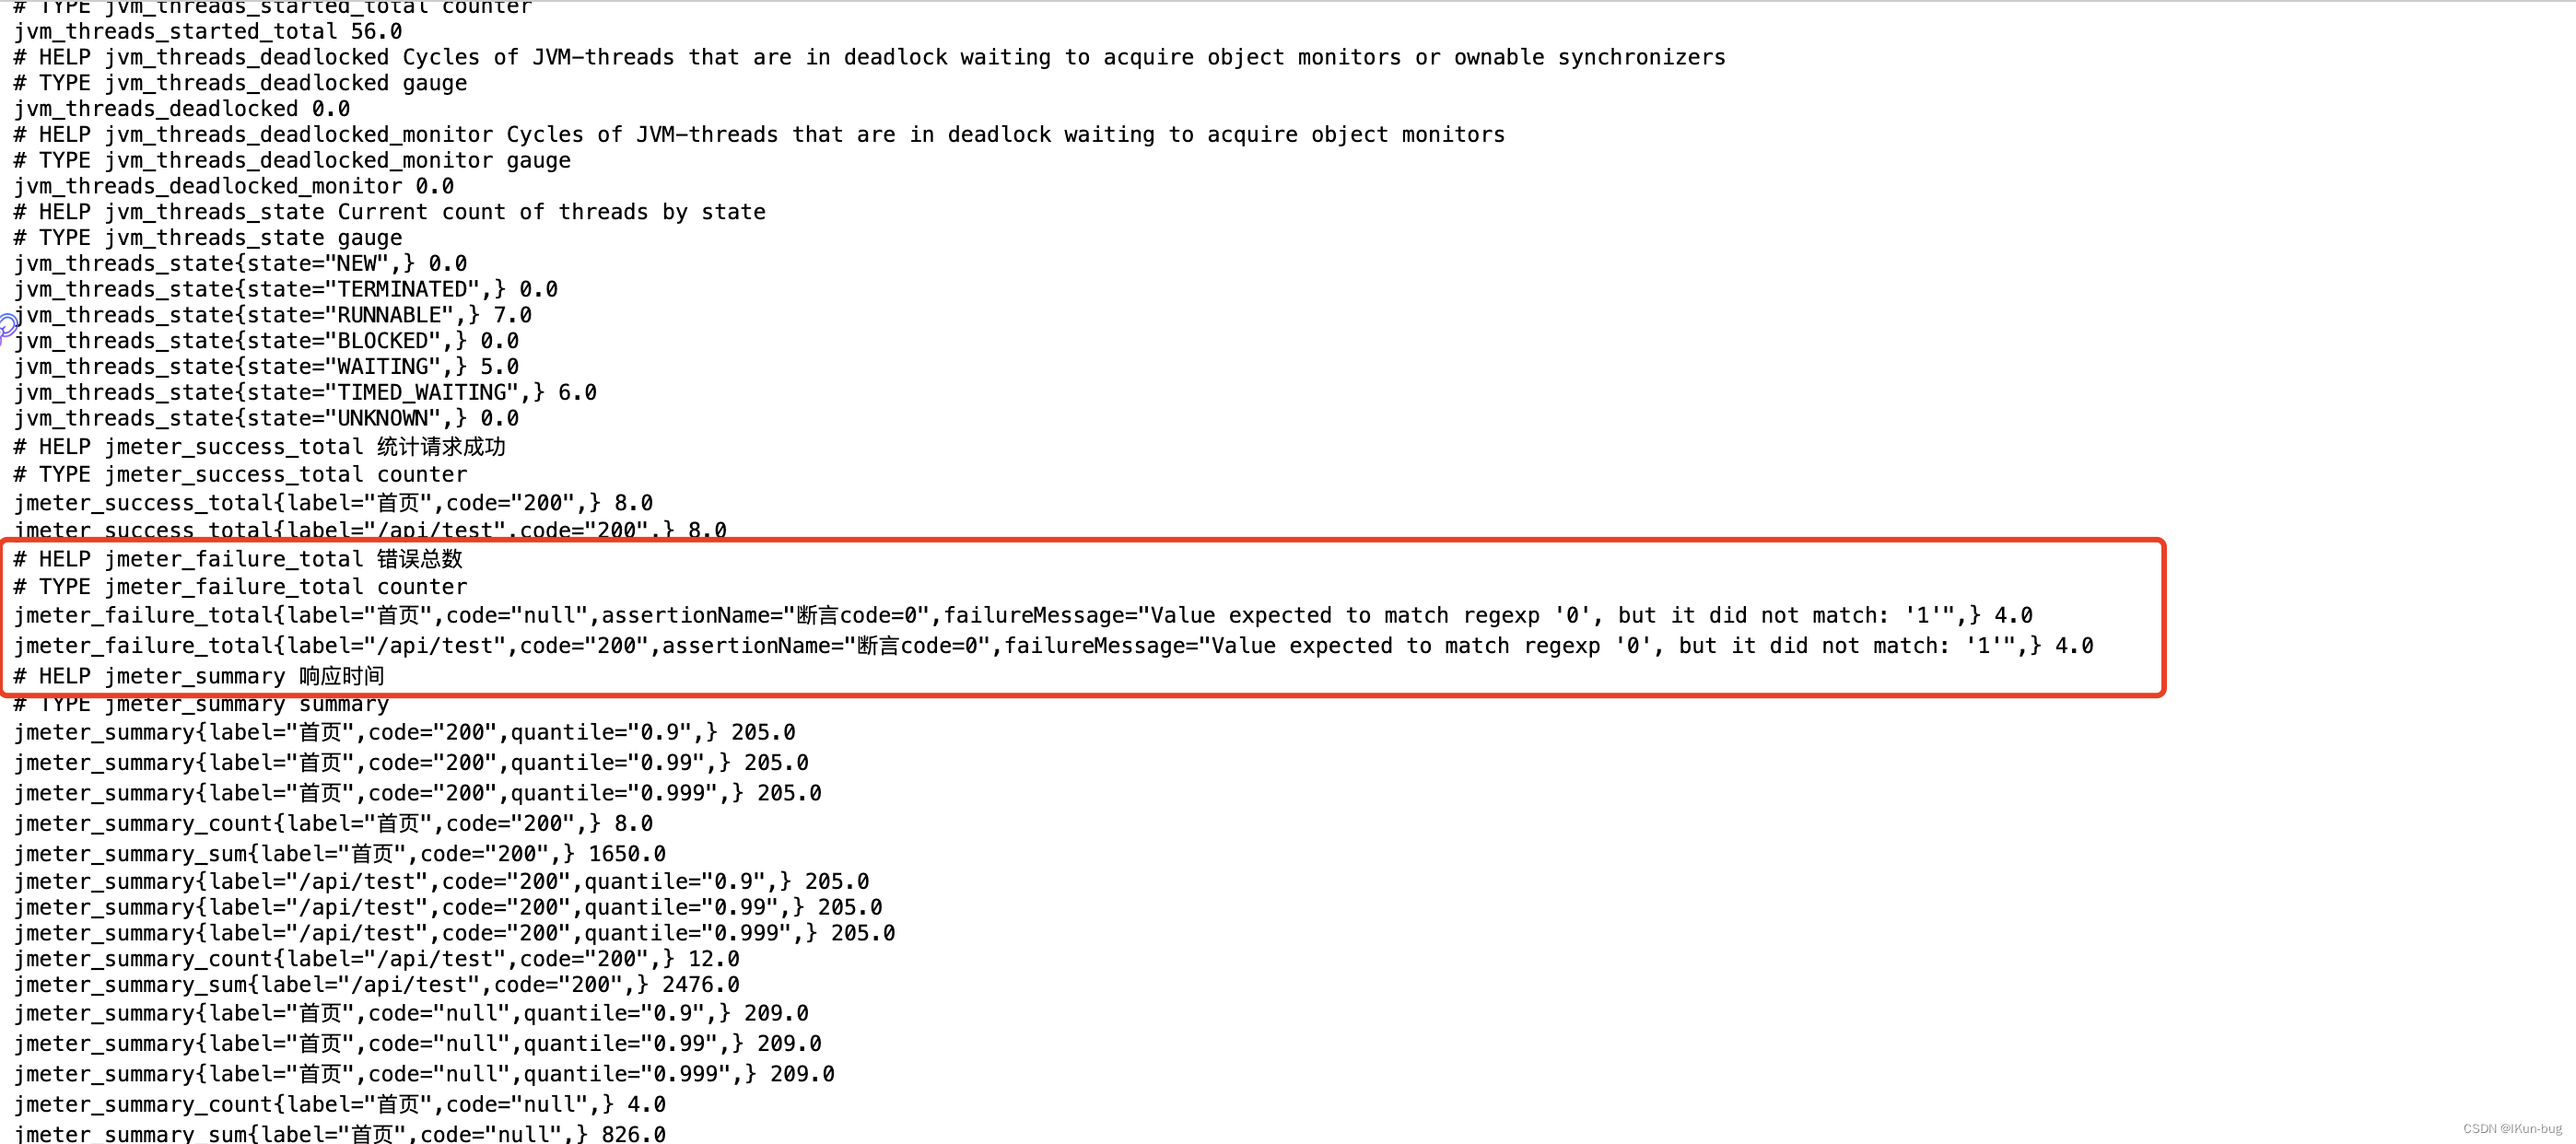
在jmeter_failure_total指标添加标签:label,code,assertionName,failureMessage
启动jmeter后,可以看到具体的标签有数据
3、配置自定义指标
配置自定义指标,需要提前创建指标名称跟指标类型,可以用插件自带的Prometheus Metrics完成,也可以用JSS223监听器创建
1、配置Prometheus Metrics面板
线程组-->配置元件-->添加Prometheus Metrics
配置Prometheus Metrics面板如下图
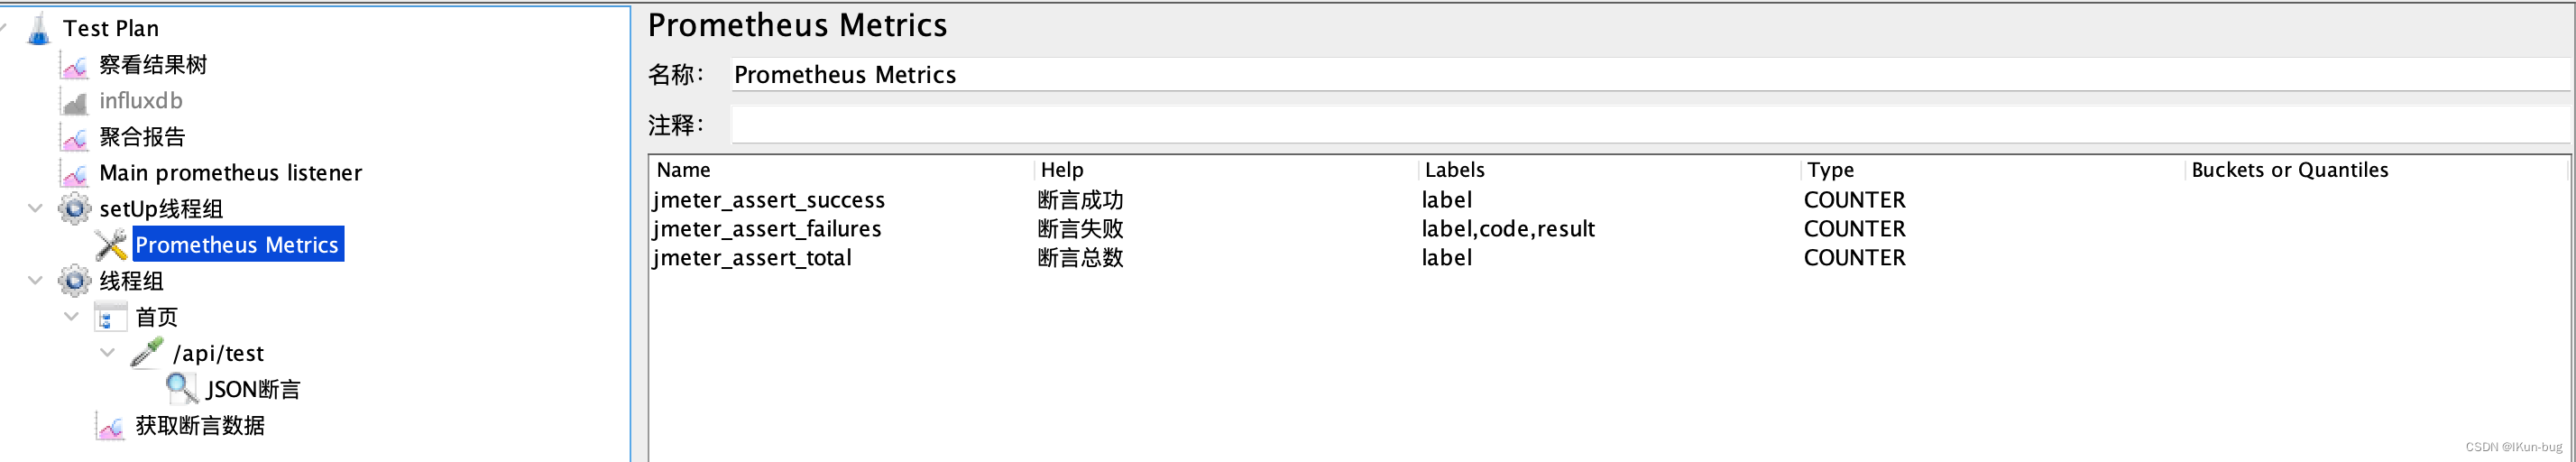
name:指标名称
help:帮助
lables:标签
type:指标类型
2、获取自定义指标
创建setUp线程组-->Prometheus Metrics→添加jmeter_assert_success、jmeter_assert_failures、jmeter_assert_total三个指标名称,定义计数器类型
每次压测前初始化指标,然后用JSR223监听器获取指标数据
获取断言失的名称、判断如果断言失败,获取响应的code,返回的断言结果
3、更新指标数据
用JR223监听器更新上面获取到的指标数据
JR223监听器完整代码如果下
import org.apache.jmeter.assertions.AssertionResult;
import io.prometheus.client.Counter;

// 获取当前取样器的名称
String samplerName = sampleResult.getSampleLabel();
// 获取并打印响应代码
String responseCode = prev.getResponseCode()
//log.info("Response Code: " + responseCode)

// 初始化断言成功和失败的计数器
Counter successes = (Counter) vars.getObject("jmeter_assert_success");
Counter failures = (Counter) vars.getObject("jmeter_assert_failures");
Counter total = (Counter) vars.getObject("jmeter_assert_total");

// 获取前一个取样器的断言结果
AssertionResult[] assertionResults = prev.getAssertionResults();

// 标记样本所有断言是否成功
boolean allAssertionsPassed = true;

// 检查断言结果并对计数器进行操作
for (AssertionResult assertionResult : assertionResults) {
    if (assertionResult.isFailure() || assertionResult.isError()) {
        // 如果断言失败,增加失败计数器
        failures.labels(samplerName, responseCode, assertionResult.getFailureMessage()).inc();
        allAssertionsPassed = false;

        // 打印断言失败的信息
//        log.info("----- Assertion Failed for Sampler: " + samplerName + " -----");
//        log.info("Failure Message: " + assertionResult.getFailureMessage());
    }
}

// 如果所有断言都成功,增加成功计数器
if (allAssertionsPassed) {
    successes.labels(samplerName).inc();
}
// 最后增加总数量计算器
total.labels(samplerName).inc(); |
5、查看指标
1、当所有的prometheus指标都配置完成后,开始运行jmx文件。
2、在http://0.0.0.0:9270/metrics页面看到刚才配置的指标数据
常见问题:
1、指标名称不存在,但是指标TYPE存在。 --说明对应指标没有收集到内容,检查对应的指标类型跟指标名称是否有数据
2、指标名称不存在,指标TYPE也不存在 --说明对应的指标没有配置成功,需要结合jmeter报错日志进一步排查原因
3、指标名称存在,对应标签为null。–标签数据为null,说明没有取到标签的值,默认的指标名称,只有两个标签,label(取样器名称)跟code(hhtp状态码),如果是自己定义的指标标签为空,请确认标签获取到正确的值,并且成功更新指标
指标内容如下图

6、插件配置
要修改配置插件的配置,请在jmeter.properties文件(jmeter_HOME/bin文件夹)中添加properties,然后重新启动jmeter以使其生效
| Property | default | description |
|---|---|---|
| prometheus.port | 9270 | The port the http server will bind to |
| prometheus.ip | 127.0.0.1 | The ip the http server will bind to. Containers may need 0.0.0.0 |
| prometheus.delay | 0 | The delay (in seconds) the http server will wait before being destroyed |
| prometheus.save.threads | true | True or false value to save and collect jmeter thread metrics |
| prometheus.save.threads.name | jmeter_threads | The name of the metric describing jmeter threads |
| prometheus.save.jvm | true | Collect metrics from the JVM |
以下是具体的配置
# jmeter-prometheus-plugin插件配置 # http 服务器将绑定到的端口 prometheus.port=9270 # http 服务器将绑定到的 ip。容器可能需要0.0.0.0 prometheus.ip=0.0.0.0 # http 服务器在被销毁之前等待的延迟(以秒为单位) prometheus.delay=3 # 保存和收集 jmeter 线程指标的 True 或 false 值 prometheus.save.threads=true # 描述 jmeter 线程的指标名称 prometheus.save.threads.name=jmeter_threads # 从 JVM 收集指标 prometheus.save.jvm=true |
三、grafana添加prometheus数据源
添加数据源
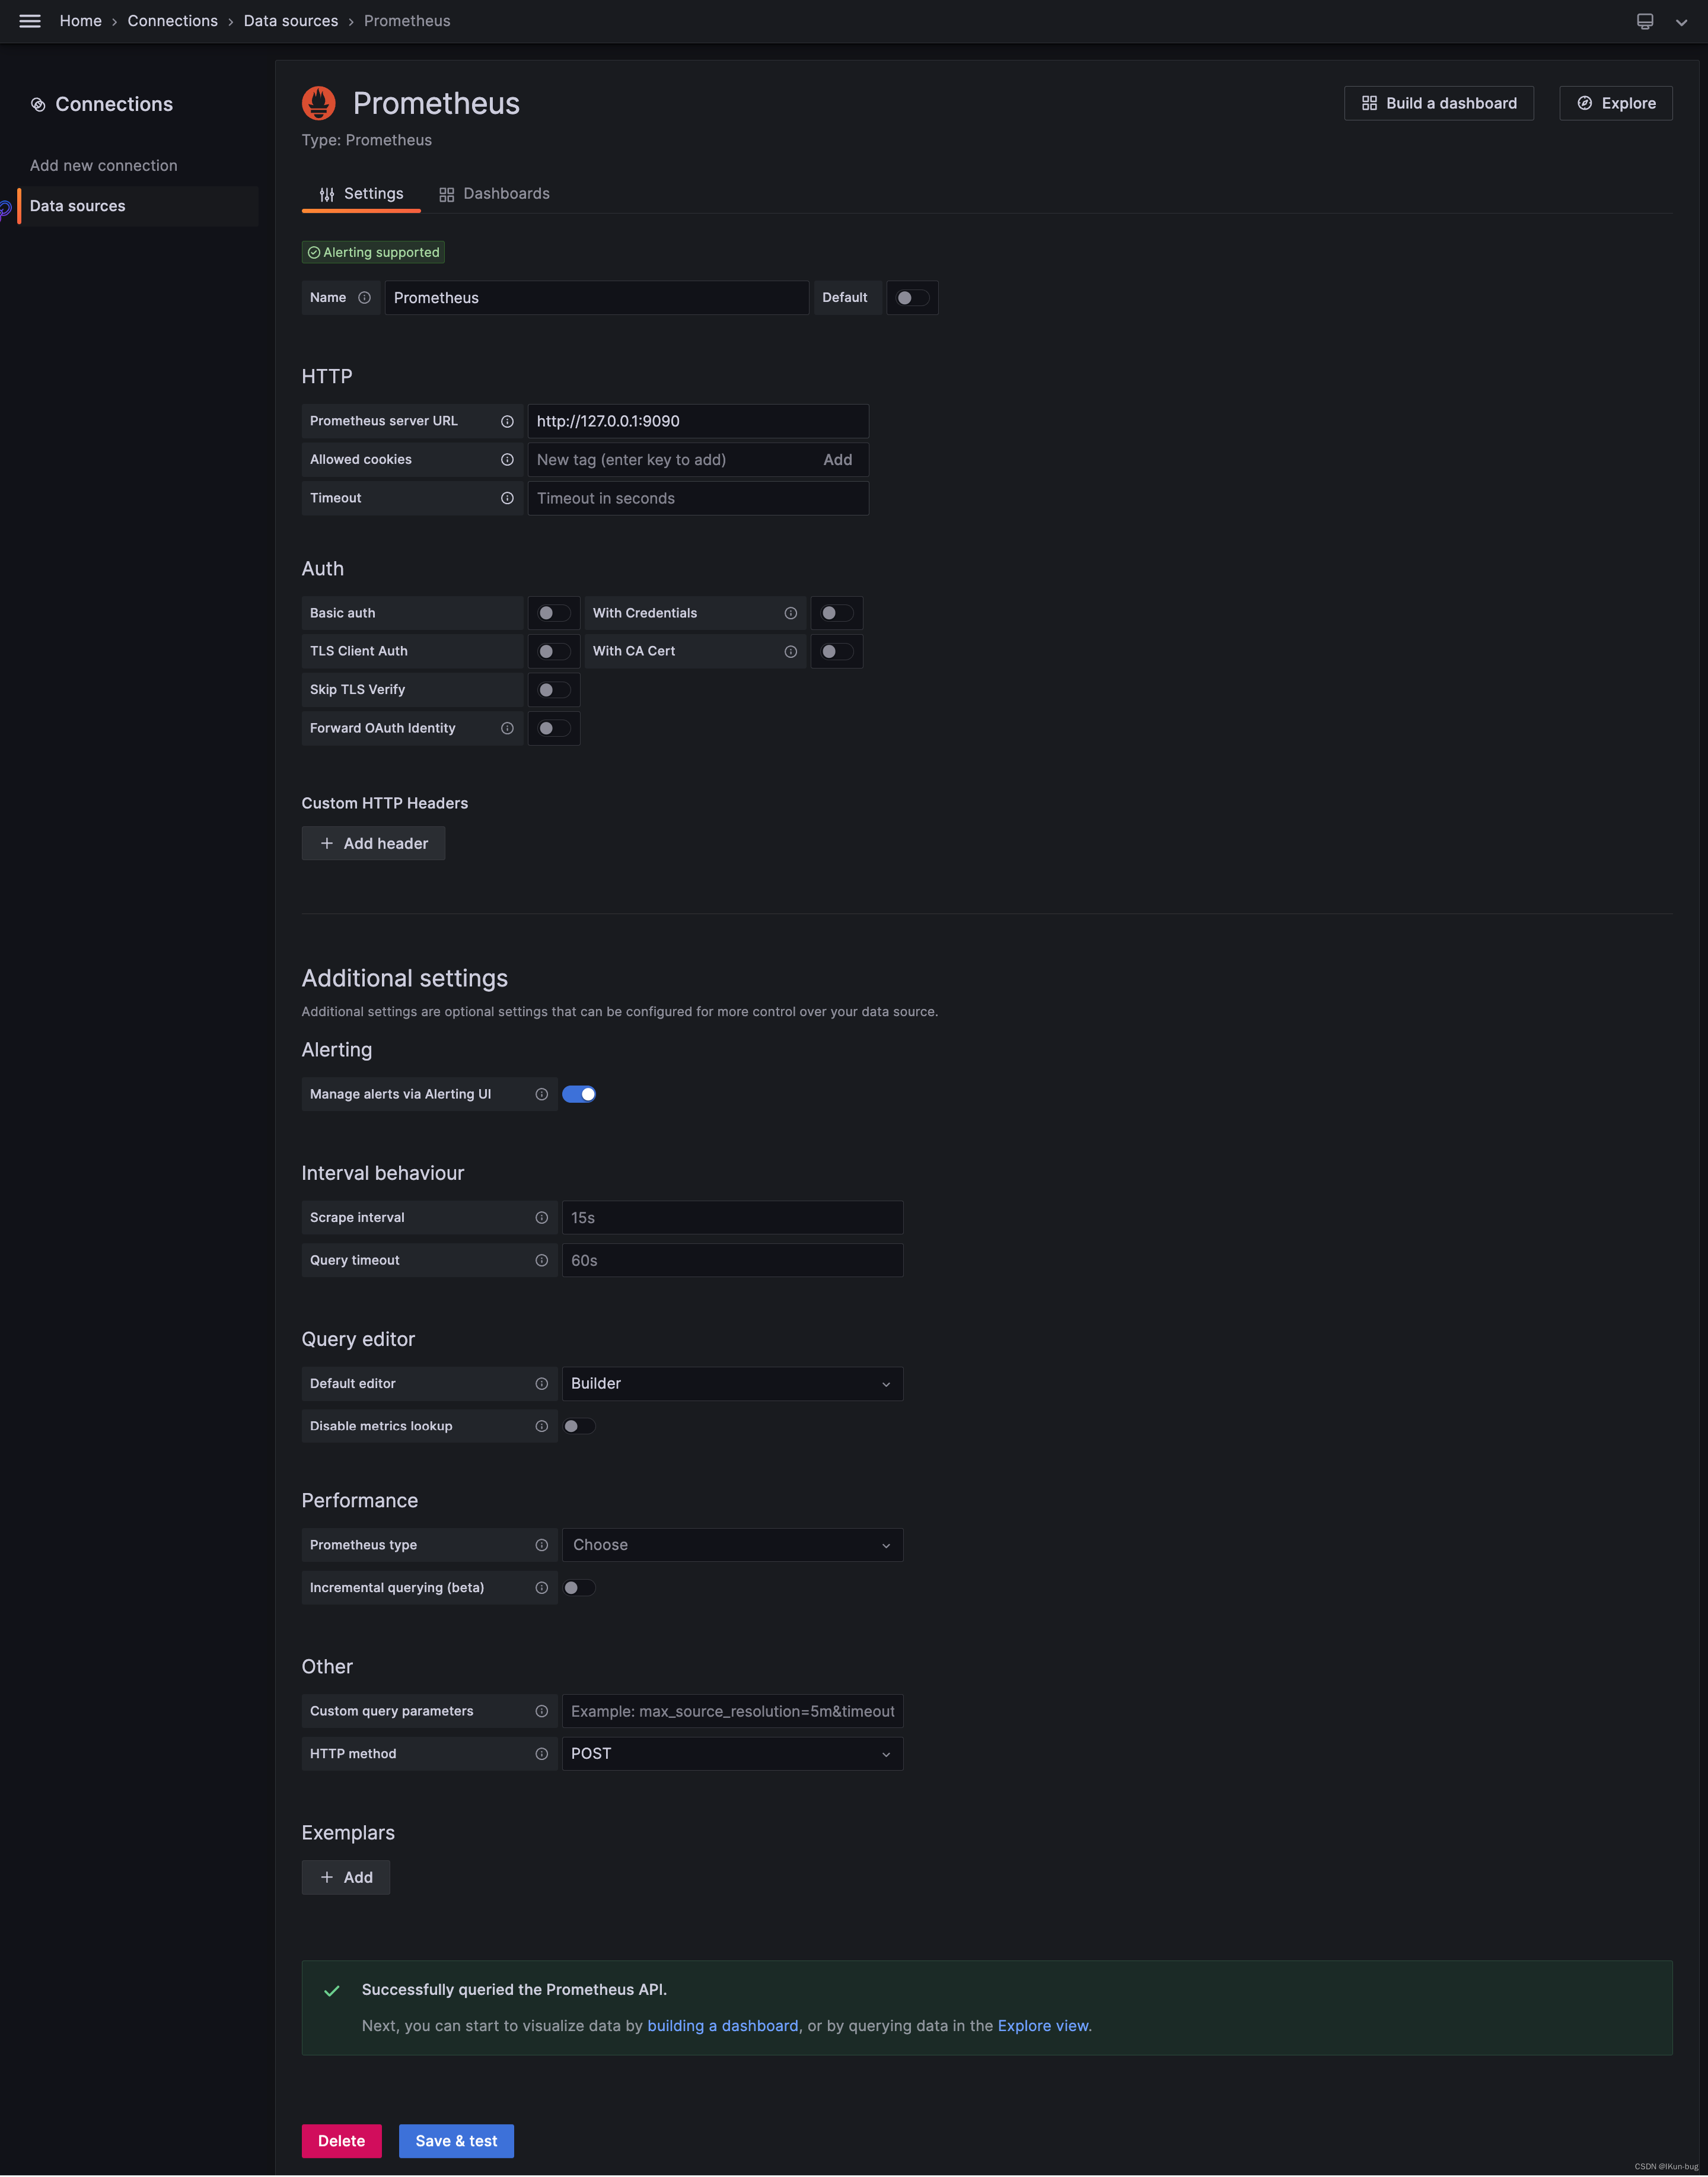
1、grafana找到Data sources-->Add new data source-->Prometheus
测试访问
2、填写数据库地址、端口号、账号密码等,点击Save & test,提示Successfully queried the Prometheus API,就是能够正常访问
四、配置grafana监控面板
官方面板配置
1、在grafana找到Dashboards-->New-->Import→2492
这里官方配置的面板ID为,2492
2、查看面板监控是否生效,具体监控图参考这个
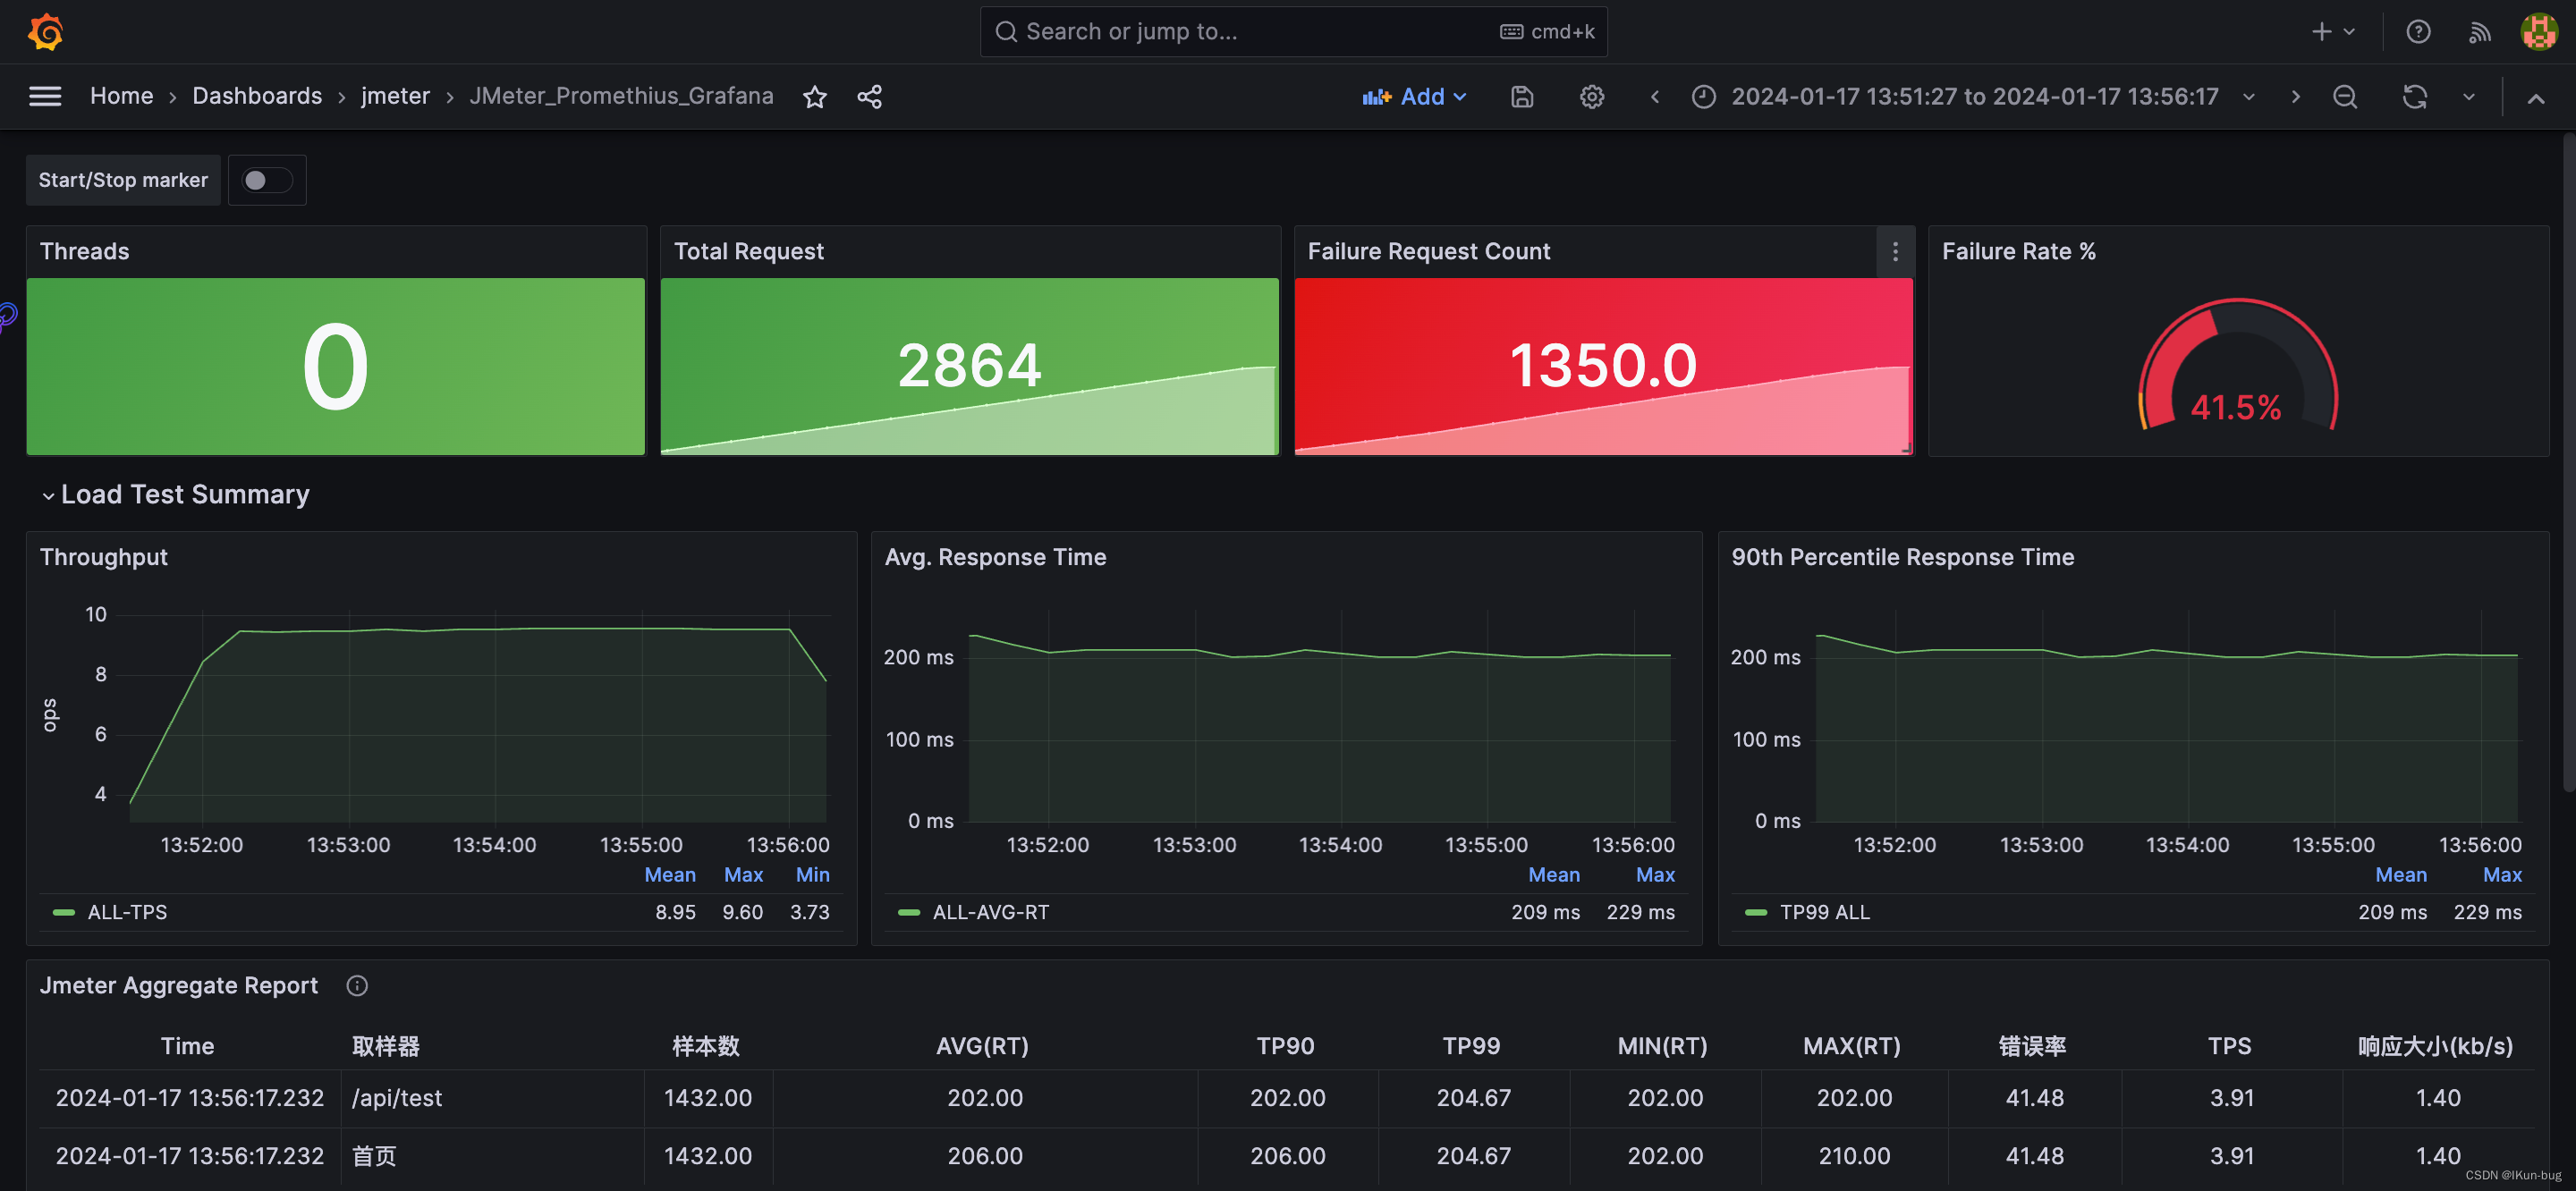
自定义面板配置
PS:官方的面板感觉有些指标是没生效的,我在它的基础上重新配置了一个面板
{
"annotations": {
"list": [
{
"builtIn": 1,
"datasource": {
"type": "datasource",
"uid": "grafana"
},
"enable": false,
"hide": true,
"iconColor": "rgba(0, 211, 255, 1)",
"name": "Annotations & Alerts",
"target": {
"limit": 100,
"matchAny": false,
"tags": [],
"type": "dashboard"
},
"type": "dashboard"
},
{
"datasource": {
"type": "prometheus",
"uid": "e592656e-dbb8-47b9-807f-fb74303af5c4"
},
"enable": false,
"expr": "jmeter_success_ratio_success",
"iconColor": "dark-blue",
"name": "Start/Stop marker",
"useValueForTime": false
}
]
},
"description": "A grafana dashboard to inspect jmeter metrics via prometheus ",
"editable": true,
"fiscalYearStartMonth": 0,
"gnetId": 14927,
"graphTooltip": 1,
"id": 22,
"links": [],
"liveNow": false,
"panels": [
{
"datasource": {
"type": "prometheus",
"uid": "e592656e-dbb8-47b9-807f-fb74303af5c4"
},
"fieldConfig": {
"defaults": {
"color": {
"mode": "thresholds"
},
"mappings": [
{
"options": {
"match": "null",
"result": {
"text": "N/A"
}
},
"type": "special"
}
],
"thresholds": {
"mode": "absolute",
"steps": [
{
"color": "green",
"value": null
},
{
"color": "red",
"value": 80
}
]
},
"unit": "none"
},
"overrides": []
},
"gridPos": {
"h": 4,
"w": 6,
"x": 0,
"y": 0
},
"id": 12,
"links": [],
"maxDataPoints": 100,
"options": {
"colorMode": "background",
"graphMode": "area",
"justifyMode": "center",
"orientation": "horizontal",
"reduceOptions": {
"calcs": [],
"fields": "",
"values": false
},
"text": {},
"textMode": "auto"
},
"pluginVersion": "10.0.3",
"targets": [
{
"datasource": {
"type": "prometheus",
"uid": "e592656e-dbb8-47b9-807f-fb74303af5c4"
},
"editorMode": "code",
"exemplar": true,
"expr": "sum(jmeter_threads{state=\"active\"})",
"format": "time_series",
"hide": false,
"instant": true,
"interval": "",
"intervalFactor": 1,
"legendFormat": "",
"refId": "A",
"step": 4
}
],
"title": "Threads",
"type": "stat"
},
{
"datasource": {
"type": "prometheus",
"uid": "e592656e-dbb8-47b9-807f-fb74303af5c4"
},
"fieldConfig": {
"defaults": {
"color": {
"mode": "thresholds"
},
"decimals": 0,
"mappings": [
{
"options": {
"match": "null",
"result": {
"text": "N/A"
}
},
"type": "special"
}
],
"thresholds": {
"mode": "absolute",
"steps": [
{
"color": "green",
"value": null
}
]
},
"unit": "none"
},
"overrides": []
},
"gridPos": {
"h": 4,
"w": 6,
"x": 6,
"y": 0
},
"id": 7,
"links": [],
"maxDataPoints": 100,
"options": {
"colorMode": "background",
"graphMode": "area",
"justifyMode": "center",
"orientation": "horizontal",
"reduceOptions": {
"calcs": [],
"fields": "",
"values": false
},
"text": {},
"textMode": "auto"
},
"pluginVersion": "10.0.3",
"targets": [
{
"datasource": {
"type": "prometheus",
"uid": "e592656e-dbb8-47b9-807f-fb74303af5c4"
},
"editorMode": "code",
"exemplar": true,
"expr": "sum(jmeter_count_total{})",
"format": "time_series",
"instant": false,
"interval": "",
"intervalFactor": 1,
"legendFormat": "",
"refId": "E"
}
],
"title": "Total Request ",
"type": "stat"
},
{
"datasource": {
"type": "prometheus",
"uid": "e592656e-dbb8-47b9-807f-fb74303af5c4"
},
"fieldConfig": {
"defaults": {
"color": {
"mode": "thresholds"
},
"decimals": 1,
"mappings": [
{
"options": {
"match": "null",
"result": {
"text": "N/A"
}
},
"type": "special"
}
],
"thresholds": {
"mode": "absolute",
"steps": [
{
"color": "green",
"value": null
},
{
"color": "red",
"value": 1
}
]
},
"unit": "none"
},
"overrides": []
},
"gridPos": {
"h": 4,
"w": 6,
"x": 12,
"y": 0
},
"id": 14,
"links": [],
"maxDataPoints": 100,
"options": {
"colorMode": "background",
"graphMode": "area",
"justifyMode": "center",
"orientation": "horizontal",
"reduceOptions": {
"calcs": [],
"fields": "",
"values": false
},
"text": {},
"textMode": "auto"
},
"pluginVersion": "10.0.3",
"targets": [
{
"datasource": {
"type": "prometheus",
"uid": "e592656e-dbb8-47b9-807f-fb74303af5c4"
},
"editorMode": "code",
"exemplar": true,
"expr": "sum(jmeter_failure_total)",
"format": "time_series",
"hide": false,
"instant": false,
"interval": "",
"intervalFactor": 1,
"legendFormat": "__auto",
"metric": "",
"refId": "A",
"step": 4
}
],
"title": "Failure Request Count",
"type": "stat"
},
{
"datasource": {
"type": "prometheus",
"uid": "e592656e-dbb8-47b9-807f-fb74303af5c4"
},
"fieldConfig": {
"defaults": {
"color": {
"mode": "thresholds"
},
"decimals": 1,
"mappings": [
{
"options": {
"match": "null",
"result": {
"text": "N/A"
}
},
"type": "special"
}
],
"thresholds": {
"mode": "percentage",
"steps": [
{
"color": "#37872D",
"value": null
},
{
"color": "#FF9830",
"value": 0.1
},
{
"color": "#E02F44",
"value": 10
}
]
},
"unit": "percentunit"
},
"overrides": []
},
"gridPos": {
"h": 4,
"w": 6,
"x": 18,
"y": 0
},
"id": 8,
"links": [],
"maxDataPoints": 100,
"options": {
"orientation": "horizontal",
"reduceOptions": {
"calcs": [],
"fields": "",
"values": false
},
"showThresholdLabels": false,
"showThresholdMarkers": true,
"text": {}
},
"pluginVersion": "10.0.3",
"targets": [
{
"datasource": {
"type": "prometheus",
"uid": "e592656e-dbb8-47b9-807f-fb74303af5c4"
},
"editorMode": "code",
"exemplar": true,
"expr": "(sum(rate(jmeter_failure_total[$__rate_interval]))/sum(rate(jmeter_count_total[$__rate_interval])))",
"format": "time_series",
"instant": false,
"interval": "",
"intervalFactor": 1,
"legendFormat": "",
"range": true,
"refId": "A",
"step": 4
}
],
"title": "Failure Rate %",
"type": "gauge"
},
{
"collapsed": false,
"datasource": {
"type": "influxdb",
"uid": "e18c3112-795a-412c-926c-982c2e078ad2"
},
"gridPos": {
"h": 1,
"w": 24,
"x": 0,
"y": 4
},
"id": 17,
"panels": [],
"targets": [
{
"datasource": {
"type": "influxdb",
"uid": "e18c3112-795a-412c-926c-982c2e078ad2"
},
"refId": "A"
}
],
"title": "Load Test Summary",
"type": "row"
},
{
"datasource": {
"type": "prometheus",
"uid": "e592656e-dbb8-47b9-807f-fb74303af5c4"
},
"description": "",
"fieldConfig": {
"defaults": {
"color": {
"mode": "palette-classic"
},
"custom": {
"axisCenteredZero": false,
"axisColorMode": "text",
"axisLabel": "ops",
"axisPlacement": "auto",
"barAlignment": 0,
"drawStyle": "line",
"fillOpacity": 10,
"gradientMode": "none",
"hideFrom": {
"legend": false,
"tooltip": false,
"viz": false
},
"lineInterpolation": "linear",
"lineWidth": 1,
"pointSize": 5,
"scaleDistribution": {
"type": "linear"
},
"showPoints": "never",
"spanNulls": false,
"stacking": {
"group": "A",
"mode": "none"
},
"thresholdsStyle": {
"mode": "off"
}
},
"links": [],
"mappings": [],
"thresholds": {
"mode": "absolute",
"steps": [
{
"color": "green",
"value": null
},
{
"color": "red",
"value": 80
}
]
},
"unit": "none"
},
"overrides": [
{
"matcher": {
"id": "byName",
"options": "Failure "
},
"properties": [
{
"id": "color",
"value": {
"fixedColor": "#bf1b00",
"mode": "fixed"
}
}
]
},
{
"matcher": {
"id": "byName",
"options": "OK"
},
"properties": [
{
"id": "color",
"value": {
"fixedColor": "dark-green",
"mode": "fixed"
}
}
]
},
{
"matcher": {
"id": "byName",
"options": "Virtual Users"
},
"properties": [
{
"id": "color",
"value": {
"fixedColor": "#3274D9",
"mode": "fixed"
}
},
{
"id": "custom.fillOpacity",
"value": 40
},
{
"id": "custom.lineWidth",
"value": 0
},
{
"id": "custom.lineWidth",
"value": 3
},
{
"id": "unit",
"value": "short"
},
{
"id": "custom.axisPlacement",
"value": "hidden"
},
{
"id": "custom.axisLabel",
"value": "VU"
}
]
},
{
"matcher": {
"id": "byName",
"options": "Request OK per second"
},
"properties": [
{
"id": "color",
"value": {
"fixedColor": "#19730E",
"mode": "fixed"
}
}
]
},
{
"matcher": {
"id": "byName",
"options": "Request KO per second"
},
"properties": [
{
"id": "color",
"value": {
"fixedColor": "#AD0317",
"mode": "fixed"
}
}
]
}
]
},
"gridPos": {
"h": 7,
"w": 8,
"x": 0,
"y": 5
},
"id": 36,
"links": [],
"options": {
"legend": {
"calcs": [
"mean",
"max",
"min"
],
"displayMode": "table",
"placement": "bottom",
"showLegend": true
},
"tooltip": {
"mode": "multi",
"sort": "none"
}
},
"pluginVersion": "10.0.3",
"targets": [
{
"datasource": {
"type": "prometheus",
"uid": "e592656e-dbb8-47b9-807f-fb74303af5c4"
},
"editorMode": "code",
"exemplar": false,
"expr": "sum(rate(jmeter_count_total[$__rate_interval]))",
"instant": false,
"interval": "",
"legendFormat": "ALL-TPS",
"range": true,
"refId": "C"
}
],
"title": "Throughput",
"type": "timeseries"
},
{
"datasource": {
"type": "prometheus",
"uid": "e592656e-dbb8-47b9-807f-fb74303af5c4"
},
"description": "",
"fieldConfig": {
"defaults": {
"color": {
"mode": "palette-classic"
},
"custom": {
"axisCenteredZero": false,
"axisColorMode": "text",
"axisLabel": "",
"axisPlacement": "auto",
"barAlignment": 0,
"drawStyle": "line",
"fillOpacity": 10,
"gradientMode": "none",
"hideFrom": {
"legend": false,
"tooltip": false,
"viz": false
},
"lineInterpolation": "linear",
"lineWidth": 1,
"pointSize": 5,
"scaleDistribution": {
"type": "linear"
},
"showPoints": "never",
"spanNulls": false,
"stacking": {
"group": "A",
"mode": "none"
},
"thresholdsStyle": {
"mode": "off"
}
},
"links": [],
"mappings": [],
"min": 0,
"thresholds": {
"mode": "absolute",
"steps": [
{
"color": "green",
"value": null
},
{
"color": "red",
"value": 80
}
]
},
"unit": "ms"
},
"overrides": [
{
"matcher": {
"id": "byName",
"options": "Failure "
},
"properties": [
{
"id": "color",
"value": {
"fixedColor": "#bf1b00",
"mode": "fixed"
}
}
]
},
{
"matcher": {
"id": "byName",
"options": "OK"
},
"properties": [
{
"id": "color",
"value": {
"fixedColor": "#19730E",
"mode": "fixed"
}
},
{
"id": "unit",
"value": "short"
},
{
"id": "custom.axisPlacement",
"value": "hidden"
},
{
"id": "custom.axisLabel",
"value": "ops"
}
]
},
{
"matcher": {
"id": "byName",
"options": "Avg Response Time"
},
"properties": [
{
"id": "color",
"value": {
"fixedColor": "#F2CC0C",
"mode": "fixed"
}
}
]
},
{
"matcher": {
"id": "byName",
"options": "KO"
},
"properties": [
{
"id": "color",
"value": {
"fixedColor": "#AD0317",
"mode": "fixed"
}
},
{
"id": "unit",
"value": "short"
},
{
"id": "custom.axisPlacement",
"value": "hidden"
},
{
"id": "custom.axisLabel",
"value": "ops"
}
]
}
]
},
"gridPos": {
"h": 7,
"w": 8,
"x": 8,
"y": 5
},
"id": 29,
"links": [],
"options": {
"legend": {
"calcs": [
"mean",
"max"
],
"displayMode": "table",
"placement": "bottom",
"showLegend": true
},
"tooltip": {
"mode": "multi",
"sort": "none"
}
},
"pluginVersion": "10.0.3",
"targets": [
{
"datasource": {
"type": "prometheus",
"uid": "e592656e-dbb8-47b9-807f-fb74303af5c4"
},
"editorMode": "code",
"exemplar": true,
"expr": "avg(jmeter_summary{})",
"format": "time_series",
"hide": false,
"instant": false,
"interval": "",
"intervalFactor": 1,
"legendFormat": "ALL-AVG-RT",
"refId": "B",
"step": 1
}
],
"title": "Avg. Response Time ",
"type": "timeseries"
},
{
"datasource": {
"type": "prometheus",
"uid": "e592656e-dbb8-47b9-807f-fb74303af5c4"
},
"description": "",
"fieldConfig": {
"defaults": {
"color": {
"mode": "palette-classic"
},
"custom": {
"axisCenteredZero": false,
"axisColorMode": "text",
"axisLabel": "",
"axisPlacement": "auto",
"barAlignment": 0,
"drawStyle": "line",
"fillOpacity": 10,
"gradientMode": "none",
"hideFrom": {
"legend": false,
"tooltip": false,
"viz": false
},
"lineInterpolation": "linear",
"lineWidth": 1,
"pointSize": 5,
"scaleDistribution": {
"type": "linear"
},
"showPoints": "never",
"spanNulls": false,
"stacking": {
"group": "A",
"mode": "none"
},
"thresholdsStyle": {
"mode": "off"
}
},
"links": [],
"mappings": [],
"min": 0,
"thresholds": {
"mode": "absolute",
"steps": [
{
"color": "green",
"value": null
},
{
"color": "red",
"value": 80
}
]
},
"unit": "ms"
},
"overrides": [
{
"matcher": {
"id": "byName",
"options": "Failure "
},
"properties": [
{
"id": "color",
"value": {
"fixedColor": "#bf1b00",
"mode": "fixed"
}
}
]
},
{
"matcher": {
"id": "byName",
"options": "OK"
},
"properties": [
{
"id": "color",
"value": {
"fixedColor": "#19730E",
"mode": "fixed"
}
},
{
"id": "unit",
"value": "short"
},
{
"id": "custom.axisPlacement",
"value": "hidden"
},
{
"id": "custom.axisLabel",
"value": "ops"
}
]
},
{
"matcher": {
"id": "byName",
"options": "Avg Response Time"
},
"properties": [
{
"id": "color",
"value": {
"fixedColor": "#F2CC0C",
"mode": "fixed"
}
}
]
},
{
"matcher": {
"id": "byName",
"options": "KO"
},
"properties": [
{
"id": "color",
"value": {
"fixedColor": "#AD0317",
"mode": "fixed"
}
},
{
"id": "unit",
"value": "short"
},
{
"id": "custom.axisPlacement",
"value": "hidden"
},
{
"id": "custom.axisLabel",
"value": "ops"
}
]
},
{
"matcher": {
"id": "byValue",
"options": {
"op": "gte",
"reducer": "allIsZero",
"value": 0
}
},
"properties": [
{
"id": "custom.hideFrom",
"value": {
"legend": true,
"tooltip": true,
"viz": false
}
}
]
},
{
"matcher": {
"id": "byValue",
"options": {
"op": "gte",
"reducer": "allIsNull",
"value": 0
}
},
"properties": [
{
"id": "custom.hideFrom",
"value": {
"legend": true,
"tooltip": true,
"viz": false
}
}
]
}
]
},
"gridPos": {
"h": 7,
"w": 8,
"x": 16,
"y": 5
},
"id": 37,
"links": [],
"options": {
"legend": {
"calcs": [
"mean",
"max"
],
"displayMode": "table",
"placement": "bottom",
"showLegend": true
},
"tooltip": {
"mode": "multi",
"sort": "none"
}
},
"pluginVersion": "10.0.3",
"targets": [
{
"datasource": {
"type": "prometheus",
"uid": "e592656e-dbb8-47b9-807f-fb74303af5c4"
},
"editorMode": "code",
"exemplar": true,
"expr": "avg(jmeter_summary{quantile=\"0.9\"})",
"format": "time_series",
"hide": false,
"instant": false,
"interval": "",
"intervalFactor": 1,
"legendFormat": "TP99 ALL",
"refId": "B",
"step": 1
}
],
"title": "90th Percentile Response Time ",
"type": "timeseries"
},
{
"datasource": {
"type": "prometheus",
"uid": "e592656e-dbb8-47b9-807f-fb74303af5c4"
},
"description": "jmeter聚合报告",
"fieldConfig": {
"defaults": {
"color": {
"mode": "fixed"
},
"custom": {
"align": "center",
"cellOptions": {
"type": "auto"
},
"inspect": false
},
"decimals": 2,
"displayName": "",
"mappings": [],
"max": 0,
"thresholds": {
"mode": "absolute",
"steps": [
{
"color": "green",
"value": null
}
]
},
"unit": "none"
},
"overrides": [
{
"matcher": {
"id": "byName",
"options": "label"
},
"properties": [
{
"id": "unit",
"value": "short"
},
{
"id": "decimals",
"value": 2
},
{
"id": "custom.align"
},
{
"id": "displayName",
"value": "取样器"
}
]
},
{
"matcher": {
"id": "byName",
"options": "Value #Samples"
},
"properties": [
{
"id": "custom.width",
"value": 80
},
{
"id": "displayName",
"value": "样本数"
}
]
},
{
"matcher": {
"id": "byName",
"options": "Value #Average Response Time"
},
"properties": [
{
"id": "custom.width",
"value": 264
},
{
"id": "displayName",
"value": "AVG(RT)"
}
]
},
{
"matcher": {
"id": "byName",
"options": "Value #90% Line"
},
"properties": [
{
"id": "custom.width",
"value": 112
},
{
"id": "displayName",
"value": "TP90"
}
]
},
{
"matcher": {
"id": "byName",
"options": "Value #99% Line"
},
"properties": [
{
"id": "custom.width",
"value": 119
},
{
"id": "displayName",
"value": "TP99"
}
]
},
{
"matcher": {
"id": "byName",
"options": "Value #Min"
},
"properties": [
{
"id": "custom.width",
"value": 119
},
{
"id": "displayName",
"value": "MIN(RT)"
}
]
},
{
"matcher": {
"id": "byName",
"options": "Value #Maximum"
},
"properties": [
{
"id": "custom.width",
"value": 116
},
{
"id": "displayName",
"value": "MAX(RT)"
}
]
},
{
"matcher": {
"id": "byName",
"options": "Value #% Error"
},
"properties": [
{
"id": "custom.width",
"value": 108
},
{
"id": "displayName",
"value": "错误率"
}
]
},
{
"matcher": {
"id": "byName",
"options": "Value #Throughput"
},
"properties": [
{
"id": "custom.width",
"value": 90
},
{
"id": "displayName",
"value": "TPS"
}
]
},
{
"matcher": {
"id": "byName",
"options": "Value #Transmitted Kb/sec"
},
"properties": [
{
"id": "custom.width",
"value": 119
},
{
"id": "displayName",
"value": "响应大小(kb/s)"
}
]
},
{
"matcher": {
"id": "byName",
"options": "Value #Throughput"
},
"properties": [
{
"id": "custom.width",
"value": 137
}
]
}
]
},
"gridPos": {
"h": 5,
"w": 24,
"x": 0,
"y": 12
},
"id": 33,
"links": [],
"options": {
"cellHeight": "sm",
"footer": {
"countRows": false,
"fields": "",
"reducer": [
"sum"
],
"show": false
},
"showHeader": true,
"sortBy": [
{
"desc": true,
"displayName": "Value #99% Line"
}
]
},
"pluginVersion": "10.0.3",
"targets": [
{
"datasource": {
"type": "prometheus",
"uid": "e592656e-dbb8-47b9-807f-fb74303af5c4"
},
"editorMode": "code",
"exemplar": false,
"expr": "sum(jmeter_count_total) by (label)",
"format": "table",
"instant": true,
"interval": "",
"intervalFactor": 1,
"legendFormat": "",
"range": false,
"refId": "Samples"
},
{
"datasource": {
"type": "prometheus",
"uid": "e592656e-dbb8-47b9-807f-fb74303af5c4"
},
"editorMode": "code",
"exemplar": true,
"expr": "avg(jmeter_summary{}) by (label)",
"format": "table",
"hide": false,
"instant": true,
"interval": "",
"legendFormat": "",
"refId": "Average Response Time"
},
{
"datasource": {
"type": "prometheus",
"uid": "e592656e-dbb8-47b9-807f-fb74303af5c4"
},
"exemplar": true,
"expr": "avg(jmeter_summary{quantile=\"0.9\"}) by (label)",
"format": "table",
"hide": false,
"instant": true,
"interval": "",
"legendFormat": "",
"refId": "90% Line"
},
{
"datasource": {
"type": "prometheus",
"uid": "e592656e-dbb8-47b9-807f-fb74303af5c4"
},
"exemplar": true,
"expr": "avg(jmeter_summary{quantile=\"0.95\"}) by (label)",
"format": "table",
"hide": false,
"instant": true,
"interval": "",
"legendFormat": "",
"refId": "95% Line"
},
{
"datasource": {
"type": "prometheus",
"uid": "e592656e-dbb8-47b9-807f-fb74303af5c4"
},
"exemplar": true,
"expr": "avg(jmeter_summary{quantile=\"0.99\"})",
"format": "table",
"hide": false,
"instant": true,
"interval": "",
"legendFormat": "",
"refId": "99% Line"
},
{
"datasource": {
"type": "prometheus",
"uid": "e592656e-dbb8-47b9-807f-fb74303af5c4"
},
"editorMode": "code",
"exemplar": true,
"expr": "min(jmeter_summary{}) by (label)",
"format": "table",
"hide": false,
"instant": true,
"interval": "",
"legendFormat": "",
"refId": "Min"
},
{
"datasource": {
"type": "prometheus",
"uid": "e592656e-dbb8-47b9-807f-fb74303af5c4"
},
"editorMode": "code",
"exemplar": true,
"expr": "max(jmeter_summary{}) by (label)",
"format": "table",
"hide": false,
"instant": true,
"interval": "",
"legendFormat": "",
"refId": "Maximum"
},
{
"datasource": {
"type": "prometheus",
"uid": "e592656e-dbb8-47b9-807f-fb74303af5c4"
},
"editorMode": "code",
"exemplar": false,
"expr": "(sum(rate(jmeter_failure_total[$__rate_interval]))/sum(rate(jmeter_count_total[$__rate_interval]))) * 100",
"format": "table",
"hide": false,
"instant": true,
"interval": "",
"legendFormat": "{{label}}",
"range": false,
"refId": "% Error"
},
{
"datasource": {
"type": "prometheus",
"uid": "e592656e-dbb8-47b9-807f-fb74303af5c4"
},
"editorMode": "code",
"exemplar": true,
"expr": "sum(rate(jmeter_count_total[$__rate_interval])) by (label)",
"format": "table",
"hide": false,
"instant": true,
"interval": "",
"legendFormat": "",
"refId": "Throughput"
},
{
"datasource": {
"type": "prometheus",
"uid": "e592656e-dbb8-47b9-807f-fb74303af5c4"
},
"editorMode": "code",
"exemplar": true,
"expr": "avg(jmeter_rsize_sum{}/1024) by (label)",
"format": "table",
"hide": false,
"instant": true,
"interval": "",
"legendFormat": "",
"refId": "Received Kb/sec"
},
{
"datasource": {
"type": "prometheus",
"uid": "e592656e-dbb8-47b9-807f-fb74303af5c4"
},
"editorMode": "code",
"exemplar": true,
"expr": "avg(jmeter_response_rsize_count{}/1024) by (label)",
"format": "table",
"hide": false,
"instant": true,
"interval": "",
"legendFormat": "",
"refId": "Transmitted Kb/sec"
}
],
"title": "Jmeter Aggregate Report",
"transformations": [
{
"id": "merge",
"options": {
"reducers": []
}
}
],
"type": "table"
},
{
"datasource": {
"type": "prometheus",
"uid": "e592656e-dbb8-47b9-807f-fb74303af5c4"
},
"fieldConfig": {
"defaults": {
"color": {
"mode": "thresholds"
},
"custom": {
"align": "auto",
"cellOptions": {
"type": "auto"
},
"inspect": false
},
"decimals": 2,
"displayName": "",
"mappings": [],
"thresholds": {
"mode": "absolute",
"steps": [
{
"color": "green",
"value": null
},
{
"color": "red",
"value": 80
}
]
},
"unit": "short"
},
"overrides": [
{
"matcher": {
"id": "byName",
"options": "Time"
},
"properties": [
{
"id": "displayName",
"value": "Time"
},
{
"id": "custom.align"
}
]
},
{
"matcher": {
"id": "byName",
"options": "label"
},
"properties": [
{
"id": "displayName",
"value": "Label"
},
{
"id": "unit",
"value": "short"
},
{
"id": "decimals",
"value": 2
},
{
"id": "custom.align"
}
]
},
{
"matcher": {
"id": "byName",
"options": "Value"
},
"properties": [
{
"id": "displayName",
"value": "Count"
},
{
"id": "unit",
"value": "none"
},
{
"id": "custom.align"
},
{
"id": "thresholds",
"value": {
"mode": "absolute",
"steps": [
{
"color": "rgba(245, 54, 54, 0.9)",
"value": null
},
{
"color": "rgba(237, 129, 40, 0.89)"
}
]
}
}
]
}
]
},
"gridPos": {
"h": 5,
"w": 24,
"x": 0,
"y": 17
},
"id": 34,
"links": [],
"options": {
"cellHeight": "sm",
"footer": {
"countRows": false,
"fields": "",
"reducer": [
"sum"
],
"show": false
},
"showHeader": true
},
"pluginVersion": "10.0.3",
"targets": [
{
"datasource": {
"type": "prometheus",
"uid": "e592656e-dbb8-47b9-807f-fb74303af5c4"
},
"editorMode": "code",
"exemplar": true,
"expr": "sum(jmeter_failure_total) by (label)",
"format": "table",
"instant": true,
"interval": "",
"intervalFactor": 1,
"legendFormat": "",
"refId": "A"
}
],
"title": "Failure Request Details",
"transformations": [
{
"id": "merge",
"options": {
"reducers": []
}
}
],
"type": "table"
},
{
"collapsed": true,
"datasource": {
"type": "influxdb",
"uid": "e18c3112-795a-412c-926c-982c2e078ad2"
},
"gridPos": {
"h": 1,
"w": 24,
"x": 0,
"y": 22
},
"id": 18,
"panels": [
{
"datasource": {
"type": "prometheus",
"uid": "e592656e-dbb8-47b9-807f-fb74303af5c4"
},
"description": "",
"fieldConfig": {
"defaults": {
"color": {
"mode": "palette-classic"
},
"custom": {
"axisCenteredZero": false,
"axisColorMode": "text",
"axisLabel": "",
"axisPlacement": "auto",
"barAlignment": 0,
"drawStyle": "line",
"fillOpacity": 10,
"gradientMode": "none",
"hideFrom": {
"legend": false,
"tooltip": false,
"viz": false
},
"lineInterpolation": "linear",
"lineWidth": 2,
"pointSize": 5,
"scaleDistribution": {
"type": "linear"
},
"showPoints": "never",
"spanNulls": false,
"stacking": {
"group": "A",
"mode": "none"
},
"thresholdsStyle": {
"mode": "off"
}
},
"links": [],
"mappings": [],
"thresholds": {
"mode": "absolute",
"steps": [
{
"color": "green",
"value": null
},
{
"color": "red",
"value": 80
}
]
},
"unit": "ms"
},
"overrides": [
{
"matcher": {
"id": "byName",
"options": "avg jmeter"
},
"properties": [
{
"id": "color",
"value": {
"fixedColor": "light-green",
"mode": "fixed"
}
}
]
},
{
"matcher": {
"id": "byValue",
"options": {
"op": "gte",
"reducer": "allIsZero",
"value": 0
}
},
"properties": [
{
"id": "custom.hideFrom",
"value": {
"legend": true,
"tooltip": true,
"viz": false
}
}
]
},
{
"matcher": {
"id": "byValue",
"options": {
"op": "gte",
"reducer": "allIsNull",
"value": 0
}
},
"properties": [
{
"id": "custom.hideFrom",
"value": {
"legend": true,
"tooltip": true,
"viz": false
}
}
]
}
]
},
"gridPos": {
"h": 6,
"w": 12,
"x": 0,
"y": 6
},
"id": 35,
"links": [],
"options": {
"legend": {
"calcs": [
"mean",
"max",
"min"
],
"displayMode": "table",
"placement": "bottom",
"showLegend": true
},
"tooltip": {
"mode": "multi",
"sort": "none"
}
},
"pluginVersion": "10.0.3",
"targets": [
{
"datasource": {
"type": "prometheus",
"uid": "e592656e-dbb8-47b9-807f-fb74303af5c4"
},
"editorMode": "code",
"exemplar": true,
"expr": "avg(jmeter_summary{}) by (label)",
"format": "time_series",
"hide": false,
"instant": false,
"interval": "",
"intervalFactor": 1,
"legendFormat": "AVG path={{label}}",
"refId": "A",
"step": 1
},
{
"datasource": {
"type": "prometheus",
"uid": "e592656e-dbb8-47b9-807f-fb74303af5c4"
},
"editorMode": "code",
"expr": "max(jmeter_summary{}) by (label)",
"hide": false,
"instant": false,
"legendFormat": "MAX path={{label}}",
"range": true,
"refId": "B"
}
],
"title": "Avg-max. response time",
"type": "timeseries"
},
{
"datasource": {
"type": "prometheus",
"uid": "e592656e-dbb8-47b9-807f-fb74303af5c4"
},
"description": "",
"fieldConfig": {
"defaults": {
"color": {
"mode": "palette-classic"
},
"custom": {
"axisCenteredZero": false,
"axisColorMode": "text",
"axisLabel": "",
"axisPlacement": "auto",
"barAlignment": 0,
"drawStyle": "line",
"fillOpacity": 10,
"gradientMode": "none",
"hideFrom": {
"legend": false,
"tooltip": false,
"viz": false
},
"lineInterpolation": "linear",
"lineWidth": 2,
"pointSize": 5,
"scaleDistribution": {
"type": "linear"
},
"showPoints": "never",
"spanNulls": false,
"stacking": {
"group": "A",
"mode": "none"
},
"thresholdsStyle": {
"mode": "line+area"
}
},
"links": [],
"mappings": [],
"thresholds": {
"mode": "absolute",
"steps": [
{
"color": "transparent",
"value": null
},
{
"color": "orange",
"value": 1000
}
]
},
"unit": "ms"
},
"overrides": [
{
"matcher": {
"id": "byValue",
"options": {
"op": "gte",
"reducer": "allIsZero",
"value": 0
}
},
"properties": [
{
"id": "custom.hideFrom",
"value": {
"legend": true,
"tooltip": true,
"viz": false
}
}
]
},
{
"matcher": {
"id": "byValue",
"options": {
"op": "gte",
"reducer": "allIsNull",
"value": 0
}
},
"properties": [
{
"id": "custom.hideFrom",
"value": {
"legend": true,
"tooltip": true,
"viz": false
}
}
]
}
]
},
"gridPos": {
"h": 6,
"w": 12,
"x": 12,
"y": 6
},
"id": 13,
"links": [],
"options": {
"legend": {
"calcs": [
"mean",
"max"
],
"displayMode": "table",
"placement": "bottom",
"showLegend": true,
"sortBy": "Max",
"sortDesc": true
},
"tooltip": {
"mode": "multi",
"sort": "none"
}
},
"pluginVersion": "10.0.3",
"targets": [
{
"datasource": {
"type": "prometheus",
"uid": "e592656e-dbb8-47b9-807f-fb74303af5c4"
},
"editorMode": "code",
"exemplar": true,
"expr": "avg(jmeter_summary{quantile=\"0.9\"}) by (label)",
"format": "time_series",
"hide": false,
"interval": "",
"intervalFactor": 1,
"legendFormat": "TP90 path={{label}}",
"range": true,
"refId": "B",
"step": 1
},
{
"datasource": {
"type": "prometheus",
"uid": "e592656e-dbb8-47b9-807f-fb74303af5c4"
},
"editorMode": "code",
"expr": "avg(jmeter_summary{quantile=\"0.99\"}) by (label)",
"hide": false,
"instant": false,
"legendFormat": "TP99 path={{label}}",
"range": true,
"refId": "A"
},
{
"datasource": {
"type": "prometheus",
"uid": "e592656e-dbb8-47b9-807f-fb74303af5c4"
},
"editorMode": "code",
"expr": "avg(jmeter_summary{quantile=\"0.99\"}) by (label)",
"hide": false,
"instant": false,
"legendFormat": "TP999 path={{label}}",
"range": true,
"refId": "C"
}
],
"title": "TP99 response times",
"type": "timeseries"
}
],
"targets": [
{
"datasource": {
"type": "influxdb",
"uid": "e18c3112-795a-412c-926c-982c2e078ad2"
},
"refId": "A"
}
],
"title": "Response times by Transactions",
"type": "row"
},
{
"collapsed": true,
"datasource": {
"type": "influxdb",
"uid": "e18c3112-795a-412c-926c-982c2e078ad2"
},
"gridPos": {
"h": 1,
"w": 24,
"x": 0,
"y": 23
},
"id": 19,
"panels": [
{
"datasource": {
"type": "prometheus",
"uid": "e592656e-dbb8-47b9-807f-fb74303af5c4"
},
"description": "",
"fieldConfig": {
"defaults": {
"color": {
"mode": "palette-classic"
},
"custom": {
"axisCenteredZero": false,
"axisColorMode": "text",
"axisLabel": "TPS",
"axisPlacement": "auto",
"barAlignment": 0,
"drawStyle": "line",
"fillOpacity": 20,
"gradientMode": "opacity",
"hideFrom": {
"legend": false,
"tooltip": false,
"viz": false
},
"lineInterpolation": "linear",
"lineWidth": 1,
"pointSize": 5,
"scaleDistribution": {
"type": "linear"
},
"showPoints": "never",
"spanNulls": false,
"stacking": {
"group": "A",
"mode": "none"
},
"thresholdsStyle": {
"mode": "off"
}
},
"links": [],
"mappings": [],
"thresholds": {
"mode": "absolute",
"steps": [
{
"color": "green",
"value": null
},
{
"color": "red",
"value": 80
}
]
},
"unit": "none"
},
"overrides": [
{
"matcher": {
"id": "byName",
"options": " Sampler1"
},
"properties": [
{
"id": "color",
"value": {
"fixedColor": "dark-blue",
"mode": "fixed"
}
}
]
},
{
"matcher": {
"id": "byName",
"options": "Failure "
},
"properties": [
{
"id": "color",
"value": {
"fixedColor": "#bf1b00",
"mode": "fixed"
}
}
]
},
{
"matcher": {
"id": "byName",
"options": "OK"
},
"properties": [
{
"id": "color",
"value": {
"fixedColor": "dark-green",
"mode": "fixed"
}
}
]
},
{
"matcher": {
"id": "byName",
"options": "tutorialspoint.com"
},
"properties": [
{
"id": "color",
"value": {
"fixedColor": "#FFF899",
"mode": "fixed"
}
}
]
},
{
"matcher": {
"id": "byName",
"options": "Virtual Users"
},
"properties": [
{
"id": "color",
"value": {
"fixedColor": "#3274D9",
"mode": "fixed"
}
},
{
"id": "custom.fillOpacity",
"value": 40
},
{
"id": "custom.lineWidth",
"value": 0
},
{
"id": "custom.lineWidth",
"value": 3
},
{
"id": "unit",
"value": "short"
},
{
"id": "custom.axisPlacement",
"value": "hidden"
}
]
},
{
"matcher": {
"id": "byName",
"options": "Request OK per second"
},
"properties": [
{
"id": "color",
"value": {
"fixedColor": "#19730E",
"mode": "fixed"
}
}
]
},
{
"matcher": {
"id": "byName",
"options": "Request KO per second"
},
"properties": [
{
"id": "color",
"value": {
"fixedColor": "#AD0317",
"mode": "fixed"
}
}
]
},
{
"matcher": {
"id": "byValue",
"options": {
"op": "gte",
"reducer": "allIsZero",
"value": 0
}
},
"properties": [
{
"id": "custom.hideFrom",
"value": {
"legend": true,
"tooltip": true,
"viz": false
}
}
]
},
{
"matcher": {
"id": "byValue",
"options": {
"op": "gte",
"reducer": "allIsNull",
"value": 0
}
},
"properties": [
{
"id": "custom.hideFrom",
"value": {
"legend": true,
"tooltip": true,
"viz": false
}
}
]
}
]
},
"gridPos": {
"h": 7,
"w": 24,
"x": 0,
"y": 7
},
"id": 38,
"links": [],
"options": {
"legend": {
"calcs": [
"mean",
"max",
"min"
],
"displayMode": "table",
"placement": "bottom",
"showLegend": true
},
"tooltip": {
"mode": "multi",
"sort": "none"
}
},
"pluginVersion": "10.0.3",
"targets": [
{
"datasource": {
"type": "prometheus",
"uid": "e592656e-dbb8-47b9-807f-fb74303af5c4"
},
"editorMode": "code",
"exemplar": true,
"expr": "sum(rate(jmeter_count_total[1m])) by (label)",
"instant": false,
"interval": "",
"legendFormat": "{{label}}",
"refId": "C"
}
],
"title": "Transactions Throughput",
"type": "timeseries"
}
],
"targets": [
{
"datasource": {
"type": "influxdb",
"uid": "e18c3112-795a-412c-926c-982c2e078ad2"
},
"refId": "A"
}
],
"title": "Requests per second by Transaction",
"type": "row"
},
{
"collapsed": true,
"datasource": {
"type": "influxdb",
"uid": "e18c3112-795a-412c-926c-982c2e078ad2"
},
"gridPos": {
"h": 1,
"w": 24,
"x": 0,
"y": 24
},
"id": 20,
"panels": [
{
"datasource": {
"type": "prometheus",
"uid": "e592656e-dbb8-47b9-807f-fb74303af5c4"
},
"description": "",
"fieldConfig": {
"defaults": {
"color": {
"mode": "thresholds"
},
"custom": {
"align": "auto",
"cellOptions": {
"type": "auto"
},
"inspect": false
},
"links": [],
"mappings": [],
"thresholds": {
"mode": "absolute",
"steps": [
{
"color": "green",
"value": null
}
]
}
},
"overrides": [
{
"matcher": {
"id": "byName",
"options": "failureMessage"
},
"properties": [
{
"id": "custom.width"
},
{
"id": "displayName",
"value": "断言失败消息"
}
]
},
{
"matcher": {
"id": "byName",
"options": "label"
},
"properties": [
{
"id": "displayName",
"value": "取样器名称"
}
]
},
{
"matcher": {
"id": "byName",
"options": "Value"
},
"properties": [
{
"id": "displayName",
"value": "数量"
}
]
}
]
},
"gridPos": {
"h": 5,
"w": 24,
"x": 0,
"y": 8
},
"id": 16,
"links": [],
"options": {
"cellHeight": "sm",
"footer": {
"countRows": false,
"fields": "",
"reducer": [
"sum"
],
"show": false
},
"showHeader": true,
"sortBy": [
{
"desc": true,
"displayName": "failureMessage"
}
]
},
"pluginVersion": "10.0.3",
"targets": [
{
"datasource": {
"type": "prometheus",
"uid": "e592656e-dbb8-47b9-807f-fb74303af5c4"
},
"editorMode": "code",
"exemplar": false,
"expr": "sum by (code,label,assertionName,failureMessage) (jmeter_failure_total)",
"format": "table",
"instant": true,
"interval": "",
"intervalFactor": 1,
"legendFormat": "",
"range": false,
"refId": "B",
"step": 2
}
],
"title": "Error by Transactions",
"type": "table"
},
{
"datasource": {
"type": "prometheus",
"uid": "e592656e-dbb8-47b9-807f-fb74303af5c4"
},
"fieldConfig": {
"defaults": {
"color": {
"mode": "thresholds"
},
"custom": {
"align": "center",
"cellOptions": {
"type": "auto"
},
"inspect": false
},
"links": [],
"mappings": [],
"thresholds": {
"mode": "absolute",
"steps": [
{
"color": "green",
"value": null
}
]
}
},
"overrides": []
},
"gridPos": {
"h": 5,
"w": 24,
"x": 0,
"y": 13
},
"id": 15,
"links": [],
"options": {
"cellHeight": "sm",
"footer": {
"countRows": false,
"fields": "",
"reducer": [
"sum"
],
"show": false
},
"showHeader": true
},
"pluginVersion": "10.0.3",
"targets": [
{
"datasource": {
"type": "prometheus",
"uid": "e592656e-dbb8-47b9-807f-fb74303af5c4"
},
"editorMode": "code",
"exemplar": false,
"expr": "sum by (code) (jmeter_failure_total)",
"format": "table",
"hide": false,
"instant": true,
"interval": "",
"intervalFactor": 1,
"legendFormat": "",
"range": false,
"refId": "A",
"step": 2
}
],
"title": "Errors Count",
"type": "table"
}
],
"targets": [
{
"datasource": {
"type": "influxdb",
"uid": "e18c3112-795a-412c-926c-982c2e078ad2"
},
"refId": "A"
}
],
"title": "Errors Details",
"type": "row"
},
{
"collapsed": true,
"datasource": {
"type": "influxdb",
"uid": "e18c3112-795a-412c-926c-982c2e078ad2"
},
"gridPos": {
"h": 1,
"w": 24,
"x": 0,
"y": 25
},
"id": 22,
"panels": [
{
"aliasColors": {},
"bars": false,
"dashLength": 10,
"dashes": false,
"datasource": {
"type": "prometheus",
"uid": "e592656e-dbb8-47b9-807f-fb74303af5c4"
},
"fieldConfig": {
"defaults": {
"links": []
},
"overrides": []
},
"fill": 1,
"fillGradient": 0,
"gridPos": {
"h": 6,
"w": 24,
"x": 0,
"y": 42
},
"hiddenSeries": false,
"id": 24,
"legend": {
"avg": false,
"current": false,
"max": false,
"min": false,
"show": true,
"total": false,
"values": false
},
"lines": true,
"linewidth": 1,
"links": [],
"nullPointMode": "null",
"options": {
"alertThreshold": true
},
"percentage": false,
"pluginVersion": "10.0.3",
"pointradius": 5,
"points": false,
"renderer": "flot",
"seriesOverrides": [
{
"alias": "jmeter - PS Scavenge v1",
"yaxis": 1
}
],
"spaceLength": 10,
"stack": false,
"steppedLine": false,
"targets": [
{
"datasource": {
"type": "prometheus",
"uid": "e592656e-dbb8-47b9-807f-fb74303af5c4"
},
"expr": "rate(jvm_gc_collection_seconds_sum{job=~\"jmeter\"}[1m])",
"format": "time_series",
"hide": false,
"intervalFactor": 1,
"legendFormat": "{{instance}} - {{gc}} ",
"refId": "A"
},
{
"datasource": {
"type": "prometheus",
"uid": "e592656e-dbb8-47b9-807f-fb74303af5c4"
},
"expr": "rate(jvm_gc_collection_seconds_sum{job=~\"jmeter\"}[$interval]) / ignoring(gc) group_left rate(process_cpu_seconds_total{job=~\"jmeter\"}[$interval])",
"format": "time_series",
"hide": true,
"intervalFactor": 1,
"legendFormat": "{{instance}} - {{gc}} v2",
"refId": "B"
},
{
"datasource": {
"type": "prometheus",
"uid": "e592656e-dbb8-47b9-807f-fb74303af5c4"
},
"expr": "rate(jvm_gc_collection_seconds_sum{job=~\"jmeter\"}[1m]) / rate(jvm_gc_collection_seconds_count{job=~\"jmeter\"}[1m])",
"hide": true,
"legendFormat": "{{instance}} - {{gc}} v3",
"refId": "C"
}
],
"thresholds": [],
"timeRegions": [],
"title": "GC % time",
"tooltip": {
"shared": true,
"sort": 0,
"value_type": "individual"
},
"type": "graph",
"xaxis": {
"mode": "time",
"show": true,
"values": []
},
"yaxes": [
{
"format": "percentunit",
"logBase": 1,
"min": "0",
"show": true
},
{
"format": "short",
"logBase": 1,
"show": true
}
],
"yaxis": {
"align": false
}
},
{
"aliasColors": {},
"bars": false,
"dashLength": 10,
"dashes": false,
"datasource": {
"type": "prometheus",
"uid": "e592656e-dbb8-47b9-807f-fb74303af5c4"
},
"fieldConfig": {
"defaults": {
"links": []
},
"overrides": []
},
"fill": 1,
"fillGradient": 0,
"gridPos": {
"h": 5,
"w": 24,
"x": 0,
"y": 48
},
"hiddenSeries": false,
"id": 27,
"legend": {
"alignAsTable": true,
"avg": true,
"current": true,
"max": false,
"min": false,
"rightSide": true,
"show": true,
"sort": "avg",
"sortDesc": false,
"total": false,
"values": true
},
"lines": true,
"linewidth": 1,
"links": [],
"nullPointMode": "null",
"options": {
"alertThreshold": true
},
"percentage": false,
"pluginVersion": "10.0.3",
"pointradius": 5,
"points": false,
"renderer": "flot",
"seriesOverrides": [],
"spaceLength": 10,
"stack": true,
"steppedLine": false,
"targets": [
{
"datasource": {
"type": "prometheus",
"uid": "e592656e-dbb8-47b9-807f-fb74303af5c4"
},
"expr": "(jvm_memory_pool_bytes_committed {job=~\"jmeter\"}) - (jvm_memory_pool_bytes_used{job=~\"jmeter\"}) ",
"format": "time_series",
"hide": false,
"intervalFactor": 1,
"legendFormat": "{{instance}} - {{pool}}",
"refId": "A"
}
],
"thresholds": [],
"timeRegions": [],
"title": "JVM heap - free memory by pool",
"tooltip": {
"shared": true,
"sort": 0,
"value_type": "individual"
},
"type": "graph",
"xaxis": {
"mode": "time",
"show": true,
"values": []
},
"yaxes": [
{
"format": "bytes",
"logBase": 1,
"min": "0",
"show": true
},
{
"format": "short",
"logBase": 1,
"show": true
}
],
"yaxis": {
"align": false
}
},
{
"aliasColors": {},
"bars": false,
"dashLength": 10,
"dashes": false,
"datasource": {
"type": "prometheus",
"uid": "e592656e-dbb8-47b9-807f-fb74303af5c4"
},
"fieldConfig": {
"defaults": {
"links": []
},
"overrides": []
},
"fill": 1,
"fillGradient": 0,
"gridPos": {
"h": 6,
"w": 24,
"x": 0,
"y": 53
},
"hiddenSeries": false,
"id": 26,
"legend": {
"alignAsTable": true,
"avg": true,
"current": true,
"max": false,
"min": false,
"rightSide": true,
"show": true,
"sort": "avg",
"sortDesc": true,
"total": false,
"values": true
},
"lines": true,
"linewidth": 1,
"links": [],
"nullPointMode": "null",
"options": {
"alertThreshold": true
},
"percentage": false,
"pluginVersion": "10.0.3",
"pointradius": 5,
"points": false,
"renderer": "flot",
"seriesOverrides": [],
"spaceLength": 10,
"stack": true,
"steppedLine": false,
"targets": [
{
"datasource": {
"type": "prometheus",
"uid": "e592656e-dbb8-47b9-807f-fb74303af5c4"
},
"expr": "(jvm_memory_pool_bytes_used{job=\"jmeter\"}) ",
"format": "time_series",
"hide": false,
"intervalFactor": 1,
"legendFormat": "{{instance}} - {{pool}}",
"refId": "A"
}
],
"thresholds": [],
"timeRegions": [],
"title": "JVM heap - used memory by pool",
"tooltip": {
"shared": true,
"sort": 0,
"value_type": "individual"
},
"type": "graph",
"xaxis": {
"mode": "time",
"show": true,
"values": []
},
"yaxes": [
{
"format": "bytes",
"logBase": 1,
"min": "0",
"show": true
},
{
"format": "short",
"logBase": 1,
"show": true
}
],
"yaxis": {
"align": false
}
},
{
"aliasColors": {},
"bars": false,
"dashLength": 10,
"dashes": false,
"datasource": {
"type": "prometheus",
"uid": "e592656e-dbb8-47b9-807f-fb74303af5c4"
},
"fieldConfig": {
"defaults": {
"links": []
},
"overrides": []
},
"fill": 1,
"fillGradient": 0,
"gridPos": {
"h": 5,
"w": 24,
"x": 0,
"y": 59
},
"hiddenSeries": false,
"id": 25,
"legend": {
"alignAsTable": true,
"avg": true,
"current": true,
"max": false,
"min": false,
"rightSide": true,
"show": true,
"total": false,
"values": true
},
"lines": true,
"linewidth": 1,
"links": [],
"nullPointMode": "null",
"options": {
"alertThreshold": true
},
"percentage": false,
"pluginVersion": "10.0.3",
"pointradius": 5,
"points": false,
"renderer": "flot",
"seriesOverrides": [],
"spaceLength": 10,
"stack": true,
"steppedLine": false,
"targets": [
{
"datasource": {
"type": "prometheus",
"uid": "e592656e-dbb8-47b9-807f-fb74303af5c4"
},
"expr": "(jvm_memory_bytes_max {job=\"jmeter\"}) - (jvm_memory_bytes_used{job=\"jmeter\"})",
"format": "time_series",
"hide": false,
"intervalFactor": 1,
"legendFormat": "{{instance}} - {{area}}",
"refId": "A"
}
],
"thresholds": [],
"timeRegions": [],
"title": "JVM free memory",
"tooltip": {
"shared": true,
"sort": 0,
"value_type": "individual"
},
"type": "graph",
"xaxis": {
"mode": "time",
"show": true,
"values": []
},
"yaxes": [
{
"format": "bytes",
"logBase": 1,
"min": "0",
"show": true
},
{
"format": "short",
"logBase": 1,
"show": true
}
],
"yaxis": {
"align": false
}
}
],
"targets": [
{
"datasource": {
"type": "influxdb",
"uid": "e18c3112-795a-412c-926c-982c2e078ad2"
},
"refId": "A"
}
],
"title": "Test farm",
"type": "row"
}
],
"refresh": false,
"schemaVersion": 38,
"style": "dark",
"tags": [],
"templating": {
"list": [
{
"auto": false,
"auto_count": 1,
"auto_min": "10s",
"current": {
"selected": false,
"text": "5s",
"value": "5s"
},
"hide": 2,
"label": "interval",
"name": "interval",
"options": [
{
"selected": false,
"text": "1s",
"value": "1s"
},
{
"selected": true,
"text": "5s",
"value": "5s"
},
{
"selected": false,
"text": "15m",
"value": "15m"
},
{
"selected": false,
"text": "1h",
"value": "1h"
},
{
"selected": false,
"text": "6h",
"value": "6h"
},
{
"selected": false,
"text": "12h",
"value": "12h"
},
{
"selected": false,
"text": "1d",
"value": "1d"
}
],
"query": "1s,5s,15m,1h,6h,12h,1d",
"refresh": 2,
"skipUrlSync": false,
"type": "interval"
}
]
},
"time": {
"from": "2024-01-17T05:51:27.039Z",
"to": "2024-01-17T05:56:17.232Z"
},
"timepicker": {
"hidden": false,
"refresh_intervals": [
"5s",
"10s",
"30s",
"1m",
"5m",
"15m",
"30m",
"1h",
"2h",
"1d"
],
"time_options": [
"5m",
"15m",
"1h",
"6h",
"12h",
"24h",
"2d",
"7d",
"30d"
]
},
"timezone": "browser",
"title": "JMeter_Promethius_Grafana",
"uid": "keLoMYMnk",
"version": 36,
"weekStart": ""
} |


 1366
1366

 被折叠的 条评论
为什么被折叠?
被折叠的 条评论
为什么被折叠?
 到【灌水乐园】发言


