


今天是一个实战例子,由于没有数据,便按照书上的提示自己创建了一个。这是一个关于学生成绩绩点的东西,文件名为“ExamQuiz.txt”。
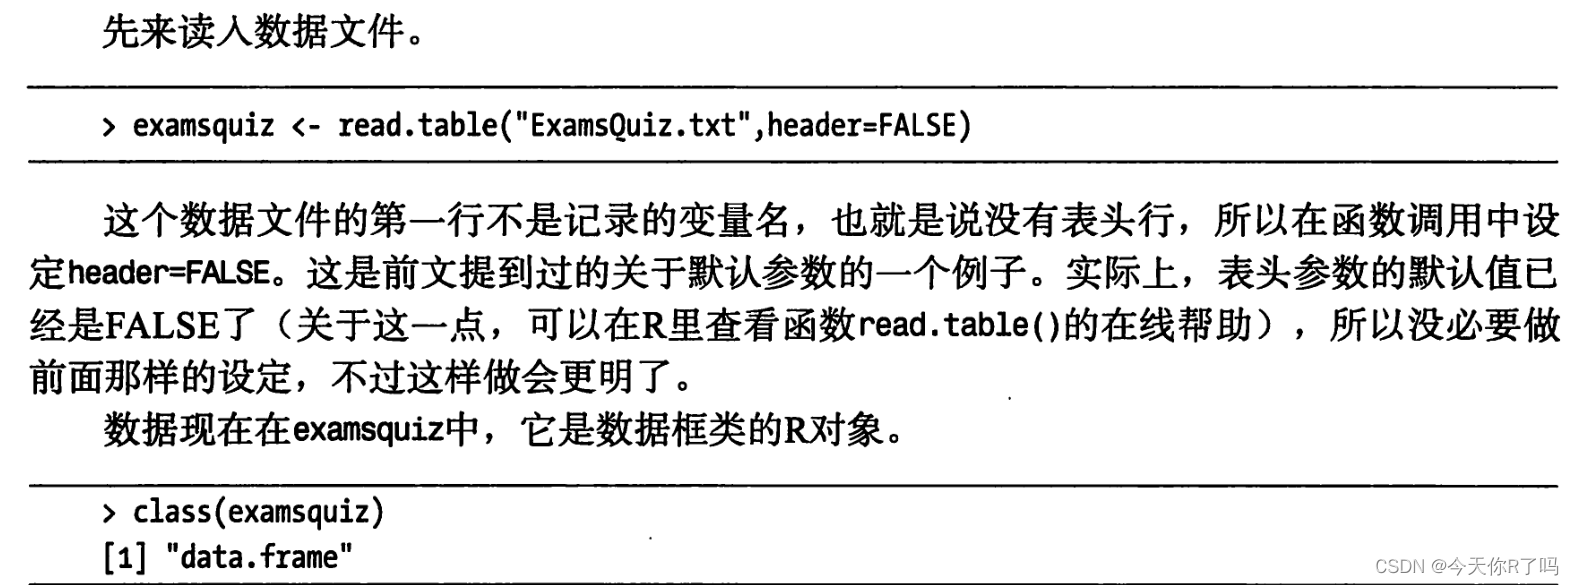
现在数据在ExamsQuiz中,他的类型是数据框
> class(ExamsQuiz)
[1] "data.frame"
明天接着写,今天真是没时间了,明早还得早起
真的是凡事宜早不宜迟!!
——————————————————
來了來了,接著寫
爲了检查数据文件刚才是否已经读入,查看数据的前面几行
> head(ExamsQuiz)
   V1  V2  V3
1 2.3 3.4 2.2
2 2.3 2.3 2.2
3 2.3 3.1 2.2
4 2.3 0.0 2.2
5 2.3 3.0 2.2
6 2.3 3.0 2.2```
此处我们可以看出,由于缺乏数据表头行,R自动把列名在设置为V1/V2/V3。

我们用数据的第一列预测第二列

```r
lma<-lm(ExamsQuiz[,2]~ExamsQuiz[,1])
这里面调用是我lm()函数,让R拟合下面的预测方程
第二列预测成绩=β0+β1*第一列的值
也可以这样写
> lma<-lm(ExamsQuiz$V2~ExamsQuiz$V1)
lm()的返回结果现在是保存于变量lma中的对象。它是lm类的一个实例。可以通过attributes()函数来列出他的所有组件。
> attributes(lma)
$names
 [1] "coefficients"  "residuals"     "effects"
 [4] "rank"          "fitted.values" "assign"
 [7] "qr"            "df.residual"   "xlevels"
[10] "call"          "terms"         "model"

$class
[1] "lm"
和往常一样,调用str(lma)可以得到更详细说明。βi的估计值保存在lma$coefficients中。在命令提示符下键入系数的变量名就可以显示系数。
> lma$coefficients
 (Intercept) ExamsQuiz$V1
   2.5621450    0.1102175
因为lma$coefficients是一个向量,所以容易打印,但是当打印对象lma本身是这样的
> lma

Call:
lm(formula = ExamsQuiz$V2 ~ ExamsQuiz$V1)

Coefficients:
 (Intercept)  ExamsQuiz$V1
      2.5621        0.1102

> summary(lma)

Call:
lm(formula = ExamsQuiz$V2 ~ ExamsQuiz$V1)

Residuals:
     Min       1Q   Median       3Q      Max
-2.81565  0.03859  0.18435  0.18435  0.58435

Coefficients:
             Estimate Std. Error t value Pr(>|t|)
(Intercept)    2.5621     0.5013   5.111 4.03e-05 ***
ExamsQuiz$V1   0.1102     0.1751   0.629    0.536
---
Signif. codes:
0 ‘***’ 0.001 ‘**’ 0.01 ‘*’ 0.05 ‘.’ 0.1 ‘ ’ 1

Residual standard error: 0.6421 on 22 degrees of freedom
Multiple R-squared:  0.01768,	Adjusted R-squared:  -0.02697
F-statistic: 0.396 on 1 and 22 DF,  p-value: 0.5356
泛型函数还不甚了解,后面再学。
要用第三行和第一行成绩预测第三行没可以使用记号+
> lma<-lm(ExamsQuiz[,2]~ExamsQuiz[,1]+ExamsQuiz[,3])
好了就算是补的我也要单独发一发的哈哈哈哈


 被折叠的 条评论
为什么被折叠?
被折叠的 条评论
为什么被折叠?
 到【灌水乐园】发言


