


1、 美国1995年-2009年邮费变化折线图、阶梯图;
from pyecharts.charts import Line
from pyecharts import options as opts
line = Line()
line.add_xaxis(["1995", "1996", "1997", "1998", "1999", "2000", "2001", "2002",  "2003", "2004", "2005", "2006", "2017", "2008", "2009"])
line.add_yaxis("邮费", [0.32, 0.32, 0.32, 0.32, 0.33, 0.33, 0.34, 0.37, 0.37, 0.37, 0.37, 0.39, 0.41, 0.42, 0.44]) # is_step=True  阶梯图
line.set_global_opts(title_opts=opts.TitleOpts(title="美国1995年-2009年邮费变化"))
line.render("折线图.html")

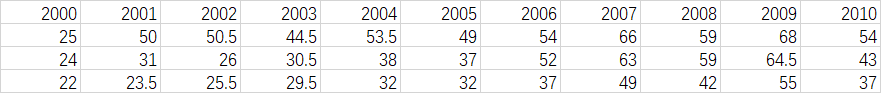
2、 2000年-2010年热狗大胃王比赛前三名成绩的堆叠柱形图、极坐标系-堆叠柱状图(南丁格尔玫瑰图);数据文件:hot-dog-places.csv
from pyecharts.charts import Bar
from pyecharts import options as opts
import csv
filename = "./hot-dog-places.csv"
data_x = []
data_y = []
with open(filename) as f:
   reader = csv.reader(f)
   for data_row in reader:
      data_x.append(data_row)
x = data_x[0]
y1 = data_x[1]
y1 = [float(i) for i in y1]
y2 = [float(i) for i in data_x[2]]
y3 = [
最低0.47元/天 解锁文章


 4776
4776


 被折叠的 条评论
为什么被折叠?
被折叠的 条评论
为什么被折叠?
 到【灌水乐园】发言


