


因做加拿大配送项目得用到谷歌地图
效果图:
第一步:
首先访问谷歌地图以及文档需要加速插件
你得在谷歌浏览器扩展程序里添加一个加速插件(如图):

最好充值vip,不然免费的加速通道不稳定
本人是在vue项目里使用(跟原生html写法区别不大)
谷歌地图官方文档:Google Maps Platform Documentation | Maps JavaScript API | Google Developers
第二步:
安装@googlemaps/js-api-loader 依赖包(这里不推荐使用vue2-google-maps,官方推荐使用@googlemaps/js-api-loader这个更好用)
npm i @googlemaps/js-api-loader安装完成后导入:
import { Loader } from '@googlemaps/js-api-loader' //引入template html:
<template>
  <div class="content">
    <input
      v-if="mapType == 'selectPoint'"
      id="pac-input"
      class="controls"
      type="text"
      :placeholder="L('请输入关键字')"
    />
    <div :style="googleMapStyle" class="googleMap" :id="mapID"></div>
  </div>
</template>
vue props:
<script>
import { Loader } from '@googlemaps/js-api-loader' //引入
export default {
props: {
    //mapType属性值为:
    //selectPoint时是地图选点
    //POLYGON是绘制地图多边形区域

    //地图id
    mapID: {
      type: String,
      default: () => {
        return 'googleMap'
      },
    },
    //谷歌地图类型
    mapType: {
      type: String,
      default: () => {
        return 'default'
      },
    },
    //谷歌地图样式
    googleMapStyle: {
      type: Object,
      default: () => {
        return {
          wdith: '100%',
          height: '500px',
        }
      },
    },
    //谷歌地图配置
    mapOptions: {
      type: Object,
      default: () => {
        return {
          //为了关闭默认控件集,设置地图的disableDefaultUI的属性为true
          disableDefaultUI: false,
          // 启用缩放和平移
          gestureHandling: 'greedy',
          panControl: true,
          zoomControl: true,
          scaleControl: true,
          //关闭街景
          streetViewControl: false,
        }
      },
    },
    //谷歌地图中心点
    googleMapCenter: {
      type: Object,
      default: () => {
        return {
          lat: 56.13036636210688,
          lng: -106.34677112102509,
        }
      },
    },
    //谷歌地图缩放级别
    zoom: {
      type: Number,
      default() {
        return 11
      },
    },
    //谷歌地图图形path
    mapPath: {
      type: String,
      default: () => {
        return ''
      },
    },
  },
}
</script>
逻辑层:
  data() {
    return {
      //地图选点回显值
      longlat: this.googleMapCenter.lng + ',' + this.googleMapCenter.lat,
      //标记点
      marker: [],
      //图形实例
      graphicalExample: null,
      //图形路径经纬度
      graphicalPath: [],
      apiKey: '你的谷歌地图key'
    }
  },
  created() {
      this.$nextTick(() => {
        const loader = new Loader({
        apiKey: this.apiKey, //之前的key
        version: 'weekly', //版本
        libraries: ['places', 'drawing'], //插件库places为基础库 drawing为绘制工具库
        region: 'Canada',
        language: 'en',
})
      const mapOptions = {
        center: { lat: this.googleMapCenter.lat * 1, lng: this.googleMapCenter.lng * 1 }, //中心点
        zoom: this.zoom, //缩放级别
        ...this.mapOptions, //其他配置
      }
      loader
        .load()
        .then((google) => {
          const map = new google.maps.Map(document.getElementById(this.mapID), mapOptions)
          this.googleMap = map
          this.googleApi = google
          console.log(this.googleMap, '谷歌地图实例')
          console.log(this.googleApi, '谷歌地图api')
        })
        .catch((e) => {
          // do something
          console.log(e)
        })
    })
  }
那么接下来可以试着运行吧!!!
运行如果报这个错,那么就是你的key账号控制台没有开通服务(如下图)

第三步:
开始集成绘制工具
created() {
this.$nextTick(() => {
const loader = new Loader({
apiKey: this.apiKey, //之前的key
version: 'weekly', //版本
libraries: ['places', 'drawing'], //插件库
region: 'Canada',
language: 'en',
})
const mapOptions = {
center: { lat: this.googleMapCenter.lat * 1, lng: this.googleMapCenter.lng * 1 }, //中心点
zoom: this.zoom, //缩放级别
...this.mapOptions, //其他配置
}
loader
.load()
.then((google) => {
const map = new google.maps.Map(document.getElementById(this.mapID), mapOptions)
this.googleMap = map
this.googleApi = google
console.log(this.googleMap, '谷歌地图实例')
console.log(this.googleApi, '谷歌地图api')
// console.log(this.mapPath, '地图图形经纬度')
if (this.mapType == 'POLYGON') {
//如果是绘制图形类型则开始实例化绘制工具库
let drawingModesList = {
MARKER: this.googleApi.maps.drawing.OverlayType.MARKER,//标记点
CIRCLE: this.googleApi.maps.drawing.OverlayType.CIRCLE,//圆形
POLYGON: this.googleApi.maps.drawing.OverlayType.POLYGON,//多边形
POLYLINE: this.googleApi.maps.drawing.OverlayType.POLYLINE,//折线
RECTANGLE: this.googleApi.maps.drawing.OverlayType.RECTANGLE,//矩形
}
const drawingManager = new this.googleApi.maps.drawing.DrawingManager({
drawingControl: true,
drawingControlOptions: {
position: this.googleApi.maps.ControlPosition.TOP_CENTER,
drawingModes: [drawingModesList[this.mapType]],//这是个数组,因为我只需要多边形的就只传了一个
},
polygonOptions: {
fillColor: 'blue',
strokeColor: 'blue',
strokeOpacity: 0.8,
fillOpacity: 0.4,
strokeWeight: 5,
clickable: false,
editable: true,
zIndex: 1,
},
})
drawingManager.setMap(map)
})
}
})
.catch((e) => {
// do something
console.log(e)
})
})
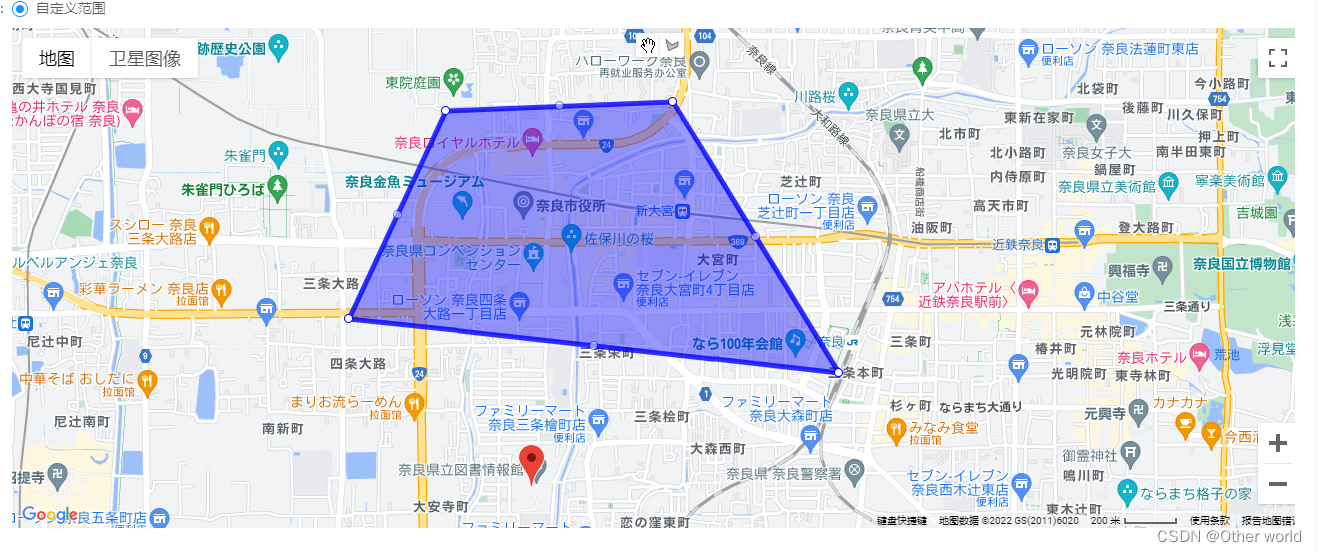
},效果图如下:

第四步(end):
获取多边形图形路径数据和回显图形以及地图搜索选点功能(核心代码)
created() {
    this.$nextTick(() => {
      const loader = new Loader({
        apiKey: this.apiKey, //之前的key
        version: 'weekly', //版本
        libraries: ['places', 'drawing'], //插件库
        region: 'Canada',
        language: 'en',
})
      const mapOptions = {
        center: { lat: this.googleMapCenter.lat * 1, lng: this.googleMapCenter.lng * 1 }, //中心点
        zoom: this.zoom, //缩放级别
        ...this.mapOptions, //其他配置
      }
      loader
        .load()
        .then((google) => {
          const map = new google.maps.Map(document.getElementById(this.mapID), mapOptions)
          this.googleMap = map
          this.googleApi = google
          console.log(this.googleMap, '谷歌地图实例')
          console.log(this.googleApi, '谷歌地图api')
          // console.log(this.mapPath, '地图图形经纬度')
          if (this.mapType == 'selectPoint') {
            this.selectPoint()
            this.addDraggableMarkers(1, true, this.googleMapCenter)
          }
          if (this.mapType == 'POLYGON') {
            this.addDraggableMarkers(1, false, this.googleMapCenter)
            //如果是绘制图形类型则开始实例化绘制工具库
            let drawingModesList = {
              MARKER: this.googleApi.maps.drawing.OverlayType.MARKER,
              CIRCLE: this.googleApi.maps.drawing.OverlayType.CIRCLE,
              POLYGON: this.googleApi.maps.drawing.OverlayType.POLYGON,
              POLYLINE: this.googleApi.maps.drawing.OverlayType.POLYLINE,
              RECTANGLE: this.googleApi.maps.drawing.OverlayType.RECTANGLE,
            }
            const drawingManager = new this.googleApi.maps.drawing.DrawingManager({
              drawingControl: true,
              drawingControlOptions: {
                position: this.googleApi.maps.ControlPosition.TOP_CENTER,
                drawingModes: [drawingModesList[this.mapType]],
              },
              polygonOptions: {
                fillColor: 'blue',
                strokeColor: 'blue',
                strokeOpacity: 0.8,
                fillOpacity: 0.4,
                strokeWeight: 5,
                clickable: false,
                editable: true,
                zIndex: 1,
              },
            })
            drawingManager.setMap(map)
            //监听绘制多边形完成事件事件
            this.googleApi.maps.event.addListener(drawingManager, 'polygoncomplete', (e) => {
              //存在就清除上一个图形
              if (this.graphicalExample) {
                this.graphicalExample.setMap(null)
              }
              //path路径emit传出
              this.setPath(e.getPath().Ld)
              this.graphicalExample = e
              //监听回显图形每一个路径点
              this.googleApi.maps.event.addListener(e.getPath(), 'insert_at', (event) => {
                //path路径emit传出
                this.setPath(e.getPath().Ld)
              })
              this.googleApi.maps.event.addListener(e.getPath(), 'set_at', (event) => {
                this.setPath(e.getPath().Ld)
              })
              //绘制完成后关闭绘制状态
              drawingManager.setDrawingMode(null)
            })
            //回显图形
            if (JSON.parse(this.mapPath).length > 0) {
              this.echoGraphical()
            }
          }
        })
        .catch((e) => {
          // do something
          console.log(e)
        })
    })
  },
methods: {
//回显图形
    echoGraphical() {
      if (this.mapType == 'POLYGON') {
        //回显多边形
        this.graphicalPath = this.mapPath
        let paths = JSON.parse(this.graphicalPath)
        // Construct a draggable red triangle with geodesic set to true.
        this.graphicalExample = new this.googleApi.maps.Polygon({
          paths,
          fillColor: 'blue',
          strokeColor: 'blue',
          strokeOpacity: 0.8,
          fillOpacity: 0.4,
          strokeWeight: 5,
          clickable: true,
          editable: true,
          zIndex: 1,
        })
        this.graphicalExample.setMap(this.googleMap)
        //监听回显图形每一个路径点
        this.googleApi.maps.event.addListener(this.graphicalExample.getPath(), 'insert_at', (event) => {
          this.setPath(this.graphicalExample.getPath().Ld)
        })
        this.googleApi.maps.event.addListener(this.graphicalExample.getPath(), 'set_at', (event) => {
          this.setPath(this.graphicalExample.getPath().Ld)
        })
      }
    },
//path路径emit传出
    setPath(path) {
      this.graphicalPath = []
      if (path.length > 0) {
        path.forEach((v) => {
          this.graphicalPath.push({ lat: v.lat(), lng: v.lng() })
        })
        this.$emit('getGraphicalPath', this.graphicalPath)
      }
    },
    //搜索地点方法
    selectPoint() {
      const input = document.getElementById('pac-input')
      const searchBox = new this.googleApi.maps.places.SearchBox(input)
      const infoWindow = new this.googleApi.maps.InfoWindow()
      this.googleMap.controls[this.googleApi.maps.ControlPosition.TOP_LEFT].push(input)
      this.googleMap.addListener('click', (e) => {
        this.clickGmap(e)
      })
      this.googleMap.addListener('bounds_changed', () => {
        searchBox.setBounds(this.googleMap.getBounds())
        let markers = []
        searchBox.addListener('places_changed', () => {
          const places = searchBox.getPlaces()

          if (places.length == 0) {
            return
          }

          // Clear out the old markers.
          markers.forEach((marker) => {
            marker.setMap(null)
          })
          markers = []

          // For each place, get the icon, name and location.
          const bounds = new this.googleApi.maps.LatLngBounds()

          places.forEach((place) => {
            if (!place.geometry || !place.geometry.location) {
              console.log('Returned place contains no geometry')
              return
            }

            const icon = {
              url: place.icon,
              size: new this.googleApi.maps.Size(71, 71),
              origin: new this.googleApi.maps.Point(0, 0),
              anchor: new this.googleApi.maps.Point(17, 34),
              scaledSize: new this.googleApi.maps.Size(25, 25),
            }

            // Create a marker for each place.
            markers.push(
              new this.googleApi.maps.Marker({
                map: this.googleMap,
                icon,
                title: place.name,
                position: place.geometry.location,
                draggable: false,
              })
            )
            if (place.geometry.viewport) {
              // Only geocodes have viewport.
              bounds.union(place.geometry.viewport)
            } else {
              bounds.extend(place.geometry.location)
            }
          })
          this.googleMap.fitBounds(bounds)
        })
      })
    },
//点击地图回调
    clickGmap(e) {
      this.longlat = e.latLng.lat() + ',' + e.latLng.lng()
      this.$emit('setLongLat', this.longlat)
      this.addDraggableMarkers(1, true, { lat: e.latLng.lat(), lng: e.latLng.lng() })
    },
    //移动标记点回调
    updateMaker(e) {
      this.longlat = e.latLng.lat() + ',' + e.latLng.lng()
      this.$emit('setLongLat', this.longlat)
    },
    //添加可拖动的标记点
    addDraggableMarkers(max, draggable, { lat = 0, lng = 0 }) {
      if (max != -1) {
        this.marker.forEach((marker) => {
          marker.setMap(null)
        })
        this.marker = []
      }
      this.marker.push(
        new this.googleApi.maps.Marker({
          map: this.googleMap,
          position: { lat: lat, lng: lng },
          draggable: draggable,
        })
      )
      if (draggable) {
        this.marker[0].addListener('dragend', (e) => {
          this.updateMaker(e)
        })
      }
    },
    //获取经纬度
    getLongLat() {
      return this.longlat
    },
    //设置地图中心点位置
    setMapPanBy(e) {
      let latlng = new this.googleApi.maps.LatLng(e.lat,e.lng)
      this.googleMap.setCenter(latlng)
      this.marker[0].setPosition(latlng);
    },
}
绘制多边形效果图:
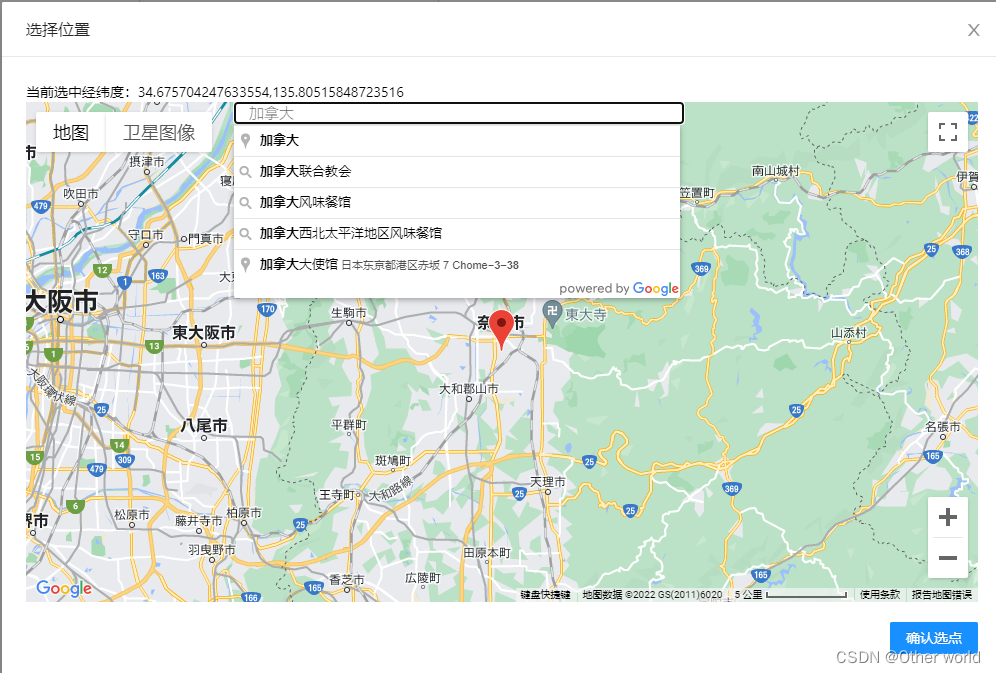
地图选点效果(点击地图或者拖动标记点获取经纬度,自带模糊搜索功能):
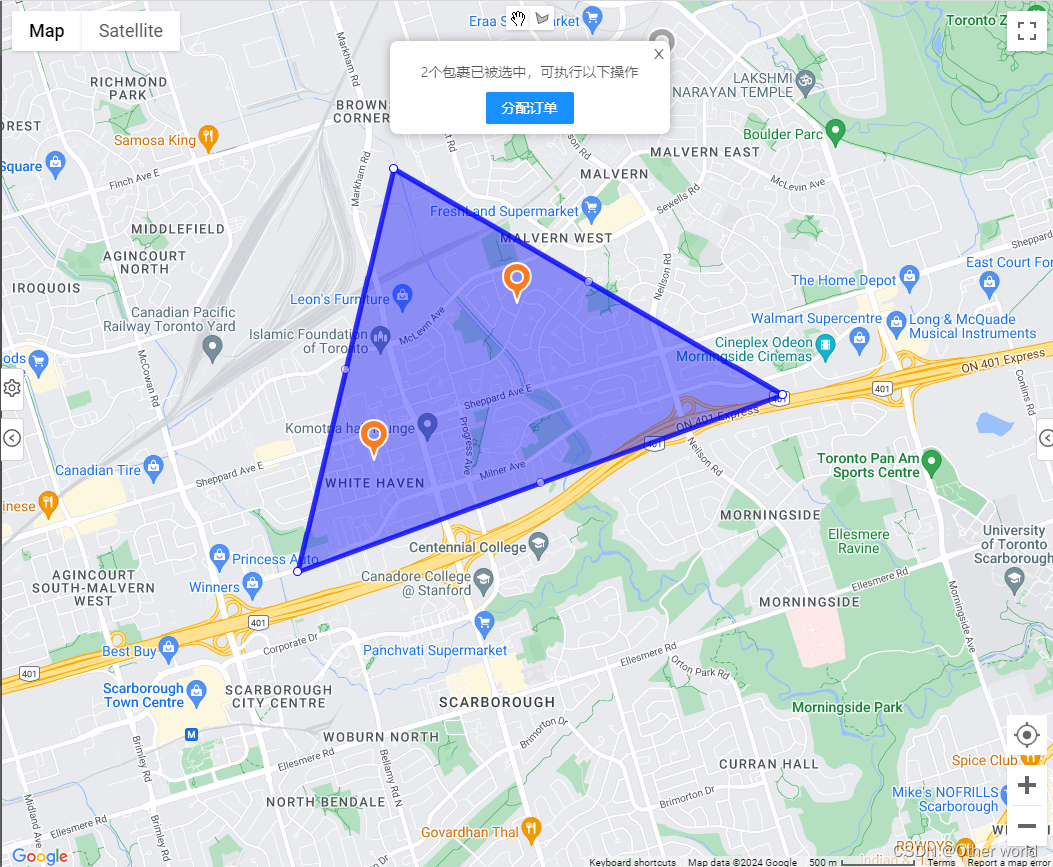
补充:如果需要用到绘制图形得知图形内有几个标记点的功能,请看我的另一篇文章,链接是:vue谷歌地图用api获取绘制的图形范围内的标记点
另一篇的效果图:


 2605
2605


 被折叠的 条评论
为什么被折叠?
被折叠的 条评论
为什么被折叠?
 到【灌水乐园】发言


