


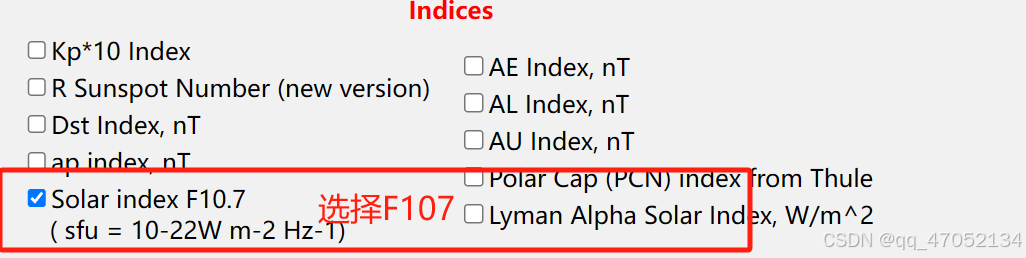
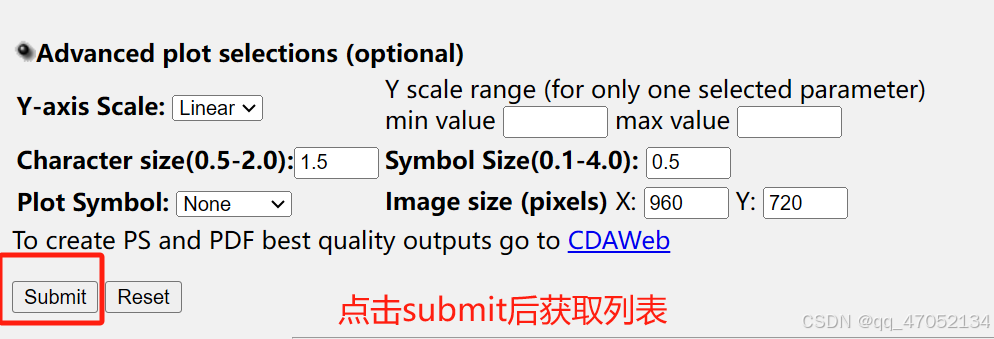
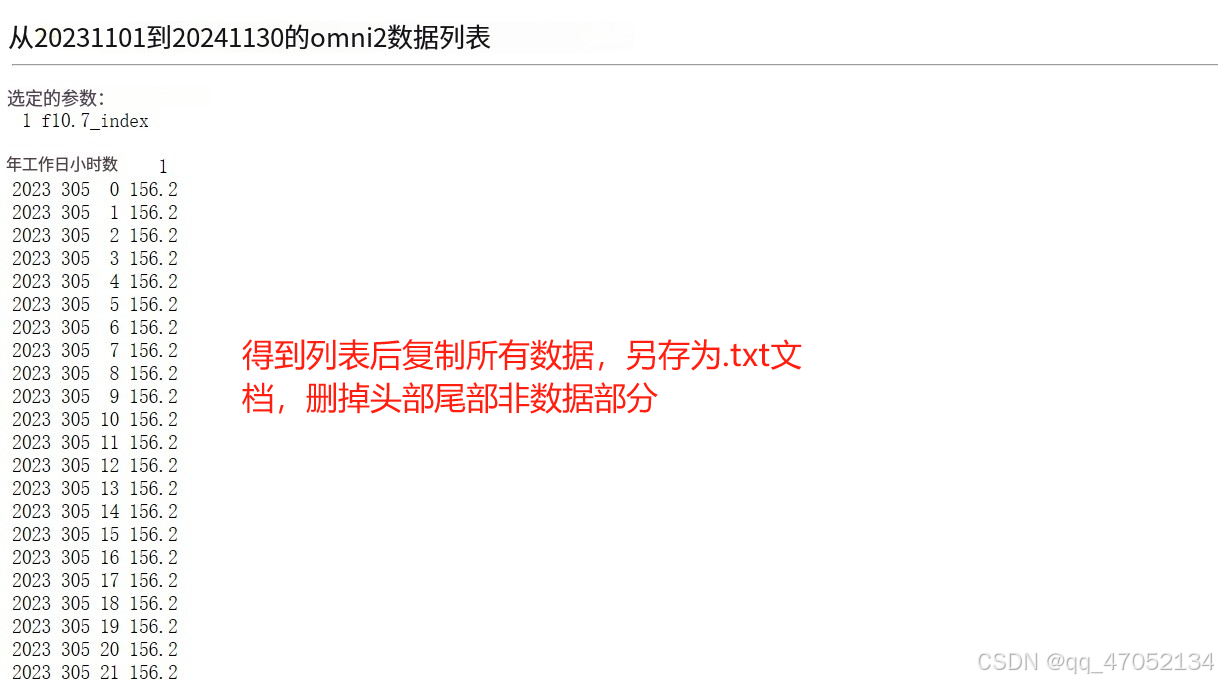
1.IRI模型需要的参数F107,可以在网站下载https://omniweb.gsfc.nasa.gov/form/dx1.html,指定日期时间即可获取列表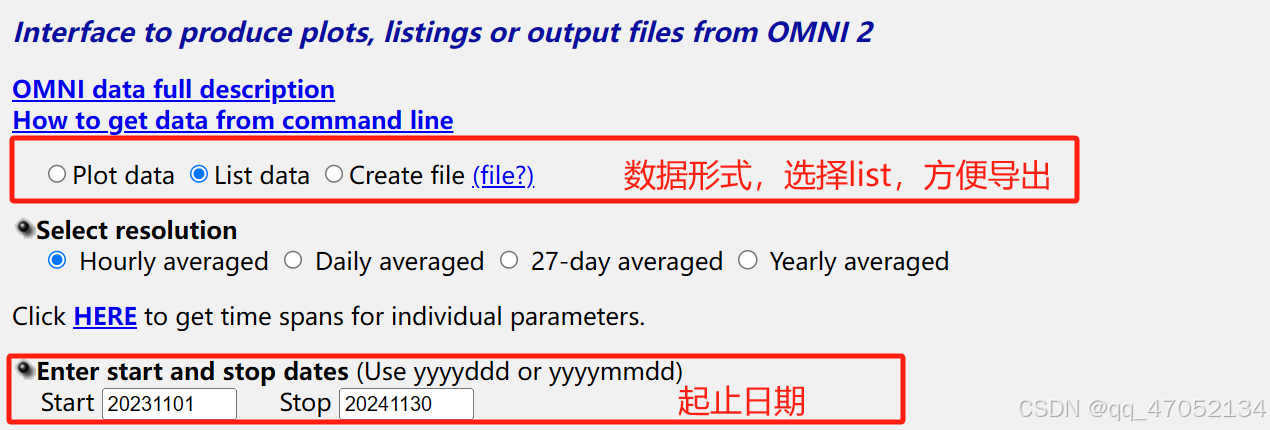
准备数据准备完毕,接下来运行以下程序
以下代码计算latitude=23.14,longitude=113.36的地方20231101起的数据,程序划定网格跑出IRI模型的数据,将所需经纬度点划定在步长较小的网格范围内就可得到对应点的值,需要设置
ccir_or_ursi=0来选择IRI系数使用ccir还是ursi,0为ccir,1为ursi
r_res=1, lat_res=0.01, lon_res=0.01, alt_res=10 为设置时间,纬度,经度,高度步长,单位为小时,度,Km

设置网格起止经纬度
F107所在.txt文档位置
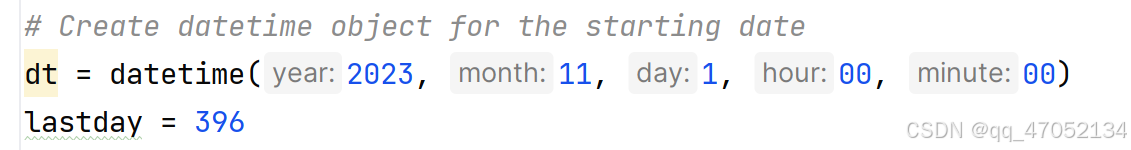
dt为开始日期,lastday为总共要计算的天数
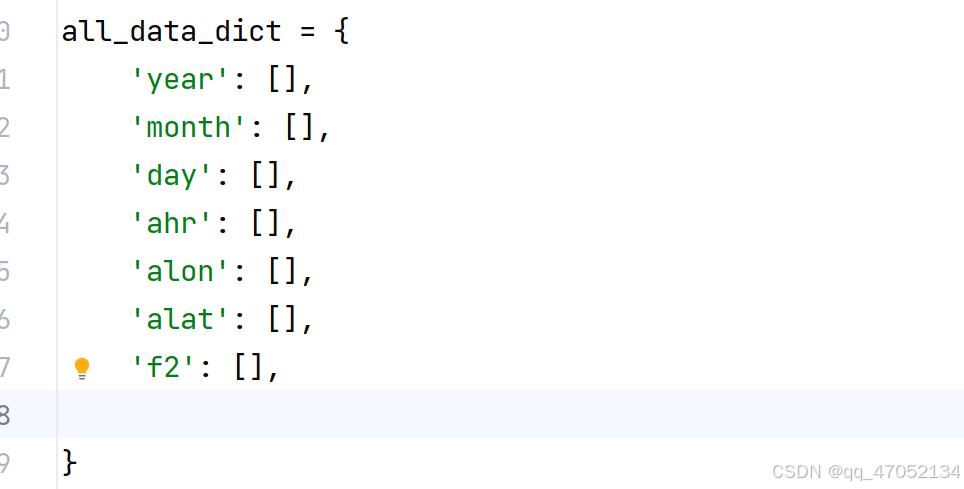
字典里为需要保存的变量,以下为 run_iri_reg_grid函数包含的变量,可选取对应的电离层所需的变量,以下代码为F2层数据。
Parameters
----------
year : int
    Four digit year in C.E.
month : int
    Integer month (range 1-12)
day : int
    Integer day of month (range 1-31)
f107 : int or float
    F10.7 index for the given day
hr_res : int or float
    Time resolution in hours (default=1)
lat_res : int or float
    Latitude resolution in degrees (default=1)
lon_res : int or float
    Longitude resolution in degrees (default=1)
alt_res : int or float
    Altitude resolution in km (default=10)
alt_min : int or float
    Altitude minimum in km (default=0)
alt_max : int or float
    Altitude maximum in km (default=700)
ccir_or_ursi : int
    If 0 use CCIR coefficients, if 1 use URSI coefficients

Returns
-------
alon : array-like
    1D longitude grid
alat : array-like
    1D latitude grid
alon_2d : array-like
    2D longitude grid
alat_2d : array-like
    2D latitude grid
aalt : array-like
    Altitude grid
ahr : array-like
    UT grid
f2 : array-like
    F2 peak
f1 : array-like
    F1 peak
epeak : array-like
    E peak
es_peak : array-like
    Sporadic E (Es) peak
sun : array-like
    Solar zenith angle in degrees
mag : array-like
    Magnetic inclination in degrees
edens_prof : array-like
    Electron density profile in per cubic m
alon, alat, alon_2d, alat_2d, aalt, ahr, f2, f1, epeak, es_peak, sun, mag, edens_prof = run_iri_reg_grid(year,
                                                                                                             month, day,
                                                                                                             f107)
import numpy as np
import datetime as dt
from fortranformat import FortranRecordReader
import math
import os
import PyIRI.main_library as ml
import PyIRI
import PyIRI.igrf_library as igrf
from PyIRI import logger
from datetime import datetime,timedelta
import scipy.io
def run_iri_reg_grid(year, month, day, f107, hr_res=1, lat_res=0.01, lon_res=0.01,
alt_res=10, alt_min=0, alt_max=700, ccir_or_ursi=0):
"""Run IRI for a single day on a regular grid."""
alon, alat, alon_2d, alat_2d, aalt, ahr = create_reg_grid(
hr_res=hr_res, lat_res=lat_res, lon_res=lon_res,
alt_res=alt_res, alt_min=alt_min, alt_max=alt_max)
# Get density profile and related parameters
f2, f1, epeak, es_peak, sun, mag, edens_prof = ml.IRI_density_1day(
year, month, day, ahr, alon, alat, aalt, f107, PyIRI.coeff_dir, ccir_or_ursi)
return alon, alat, alon_2d, alat_2d, aalt, ahr, f2, f1, epeak, es_peak, sun, mag, edens_prof
def create_reg_grid(hr_res=1, lat_res=0.01, lon_res=0.01, alt_res=10, alt_min=0,
alt_max=700, lon_start=113.36, lon_end=113.37, lat_start=23.14, lat_end=23.15):
"""Create regular grid for latitudes, longitudes, altitudes, and times."""
alon, alat, alon_2d, alat_2d = set_geo_grid(lon_res, lat_res, lon_start, lon_end, lat_start, lat_end)
aalt = np.arange(alt_min, alt_max, alt_res)
ahr, _, _, _, _ = set_temporal_array(hr_res)
return alon, alat, alon_2d, alat_2d, aalt, ahr
def set_temporal_array(dUT):
"""Set time array with given time step."""
aUT = np.arange(0, 24, dUT)
ahour = np.fix(aUT).astype(int)
aminute = ((aUT - ahour) * 60.).astype(int)
asecond = (aUT * 0).astype(int)
atime_frame_strings = [str(ahour[it]).zfill(2) + str(aminute[it]).zfill(2)
for it in range(0, aUT.size)]
return aUT, ahour, aminute, asecond, atime_frame_strings
def set_geo_grid(dlon, dlat, lon_start, lon_end, lat_start, lat_end):
"""Set geographical grid for given resolution."""
alon_2d, alat_2d = np.mgrid[lon_start:lon_end + dlon:dlon, lat_start:lat_end + dlat:dlat]
alon = np.reshape(alon_2d, alon_2d.size)
alat = np.reshape(alat_2d, alat_2d.size)
return alon, alat, alon_2d, alat_2d
def extract_and_update_data(directory):
"""Extract and update F10.7 data."""
fourth_column_data = []
for filename in os.listdir(directory):
if filename.endswith('.txt'):
file_path = os.path.join(directory, filename)
with open(file_path, 'r') as file:
lines = file.readlines()
for i in range(len(lines) - 1):
data = lines[i].split()
if len(data) >= 4 and float(data[3]) > 200:
lines[i] = lines[i + 1]
for line in lines:
data = line.split()
if len(data) >= 4:
fourth_column_data.append(float(data[3]))
return fourth_column_data
# Main execution
directory = 'D:/fff'
result = extract_and_update_data(directory)
# Create datetime object for the starting date
dt = datetime(2023, 11, 1, 00, 00)
lastday = 396
num_iterations = round(lastday) + 1
# Create a dictionary to hold all the data for saving
all_data_dict = {
'year': [],
'month': [],
'day': [],
'ahr': [],
'alon': [],
'alat': [],
'f2': [],
}
# Loop through each day and collect data
for nt in range(1, num_iterations):
year = dt.year
month = dt.month
day = dt.day
f107 = result[nt - 1]
alon, alat, alon_2d, alat_2d, aalt, ahr, f2, f1, epeak, es_peak, sun, mag, edens_prof = run_iri_reg_grid(year,
month, day,
f107)
# Append data to the dictionary
all_data_dict['year'].append(year)
all_data_dict['month'].append(month)
all_data_dict['day'].append(day)
all_data_dict['ahr'].append(ahr)
all_data_dict['alon'].append(alon)
all_data_dict['alat'].append(alat)
all_data_dict['f2'].append(f2)
#all_data_dict['foF2'].append(foF2)
# Move to the next day
dt = dt + timedelta(hours=24)
# Save all collected data into a .mat file
file_path = 'D:/ou'
scipy.io.savemat(os.path.join(file_path, 'IRI_all_data_23.14.mat'), all_data_dict)
print("All data saved successfully!")
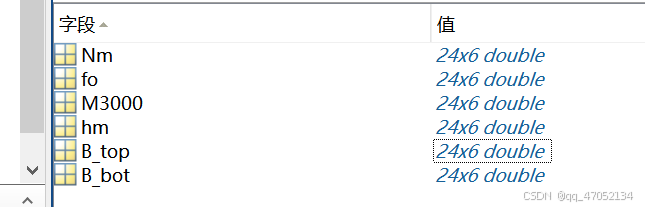
得到mat文件后用MATLAB处理数据即可,以下为f2中包含的F2层变量,包含电子密度、峰值高度、临界频率等信息。
以下代码将得到的mat数据从网格中取出对应点的数据
clear;
clc;
cd 'D:\ou'
load('IRI_all_data_23.14.mat');
data=[];
data_all=[];
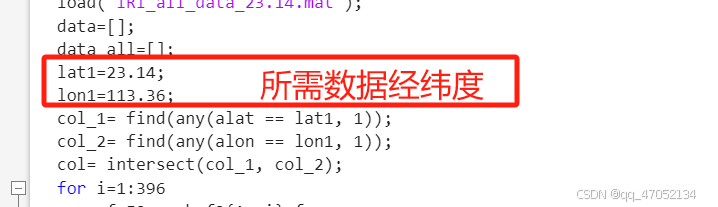
lat1=23.14;
lon1=113.36;
col_1= find(any(alat == lat1, 1));
col_2= find(any(alon == lon1, 1));
col= intersect(col_1, col_2);
for i=1:396
foF2_mesh=f2{1, i}.fo;
foF2=foF2_mesh(:,col);
%a,b=size(foF2);
for j=1:size(foF2,1)
data(j,1)=year(i);
data(j,2)=month(i);
data(j,3)=day(i);
data(j,4)=j-1;%UT
data(j,5)=foF2(j);
end
data_all=[data_all;data];
end
 data_all即为所需数据


 被折叠的 条评论
为什么被折叠?
被折叠的 条评论
为什么被折叠?
 到【灌水乐园】发言


