


第一步 下载依赖 npm install echarts --save
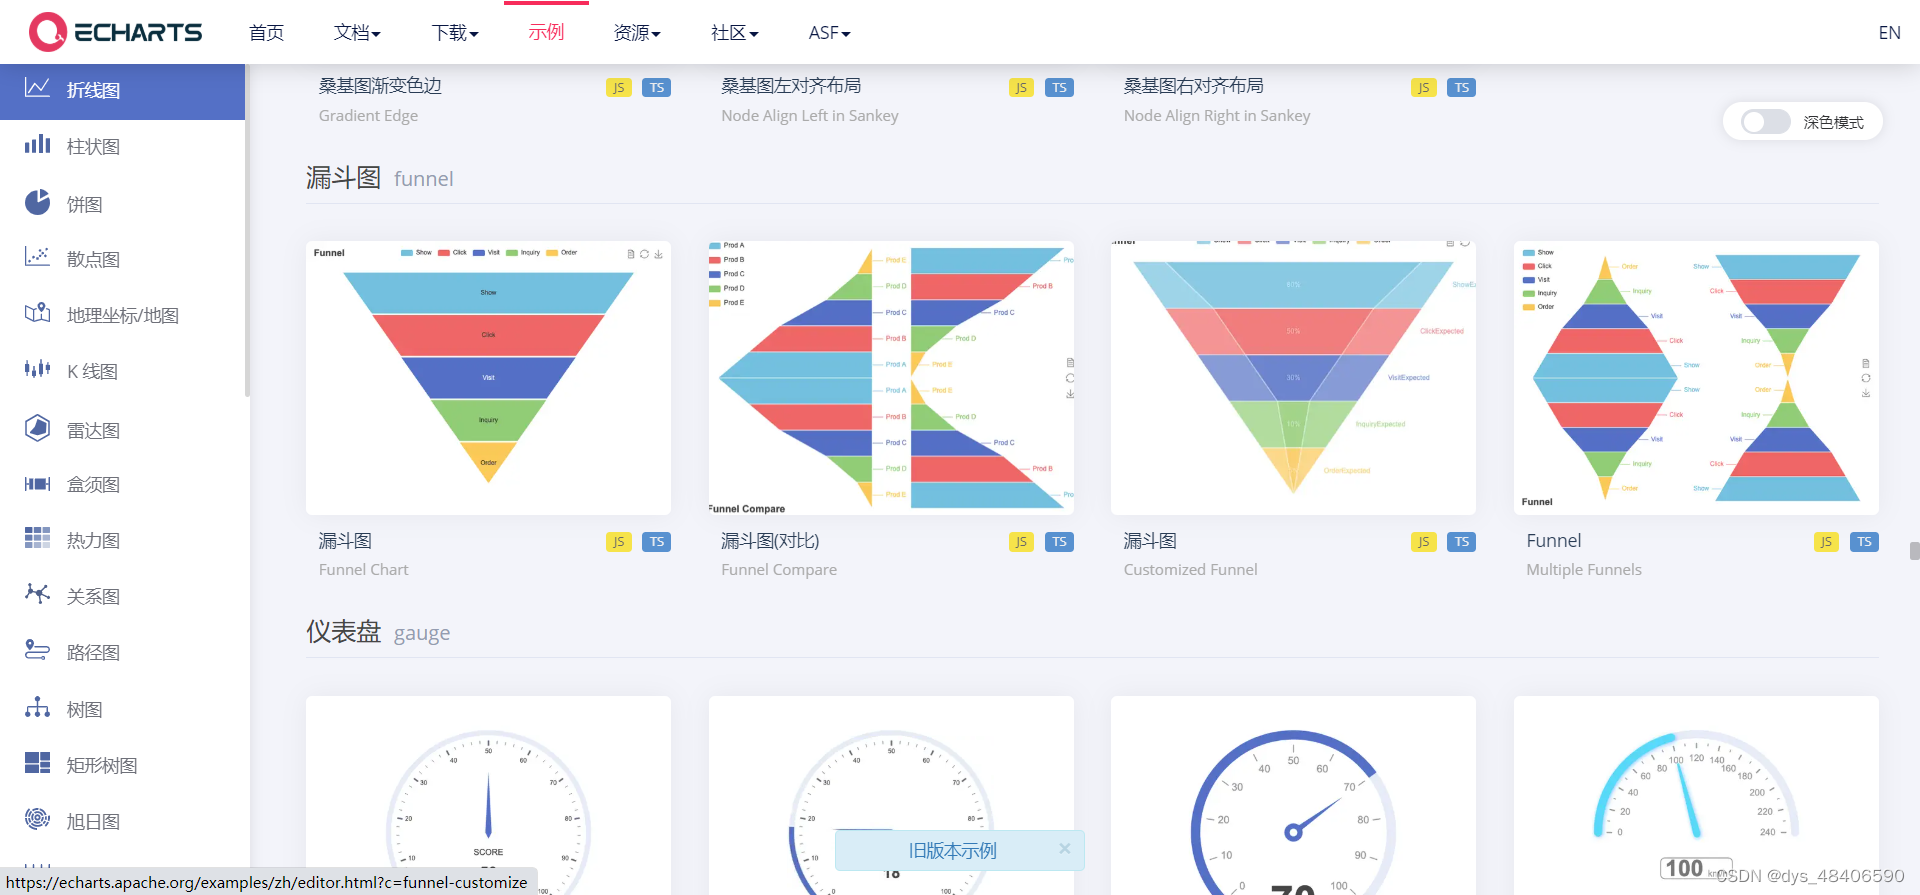
第二步 进入官网(Examples - Apache ECharts)找到你所需要的统计类型图
第三步 组件调用 import * as echarts from 'echarts';
使用方式
随意你所需要的我就用以下的代码做案例
复制所有代码粘贴到你的编译程序中运行就可以了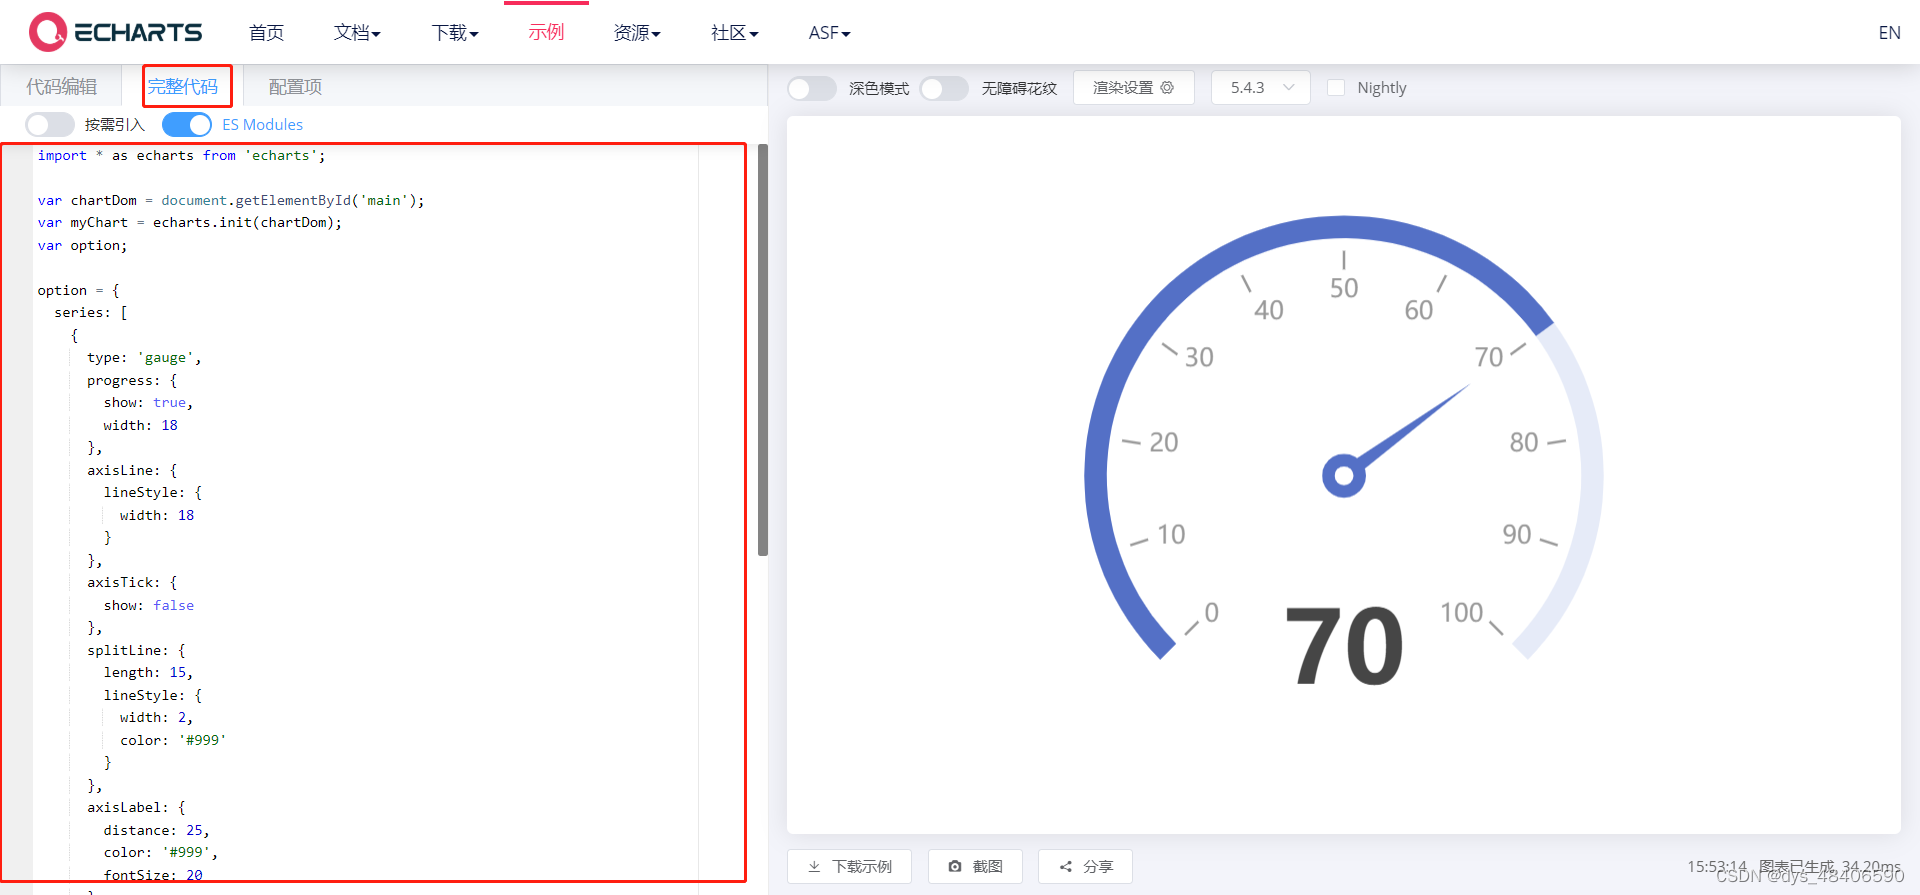
以下为代码实现案例:
<template>
  <div class="app-container">
    <el-row>
      <el-col :span="12">
        <i class="el-icon-stopwatch"></i>
        {{"业绩指标"}}
      </el-col>
      <el-col :span="12" :push="9">
        <el-select v-model="value" placeholder="请选择" style="width: 18%">
          <el-option
            v-for="item in options"
            :key="item.value"
            :label="item.label"
            :value="item.value">
          </el-option>
        </el-select>
      </el-col>
    </el-row>

    <div id="main"></div>

    <div class="text">
      <el-row>
        <el-col :span="5">
          <span>{{"目标:"}}</span>
          <count-to :start-val="0" :end-val="0" :duration="2600" class="card-panel-num" />
        </el-col>
        <el-col :span="5">
          <span>{{"合同金额:"}}</span>
          <count-to :start-val="0" :end-val="0" :duration="2600" class="card-panel-num" />
        </el-col>
        <el-col :span="5">
          <span>{{"回款金额:"}}</span>
          <count-to :start-val="0" :end-val="0" :duration="2600" class="card-panel-num" />
        </el-col>
      </el-row>
    </div>
  </div>
</template>

<script>

import * as echarts from 'echarts';
import CountTo from 'vue-count-to'

export default {
  name: "LineChart_1",
  components: {
    CountTo
  },
  data(){
    return{
      value:1,
      options:[
        {value:1,label:"回款金额"},
        {value:2,label:"合同金额"}
      ]
    }
  },
  mounted() {
    const echarts = require('echarts/lib/echarts');
    require('echarts/lib/component/tooltip');
    require('echarts/lib/chart/gauge');

    let chartDom = document.getElementById('main');
    let myChart = echarts.init(chartDom);
    let option;

    option = {
      tooltip: {
        formatter: '{a} <br/>{b} : {c}%'
      },
      series: [
        {
          name: 'completionRate',
          type: 'gauge',
          progress: {
            show: true
          },
          detail: {
            valueAnimation: true,
            formatter: '{value}'
          },
          data: [
            {
              value: 0,
              name: '完成率'
            }
          ]
        }
      ]
    };

    option && myChart.setOption(option);
  }
}
</script>

<style scoped>
#main{
  width: 300px;
  height: 300px;
  margin-left: 36%;
}
.text{
  width: 50%;
  margin-left: 33%;
}
.el-icon-stopwatch{
  font-size: 20px;
  color: #ff4949;
}
</style>

<template>
<div class="app-container">
<el-row>
<el-col :span="12">
<i class="el-icon-caret-bottom"></i>
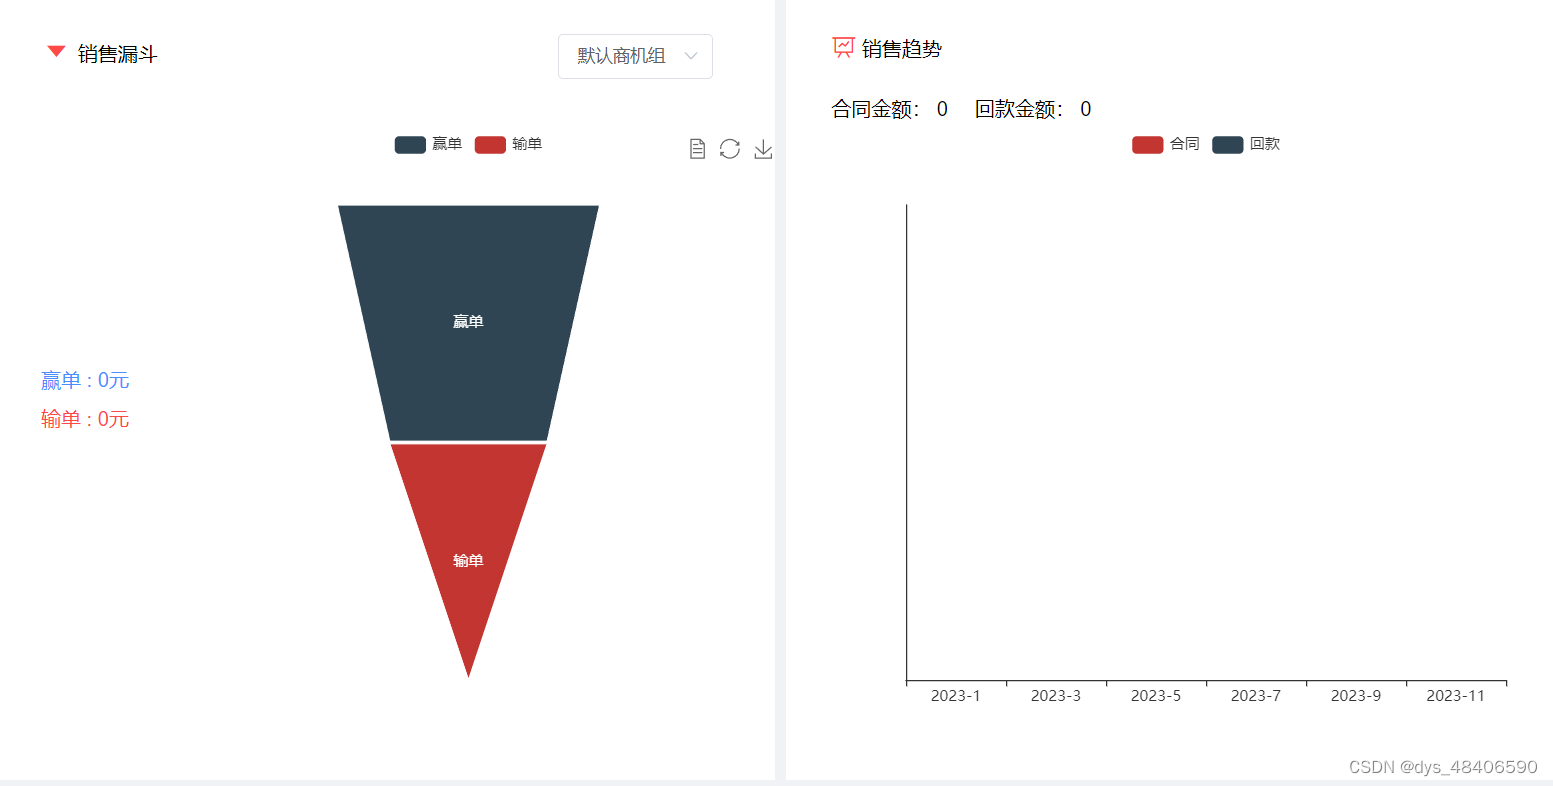
{{"销售漏斗"}}
</el-col>
<el-col :span="12" :push="6">
<el-select v-model="value" placeholder="请选择" style="width: 45%">
<el-option
v-for="item in options"
:key="item.value"
:label="item.label"
:value="item.value">
</el-option>
</el-select>
</el-col>
</el-row>
<el-row>
<el-col :span="4">
<div class="text">
<div style="color: #4b8fff">{{"赢单 : " + 0 + "元"}}</div>
<div style="margin-top: 12%;color: #ff4949">{{"输单 : " + 0 + "元"}}</div>
</div>
</el-col>
<el-col :span="3">
<div id="funnel"></div>
</el-col>
</el-row>
</div>
</template>
<script>
import * as echarts from 'echarts';
export default {
name: "RaddarChart_1",
data(){
return{
value:1,
options:[{value:1,label:"默认商机组"}]
}
},
mounted(){
let chartDom = document.getElementById('funnel');
let myChart = echarts.init(chartDom);
let option;
option = {
tooltip: {
trigger: 'item',
formatter: '{a} <br/>{b} : {c}%'
},
toolbox: {
feature: {
dataView: { readOnly: false },
restore: {},
saveAsImage: {}
}
},
legend: {
data: ['赢单', '输单',]
},
series: [
{
name: '销售漏斗',
type: 'funnel',
left: '20%',
top: 60,
bottom: 60,
width: '60%',
min: 0,
max: 100,
minSize: '0%',
maxSize: '70%',
sort: 'descending',
gap: 2,
label: {
show: true,
position: 'inside'
},
labelLine: {
length: 10,
lineStyle: {
width: 1,
type: 'solid'
}
},
itemStyle: {
borderColor: '#fff',
borderWidth: 1
},
emphasis: {
label: {
fontSize: 20
}
},
data: [
{ value: 60, name: '输单' },
{ value: 100, name: '赢单' }
]
}
]
};
option && myChart.setOption(option);
}
}
</script>
<style scoped>
#funnel{
width: 500px;
height: 500px;
margin-top: 60%;
}
.el-icon-caret-bottom{
font-size: 25px;
color: #ff4949;
}
.text{
margin-top: 250%;
}
</style>
<template>
  <div class="app-container">
    <el-row>
      <el-col :span="24">
        <i class="el-icon-data-line"></i>
        {{"销售趋势"}}
      </el-col>
    </el-row>

    <div style="margin-top: 5%">
        <el-row>
          <el-col :span="5">
            <span>{{"合同金额:"}}</span>
            <count-to :start-val="0" :end-val="0" :duration="2600" class="card-panel-num" />
          </el-col>

          <el-col :span="5">
            <span>{{"回款金额:"}}</span>
            <count-to :start-val="0" :end-val="0" :duration="2600" class="card-panel-num" />
          </el-col>
        </el-row>
    </div>

    <div id="trend"></div>
  </div>
</template>

<script>
import * as echarts from 'echarts';
import CountTo from 'vue-count-to'
export default {
  name: "BarChar_1",
  components: {
    CountTo
  },
  data(){
    return{

    }
  },
  mounted() {

    let app = {};

    let chartDom = document.getElementById('trend');
    let myChart = echarts.init(chartDom);
    let option;

    option = {
      legend: {},
      tooltip: {},
      dataset: {
        source: [
          ['product', '合同', '回款'],
          ['2023-1',],
          ['2023-3',],
          ['2023-5',],
          ['2023-7',],
          ['2023-9',],
          ['2023-11',]
        ]
      },
      xAxis: { type: 'category' },
      yAxis: {},
      // Declare several bar series, each will be mapped
      // to a column of dataset.source by default.
      series: [{ type: 'bar' }, { type: 'bar' }]
    };

    option && myChart.setOption(option);
  }
}
</script>

<style scoped>
#trend{
  width: 600px;
  height: 500px;
  margin-top: 1.3%;
}
.el-icon-data-line{
  font-size: 20px;
  color: #ff4949;
}
</style>


 1万+
1万+


 被折叠的 条评论
为什么被折叠?
被折叠的 条评论
为什么被折叠?
 到【灌水乐园】发言


