


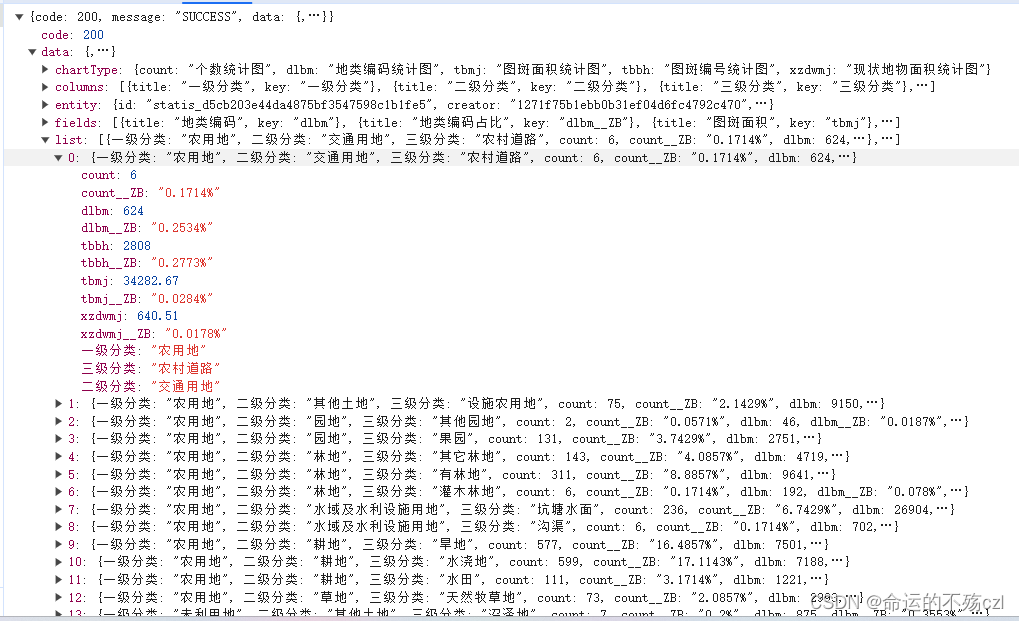
首先和后台约定返回的数据格式 (主要是这三个字段)
1.list 表格数据
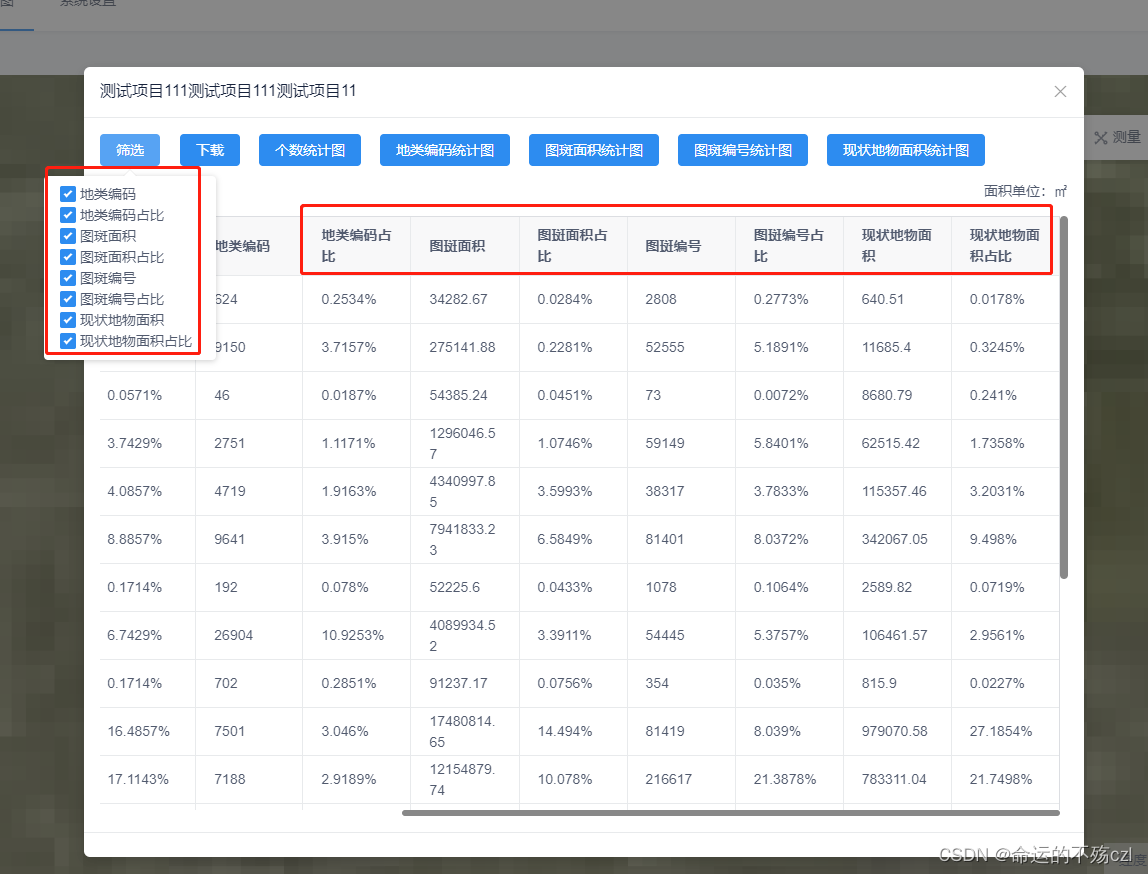
2.fields:可进行筛选的列
3.colums:所有需要展示的列
// 2024-03-22
<script>
import statisticalChart from './statisticalChart.vue'
const Prop = {
title: {
default: '',
type: String
}
}
export default {
name: '',
props: Prop,
mounted() { },
data() {
return {
spinShow: true,
modalShowChart: false,
modalChartTitle: '',
selectList: [],
checkColumns: [], //可显示隐藏列头
columns: [],// 全部列头
initialColumns: [],// 初始列头-除去可显示隐藏列头
tableData: [],
chartButtonGroup: [],
tableDataLength: '',
statisId: '',
clickList: [],
chartStyle: '',
openChart: ''
}
},
components: { statisticalChart },
methods: {
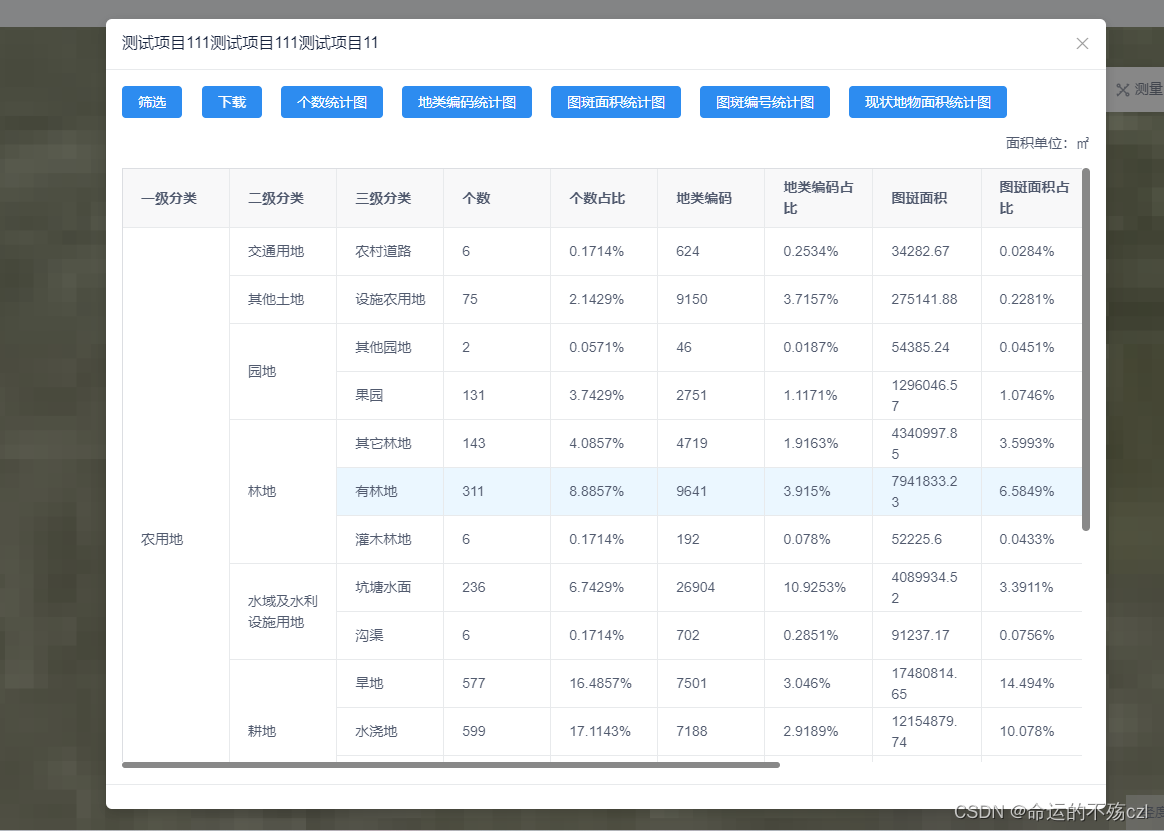
handleSpan({ row, column, rowIndex, columnIndex }) {
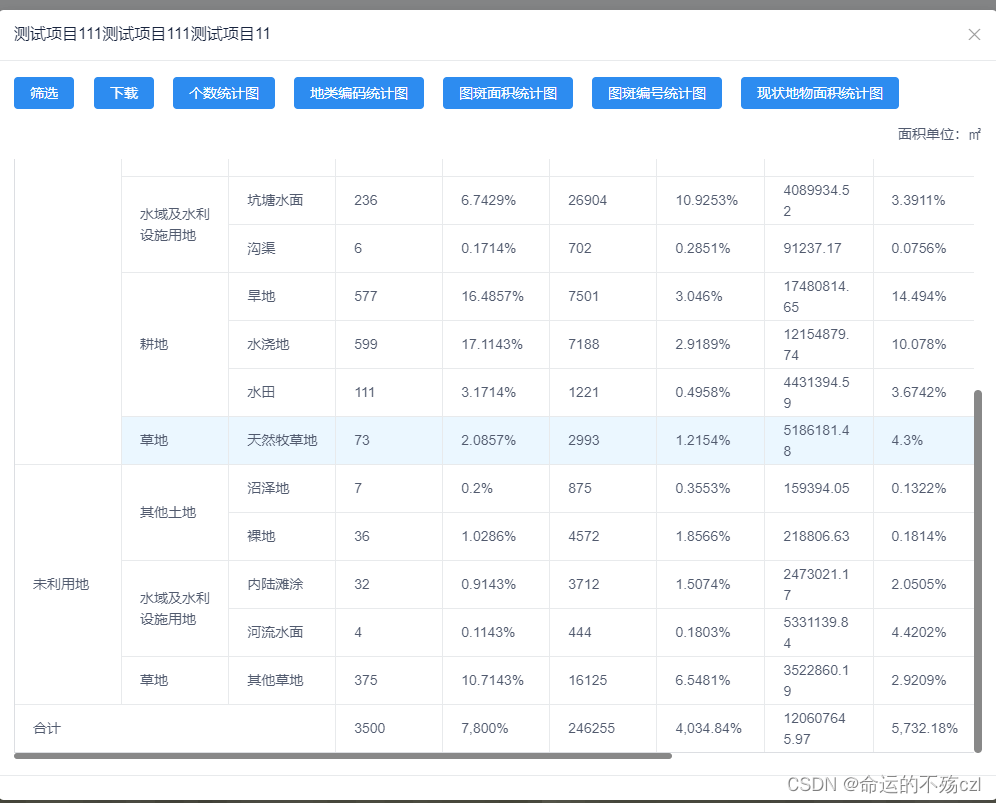
if (rowIndex === this.tableDataLength - 1 && columnIndex === 0) {
return [this.tableDataLength - 1, this.initialColumns.length - 2];
} else if (rowIndex === this.tableDataLength - 1 && columnIndex === 1 && this.initialColumns.length - 2 > 1) {
return [0, 0];
} else if (rowIndex === this.tableDataLength - 1 && columnIndex === 2 && this.initialColumns.length - 2 > 2) {
return [0, 0];
} else if (rowIndex === this.tableDataLength - 1 && columnIndex === 3 && this.initialColumns.length - 2 > 3) {
return [0, 0];
}
//合并第1列,这里columnIndex==0,根据需求的不同,需要前端写死(这里的需求是:行政区划-一级分类-二级分类-三级分类)
if (columnIndex == 0) {
//计算合并的行数列数
let x = row.mergeColumn == 0 ? 0 : row.mergeColumn
let y = row.mergeColumn == 0 ? 0 : 1
return [x, y]
}
if (columnIndex === 1 && this.initialColumns.length - 2 > 1) {
let x = row.mergeColTwo === 0 ? 0 : row.mergeColTwo;
let y = row.mergeColTwo === 0 ? 0 : 1;
return [x, y];
}
if (columnIndex === 2 && this.initialColumns.length - 2 > 2) {
let x = row.mergeColThree === 0 ? 0 : row.mergeColThree;
let y = row.mergeColThree === 0 ? 0 : 1;
return [x, y];
}
if (columnIndex === 3 && this.initialColumns.length - 2 > 3) {
let x = row.mergeColFour === 0 ? 0 : row.mergeColFour;
let y = row.mergeColFour === 0 ? 0 : 1;
return [x, y];
}
},
assembleData(data) {
let names = []
let columns0 = this.columns[0].key
//筛选出不重复的 name值,将其放到 names数组中
data.forEach(e => {
if (!names.includes(e[columns0])) {
names.push(e[columns0])
}
})
let nameNums = []
//将names数组中的 name值设置默认合并0个单元格,放到 nameNums中
names.forEach(e => {
nameNums.push({ [columns0]: e, num: 0 })
})
//计算每种 name值所在行需要合并的单元格数
data.forEach(e => {
nameNums.forEach(n => {
if (e[columns0] == n[[columns0]]) {
n.num++
}
})
})
//将计算后的合并单元格数整合到 data中
data.forEach(e => {
nameNums.forEach(n => {
if (e[columns0] == n[columns0]) {
if (names.includes(e[columns0])) {
e.mergeColumn = n.num
//删除已经设置过的值(防止被合并的单元格进到这个 if 语句中)
names.splice(names.indexOf(n[columns0]), 1)
} else {
//被合并的单元格设置为 0
e.mergeColumn = 0
}
}
})
})
if (this.initialColumns.length - 2 > 1) {
let columns1 = this.columns[1].key
//不唯一且重复的情况下,在唯一的基础上合并重复
for (let j = 0; j < data.length; j++) {
if (data[j].mergeColumn > 0) {
for (let k = 0; k < data[j].mergeColumn; k++) {
if (data[j + k].twoAlready !== 1) { // 需要这个条件,避免数据重复
if (k + 1 < data[j].mergeColumn) {
data[j + k].mergeColTwo = 1
for (let b = k + 1; b < data[j].mergeColumn; b++) {
if (data[j + k][columns1] === data[j + b][columns1]) {
data[j + k].mergeColTwo++;
data[j + b].mergeColTwo = 0;
data[j + b].twoAlready = 1;
} else {
break;
}
}
}
}
}
}
if (this.initialColumns.length - 2 > 2) {
let columns2 = this.columns[2].key
for (let j = 0; j < data.length; j++) {
if (data[j].mergeColumn > 1) {
for (let k = 0; k < data[j].mergeColumn; k++) {
if (data[j + k].threeAlready !== 1) { // 需要这个条件,避免数据重复
if (k + 1 < data[j].mergeColumn) {
data[j + k].mergeColThree = 1
for (let b = k + 1; b < data[j].mergeColumn; b++) {
if (data[j + k][columns2] === data[j + b][columns2]) {
data[j + k].mergeColThree++;
data[j + b].mergeColThree = 0;
data[j + b].threeAlready = 1;
} else {
break;
}
}
}
}
}
}
if (this.initialColumns.length - 2 > 3) {
let columns3 = this.columns[3].key
for (let j = 0; j < data.length; j++) {
if (data[j].mergeColumn > 2) {
for (let k = 0; k < data[j].mergeColumn; k++) {
if (data[j + k].fourAlready !== 1) { // 需要这个条件,避免数据重复
if (k + 1 < data[j].mergeColumn) {
data[j + k].mergeColFour = 1
for (let b = k + 1; b < data[j].mergeColumn; b++) {
if (data[j + k][columns3] === data[j + b][columns3]) {
data[j + k].mergeColFour++;
data[j + b].mergeColFour = 0;
data[j + b].fourAlready = 1;
} else {
break;
}
}
}
}
}
}
// 如果有需要再合并到row中 再合并的话代码添加到此处
}
}
}
}
}
}
//将整理后的数据交给表格渲染
this.tableData = data
},
getInfoData(id, clickList) {
this.statisId = id
this.clickList = clickList
this.spinShow = true
this.$http.post('runStatis', {
data: {
statisId: id,
xzqhList: clickList
}
}).then((res) => {
this.spinShow = false
if (res.code == 200) {
this.chartStyle = res.data.entity.chartStyle //区分统计图样式--饼状图 PIE,柱状图 BAR
this.openChart = res.data.entity.openChart //区分是否显示统计图--0不显示 1显示
this.columns = res.data.columns
this.selectList = res.data.fields
res.data.fields.forEach(element => {
this.checkColumns.push(element.key)
});
this.initialColumns = this.getDifferenceSetA(res.data.columns, res.data.fields)
let arr = []
for (let i in res.data.chartType) {
let obj = {
value: i,
label: res.data.chartType[i]
}
arr.push(obj)
}
this.chartButtonGroup = arr
this.tableDataLength = res.data.list.length
this.assembleData(res.data.list)
} else {
this.$Message.warning(res.message)
this.tableData = []
this.columns = []
this.chartButtonGroup = []
this.selectList = []
}
})
},
download() {
this.$refs.table.exportCsv({
filename: this.title
});
},
countChart(val) {
this.modalChartTitle = val.label
this.modalShowChart = true
let obj = {
chartInfo: val,
statisId: this.statisId,
clickList: this.clickList,
}
this.$refs.statisticalChartRef.initChart(obj)
},
getDifferenceSetA(arr1, arr2) {
arr1 = arr1.map(JSON.stringify);
arr2 = arr2.map(JSON.stringify);
return arr1.concat(arr2).filter(function (v, i, arr) {
return arr.indexOf(v) === arr.lastIndexOf(v);
}).map(JSON.parse)
},
checkChange(val) {
let newArr = this.selectList.filter((item) => {
return val.includes(item.key) == true
})
this.columns = this.initialColumns.concat(newArr)
}
},
computed: {},
watch: {}
}
</script>
<template>
<div class="content">
<div>
<Poptip v-if="selectList.length > 0" placement="bottom" trigger="hover" title="">
<Button type="primary">筛选</Button>
<div slot="content">
<CheckboxGroup v-for="item in selectList" v-model="checkColumns" @on-change="checkChange">
<Checkbox :label="item.key">{{item.title}}</Checkbox>
</CheckboxGroup>
</div>
</Poptip>
<Button style=" margin-left: 20px;" type="primary" @click="download">下载</Button>
<ButtonGroup v-if="chartButtonGroup.length > 0 && openChart == 1 " v-for=" (item,index) in chartButtonGroup">
<Button @click="countChart(item)" type="primary" style=" margin-left: 20px;">{{item.label}}</Button>
</ButtonGroup>
</div>
<div class="tableTitle">
面积单位:㎡
</div>
<div class="scrollable-table">
<Table class="Table" ref="table" border :columns="columns" :data="tableData" :span-method="handleSpan"></Table>
</div>
<!-- 统计图 -->
<Modal v-model="modalShowChart" width="600" :mask-closable="false" :title="modalChartTitle">
<statisticalChart ref="statisticalChartRef" :chartStyle="this.chartStyle" />
<div slot="footer">
</div>
</Modal>
<Spin size="large" fix v-if="spinShow"></Spin>
</div>
</template>
<style lang='less' scoped>
.content {
position: relative;
.tableTitle {
height: 50px;
display: flex;
flex-flow: row nowrap;
justify-content: flex-end;
align-items: center;
}
.scrollable-table {
overflow: auto;
max-height: 600px;
.Table {
width: 1400px;
}
}
/* 自定义滚动条样式 */
::-webkit-scrollbar {
display: initial !important;
width: 8px; /* 设置滚动条宽度 */
}
::-webkit-scrollbar-thumb {
background-color: #888; /* 设置滚动条 thumb 颜色 */
}
::-webkit-scrollbar-thumb:hover {
background-color: #555; /* 设置滚动条 hover 状态下 thumb 颜色 */
}
}
</style>


 684
684


 被折叠的 条评论
为什么被折叠?
被折叠的 条评论
为什么被折叠?
 到【灌水乐园】发言


