


十五、服务熔断Hystrix高级
我们都知道,当请求失败、被拒绝、超时的时候,都会进入到降级方法中,但是进入降级方法并不意味着断路器已经被打开了,那么如何才能了解断路器中的状态呢?
15.1 Hystrix的监控平台
-
Hystrix的监控平台
除了实现容错功能,Hystrix还提供了近乎实时的监控,HystrixCommand和HystrixObservableCommand在执行时,会生成执行结果和运行指标。比如每秒的请求数量,成功数量等。
这些状态会暴露在 Actuator 提供的 /health 端点中。只需为项目添加 spring-boot-actuator 依赖,重启项目,访问http://localhost:9021/actuator/hystrix.stream,即可看到实时的监控数据。

由此可见,Hystrix的监控平台虽然获取了实时的监控,但是访问 /hystrix.stream 接口获取的都是以文字形式展示的信息。
-
搭建Hystrix DashBoard监控
Hystrix的监控很难通过文字直观的展示系统的运行状态,所以Hystrix官方还提供了基于图形化DashBoard(仪表板)监控平台。Hystrix仪表板可以显示每个断路器(被@HystrixCommand注解的方法)的状态。
(1)引入依赖
<!--actuator用于心跳检查-->
<dependency>
    <groupId>org.springframework.boot</groupId>
    <artifactId>spring-boot-starter-actuator</artifactId>
</dependency>
<!-- Hystrix DashBoard监控 -->
<dependency>
    <groupId>org.springframework.cloud</groupId>
    <artifactId>spring-cloud-starter-netflix-hystrix</artifactId>
</dependency>
<dependency>
    <groupId>org.springframework.cloud</groupId>
    <artifactId>spring-cloud-starter-netflix-hystrix-dashboard</artifactId>
</dependency>
(2)添加EnableHystrixDashboard 注解
package cn.ebuy.order;
import org.springframework.boot.SpringApplication;
import org.springframework.boot.autoconfigure.SpringBootApplication;
import org.springframework.cloud.client.circuitbreaker.EnableCircuitBreaker;
import org.springframework.cloud.client.loadbalancer.LoadBalanced;
import org.springframework.cloud.netflix.hystrix.dashboard.EnableHystrixDashboard;
import org.springframework.cloud.openfeign.EnableFeignClients;
import org.springframework.context.annotation.Bean;
import org.springframework.web.client.RestTemplate;

@SpringBootApplication
@EnableFeignClients
@EnableCircuitBreaker //开启熔断器
//@SpringCloudApplication  此注解是上面三个注解的组合注解
@EnableHystrixDashboard  //激活仪表盘项目
public class OrderApplication {
	/**
	 * 配置RestTemplate交给spring管理
	 * 基于Ribbon的服务调用与负载均衡
	 * @return
	 */
	@Bean
	@LoadBalanced
	public RestTemplate restTemplate()
	{
		return new RestTemplate();
	}


	public static void main(String[] args) {
		SpringApplication.run(OrderApplication.class,args);
	}
}
(3)访问测试
输入路径访问:http://localhost:9021/hystrix

-
断路器聚合监控Turbine
在微服务架构体系中,每个服务都需要配置Hystrix DashBoard监控。如果每次只能查看单个实例的监控数据,就需要不断切换监控地址,这显然很不方便。要想看这个系统的Hystrix Dashboard数据就需要用到Hystrix Turbine。Turbine是一个聚合Hystrix 监控数据的工具,他可以将所有相关微服务的 Hystrix 监控数据聚合到一起,方便使用。引入Turbine后,整个监控系统架构如下:

创建ebuy-turbine模块:
(1)引入依赖<!-- 断路器聚合监控Turbine --> <dependency> <groupId>org.springframework.cloud</groupId> <artifactId>spring-cloud-starter-netflix-turbine</artifactId> </dependency> <!-- Hystrix DashBoard监控 --> <dependency> <groupId>org.springframework.cloud</groupId> <artifactId>spring-cloud-starter-netflix-hystrix</artifactId> </dependency> <dependency> <groupId>org.springframework.cloud</groupId> <artifactId>spring-cloud-starter-netflix-hystrix-dashboard</artifactId> </dependency>(2)配置多个微服务的hystrix监控
server:
  port: 8031 #端口
spring:
  application:
    name:  ebuy-turbine #服务名称
logging:
  level:
    cn.ebuy: DEBUG
#指定服务注册中心
eureka:
  client:
    service-url:
      defaultZone: http://127.0.0.1:8000/eureka/,http://127.0.0.1:9000/eureka/
  instance:
    prefer-ip-address: true #使用IP地址注册
    lease-expiration-duration-in-seconds: 10 #eureka client发送心跳给server端后,续约到期时间(默认90秒)
    lease-renewal-interval-in-seconds: 5 #发送心跳续约间隔
#指定监控的微服务列表
turbine:
  app-config: ebuy-order  #要监控的微服务列表
  cluster-name-expression: "'default'"
(3)配置启动类
package cn.ebuy.turbine;
import org.springframework.boot.SpringApplication;
import org.springframework.boot.autoconfigure.SpringBootApplication;
import org.springframework.cloud.netflix.hystrix.dashboard.EnableHystrixDashboard;
import org.springframework.cloud.netflix.turbine.EnableTurbine;
@SpringBootApplication
@EnableTurbine
@EnableHystrixDashboard //开启HystrixDashboard监控平台,并激活Turbine
public class TurbineApplication {

	public static void main(String[] args) {
		SpringApplication.run(TurbineApplication.class,args);
	}
}
(4)测试
浏览器访问:http://localhort:8031/hystrix 展示HystrixDashBoard,并在url位置输入:http://localhost:8031/turbine.stream,动态根据turbine.stream数据展示多个微服务的监控数据。

15.2 熔断器的状态
熔断器有三个状态 CLOSED 、 OPEN 、 HALF_OPEN 熔断器默认关闭状态,当触发熔断后状态变更为OPEN ,在等待到指定的时间,Hystrix会放请求检测服务是否开启,这期间熔断器会变为 HALF_OPEN 半开启状态,熔断探测服务可用则继续变更为 CLOSED 关闭熔断器。

- Closed:关闭状态(断路器关闭),所有请求都正常访问。代理类维护了最近调用失败的次数,如果某次调用失败,则使失败次数加1。如果最近失败次数超过了在给定时间内允许失败的阈值,则代理类切换到断开(Open)状态。此时代理开启了一个超时时钟,当该时钟超过了该时间,则切换到半断开(Half-Open)状态。该超时时间的设定是给了系统一次机会来修正导致调用失败的错误。
- Open:打开状态(断路器打开),所有请求都会被降级。Hystix会对请求情况计数,当一定时间内失败请求百分比达到阈值,则触发熔断,断路器会完全关闭。默认失败比例的阈值是50%,请求次数最少不低于20次。
- Half Open:半开状态,open状态不是永久的,打开后会进入休眠时间(默认是5S)。随后断路器会自动进入半开状态。此时会释放1次请求通过,若这个请求是健康的,则会关闭断路器,否则继续保持打开,再次进行5秒休眠计时。

15.3 熔断器的隔离策略
微服务使用 Hystrix 熔断器实现了服务的自动降级,让微服务具备自我保护的能力,提升了系统的稳定性,也较好的解决雪崩效应。其使用方式目前支持两种策略:
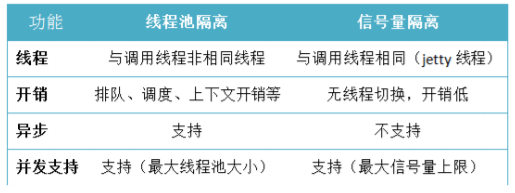
- 线程池隔离策略:使用一个线程池来存储当前的请求,线程池对请求作处理,设置任务返回处理超时时间,堆积的请求堆积入线程池队列。这种方式需要为每个依赖的服务申请线程池,有一定的资源消耗,好处是可以应对突发流量(流量洪峰来临时,处理不完可将数据存储到线程池队里慢慢处理)
- 信号量隔离策略:使用一个原子计数器(或信号量)来记录当前有多少个线程在运行,请求来先判断计数器的数值,若超过设置的最大线程个数则丢弃改类型的新请求,若不超过则执行计数操作请求来计数器+1,请求返回计数器-1。这种方式是严格的控制线程且立即返回模式,无法应对突发流量(流量洪峰来临时,处理的线程超过数量,其他的请求会直接返回,不继续去请求依赖的服务)
线程池和型号量两种策略功能支持对比如下:
- hystrix.command.default.execution.isolation.strategy : 配置隔离策略
- ExecutionIsolationStrategy.SEMAPHORE 信号量隔离
- ExecutionIsolationStrategy.THREAD 线程池隔离
- hystrix.command.default.execution.isolation.maxConcurrentRequests : 最大信号量上限


 585
585


 被折叠的 条评论
为什么被折叠?
被折叠的 条评论
为什么被折叠?
 到【灌水乐园】发言


