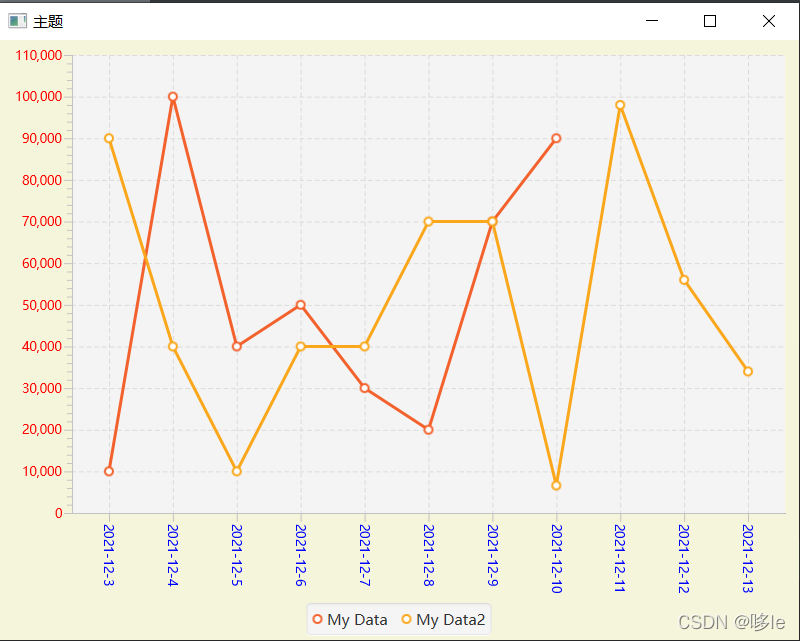
javafx实现折线图只需一个main方法

需要源码小伙伴可以到微信小程序:”MINIIT资源库“获取,作者承诺免费

上图

watermark,type_d3F5LXplbmhlaQ,shadow_50,text_Q1NETiBA5ZOGbGU=,size_20,color_FFFFFF,t_70,g_se,x_16

上代码

package com.doll.fxml;

import javafx.application.Application;
import javafx.geometry.Insets;
import javafx.scene.Scene;
import javafx.scene.chart.CategoryAxis;
import javafx.scene.chart.LineChart;
import javafx.scene.chart.NumberAxis;
import javafx.scene.chart.XYChart;
import javafx.scene.layout.StackPane;
import javafx.scene.paint.Color;
import javafx.stage.Stage;


public class LineChartDemo extends Application {

    @Override
    public void start(Stage primaryStage) throws Exception {
        CategoryAxis categoryAxis = new CategoryAxis();
        NumberAxis numberAxis = new NumberAxis();
        numberAxis.setTickLabelFill(Color.RED);
        categoryAxis.setTickLabelFill(Color.BLUE);

        XYChart.Series<String, Number> series = new XYChart.Series<>();
        series.setName("My Data");

        series.getData().add(new XYChart.Data<String, Number>("2021-12-2", 80000));
        series.getData().add(new XYChart.Data<String, Number>("2021-12-4", 90000));
        series.getData().add(new XYChart.Data<String, Number>("2021-12-6", 100000));
        series.getData().add(new XYChart.Data<String, Number>("2021-12-8", 110000));

        LineChart<String, Number> lineChart = new LineChart<>(categoryAxis, numberAxis);
        lineChart.getData().add(series);
        StackPane stackPane = new StackPane();
//        stackPane.setPadding(new Insets(15, 15, 15, 15));
        stackPane.setStyle("-fx-background-color: BEIGE");
        stackPane.getChildren().add(lineChart);

        Scene scene = new Scene(stackPane, 800, 600);
        primaryStage.setTitle("主题");
        primaryStage.setScene(scene);
        primaryStage.show();
    }


    public static void main(String[] args) {
        launch(args);
    }
}

  • 0
    点赞
  • 1
    收藏
    觉得还不错? 一键收藏
  • 打赏
    打赏
  • 0
    评论
ECharts是一个基于JavaScript的数据可视化库,而JavaFX一个现代的Java GUI工具包。为了在JavaFX中使用ECharts绘制折线图,可以使用WebView组件来嵌入ECharts JavaScript代码,并将数据传递给它。以下是一个简单的示例: 1. 首先,要下载并引入ECharts的JavaScript文件和JavaFX的WebEngine类。 2. 在JavaFX的FXML文件中创建一个WebView组件,并设置其大小和位置。 3. 在JavaFX的Controller类中,使用WebEngine加载ECharts的JavaScript文件,并在WebView中显示它。 4. 将数据传递给ECharts JavaScript代码,使用以下代码: ``` webEngine.executeScript("var data = " + data + ";"); ``` 5. 使用ECharts的API绘制折线图,例如: ``` webEngine.executeScript("var myChart = echarts.init(document.getElementById('chart'));" + "var option = {" + " xAxis: {" + " type: 'category'," + " data: data.xAxis" + " }," + " yAxis: {" + " type: 'value'" + " }," + " series: [{" + " data: data.series," + " type: 'line'" + " }]" + "};" + "myChart.setOption(option);"); ``` 其中,data是一个包含x轴和y轴数据的JSON对象。 完整的示例代码如下: FXML文件: ``` <?xml version="1.0" encoding="UTF-8"?> <?import javafx.scene.layout.*?> <?import javafx.scene.web.*?> <?import javafx.scene.control.*?> <BorderPane fx:controller="sample.Controller" xmlns:fx="http://javafx.com/fxml" > <center> <WebView fx:id="webView" prefHeight="400.0" prefWidth="600.0" /> </center> </BorderPane> ``` Controller类: ``` package sample; import javafx.fxml.FXML; import javafx.scene.web.WebEngine; import javafx.scene.web.WebView; public class Controller { @FXML private WebView webView; public void initialize() { WebEngine webEngine = webView.getEngine(); webEngine.load(getClass().getResource("echarts.html").toExternalForm()); String data = "{" + " \"xAxis\": [\"Mon\", \"Tue\", \"Wed\", \"Thu\", \"Fri\", \"Sat\", \"Sun\"]," + " \"series\": [820, 932, 901, 934, 1290, 1330, 1320]" + "}"; webEngine.executeScript("var data = " + data + ";"); webEngine.executeScript("var myChart = echarts.init(document.getElementById('chart'));" + "var option = {" + " xAxis: {" + " type: 'category'," + " data: data.xAxis" + " }," + " yAxis: {" + " type: 'value'" + " }," + " series: [{" + " data: data.series," + " type: 'line'" + " }]" + "};" + "myChart.setOption(option);"); } } ``` echarts.html文件: ``` <!DOCTYPE html> <html> <head> <meta charset="UTF-8"> <title>ECharts Example</title> <script src="https://cdn.jsdelivr.net/npm/echarts/dist/echarts.min.js"></script> </head> <body> <div id="chart" style="width: 100%; height: 100%;"></div> </body> </html> ``` 运行JavaFX程序后,将会显示一个包含折线图的WebView组件。

“相关推荐”对你有帮助么?

  • 非常没帮助
  • 没帮助
  • 一般
  • 有帮助
  • 非常有帮助
提交
评论
添加红包

请填写红包祝福语或标题

红包个数最小为10个

红包金额最低5元

当前余额3.43前往充值 >
需支付:10.00
成就一亿技术人!
领取后你会自动成为博主和红包主的粉丝 规则
hope_wisdom
发出的红包

打赏作者

哆le

一分两分也是爱,不求多哈哈哈

¥1 ¥2 ¥4 ¥6 ¥10 ¥20
扫码支付:¥1
获取中
扫码支付

您的余额不足,请更换扫码支付或充值

打赏作者

实付
使用余额支付
点击重新获取
扫码支付
钱包余额 0

抵扣说明:

1.余额是钱包充值的虚拟货币,按照1:1的比例进行支付金额的抵扣。
2.余额无法直接购买下载,可以购买VIP、付费专栏及课程。

余额充值