


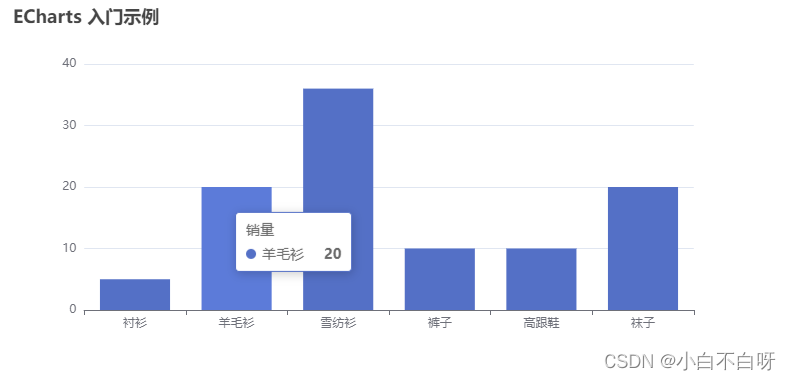
效果图大致如下:
首先在项目中安装 echarts,可以在page.json文件中查看是否安装成功
npm i echarts --save在需要使用的组件中引入echarts
import * as echarts from 'echarts'
首选顶一个容器来承载echarts图标,这里使用的%单位,为了接下来实现图标尺寸自适应
<div id="main" ref="chart" style="width:40%;height:376px"></div>在mounted生命周期中进行配置,注意必须要在mounted周期中进行配置
 const chart = this.$refs.chart;
这里是使用了ref来获取容器dom,也可以使用document.getElementById('main')来获取
        var myChart = echarts.init(chart);
        myChart.setOption({
        title: {
            text: "ECharts 入门示例"
        },
        tooltip: {},
        xAxis: {
            data: ["衬衫", "羊毛衫", "雪纺衫", "裤子", "高跟鞋", "袜子"]
        },
        yAxis: {},
        series: [
            {
            name: "销量",
            type: "bar",
            data: [5, 20, 36, 10, 10, 20]
            }
        ]
        });
定义监听事件,来监听尺寸变化,来调用echarts中resize()方法来实现尺寸自适应
  resizeChart(){
     myChart && myChart.resize()
   }
完整代码如下,可直接复制
<template>
  <div id="main" ref="chart" style="width:40%;height:376px"></div>
</template>

<script>
import * as echarts from "echarts";
export default {
    mounted() {
        const chart = this.$refs.chart;
        var myChart = echarts.init(chart);
        myChart.setOption({
        title: {
            text: "ECharts 入门示例"
        },
        tooltip: {},
        xAxis: {
            data: ["衬衫", "羊毛衫", "雪纺衫", "裤子", "高跟鞋", "袜子"]
        },
        yAxis: {},
        series: [
            {
            name: "销量",
            type: "bar",
            data: [5, 20, 36, 10, 10, 20]
            }
        ]
        });
        //对图表进行自适应处理
        window.addEventListener('resize',resizeChart)
    },
    //在destrored周期中对监听事件进行销毁,避免内存泄漏
    destroyed(){
        myChart && myChart.dispose() // dispose方法可以让你在不需要使用某个对象时,主动地释放它占用的资源,而不用等待垃圾回收器的自动回收。
        window.removeEventListener('resize',resizeChart)
    },
    methods:{
        resizeChart(){
          myChart && myChart.resize()
     }
    }
};
</script>

<style>

</style>
有任何问题,请私信!!!


 1393
1393


 被折叠的 条评论
为什么被折叠?
被折叠的 条评论
为什么被折叠?
 到【灌水乐园】发言


