


首先准备一个PPT模版 里面可以创建一写内容 比如:文本框、柱状图 、折线图 或者说组合图等等
然后图表属性都有一个title属性(结合上期的一起看):
chart.getTitleShape()文本框的话可以添加一下初始内容用于分别,如:#info等等
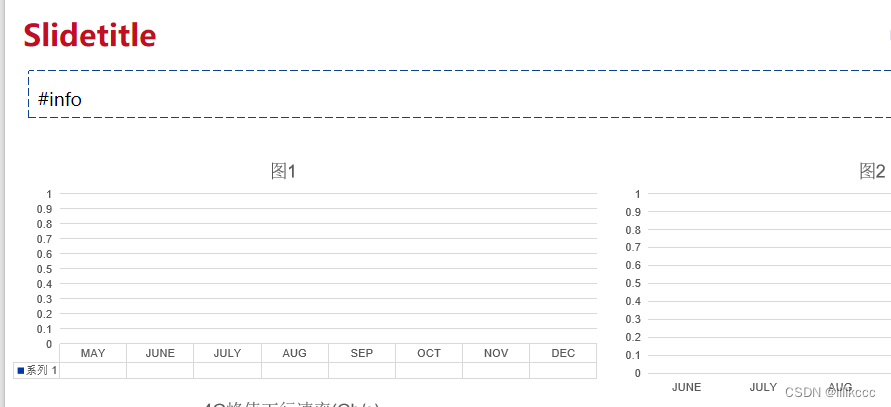
比如下面 这是就是准备的一个PPT模版
Slidetitle:是每个幻灯片的标题 每个幻灯片类(XSLFSlide)都有一个标题属性
#info:是这个文本框内容 多个文本框想要准确的识别到 要将内容替换一下
图1、图2:是图表的标题 根据这个标题来给同个幻灯片下的不同图表进行赋值
下面开始代码:
1.首先读取上面准备的PPT模版
MODEL_PATH:PPT模版路径
/**
     * 读取PPT模板
     *
     * @return XMLSlideShow
     */
    public static XMLSlideShow invokePPTModel() {
        XMLSlideShow xmlSlideShow;
        try {
            InputStream fis = ResourceUtils.getURL(MODEL_PATH).openStream();
            xmlSlideShow = new XMLSlideShow(fis);
            fis.close();
        } catch (IOException e) {
            throw new BusinessException("[invokePPTModel method:Template initialization failed]");
        }
        return xmlSlideShow;
    }
2.开始操作PPT对象
slideDataMap:数据集<幻灯片title,数据>
/**
     * 填充模板内容
     *
     * @param xmlSlideShow
     * @param slideDataMap 所有数据
     */
    public static void PPTInitContent(XMLSlideShow xmlSlideShow, Map<String, SlideData> slideDataMap) {
        List<XSLFSlide> slides = xmlSlideShow.getSlides();
        for (int i = 0; i < slides.size(); i++) {
            //幻灯片的数量应该与slideDataMap的size相同
            XSLFSlide slide = slides.get(i);
            //获取幻灯片标题
            String slideTitle = slide.getTitle();
            //获取幻灯片数据  每次循环 根据不同的幻灯片主题去拿数据
            SlideData pptSlideData = slideDataMap.get(slideTitle);
            setSlideContent(pptSlideData, slide);
        }
    }
/**
* 设置幻灯片内容
*
* @param slideData
* @param slide
*/
public static void setSlideContent(SlideData slideData, XSLFSlide slide) {
Map<String, GraphData> graphDataMap = slideData.getGraphDataMap();
for (XSLFShape shape : slide.getShapes()) {
// 判断图形元素是否是图表类型
if (shape instanceof XSLFGraphicFrame) {
XSLFChart chart = ((XSLFGraphicFrame) shape).getChart();
GraphData graphData = graphDataMap.get(chart.getTitleShape().getText());
updateChart(chart, graphData);
}
if (shape instanceof XSLFTextShape) {
XSLFTextShape textShape = (XSLFTextShape) shape;
if (textShape.getText().equals("#info")) {
//替换文本
textShape.setText("");
List<Map.Entry<String, String>> textDataList = slideData.getTextDataList();
for (Map.Entry<String, String> entry : textDataList) {
//设置文本和格式 #enter#定义为换行文本 后面定义为常量
setTextAndStyle(textShape, entry.getValue(), entry.getKey(), 14.0, entry.getValue().contains(PPTConstant.IS_ENTER));
}
//设置锚点 即文本框的左上角(x,y)和宽高
textShape.setAnchor(new Rectangle2D.Double(10, 55, 900, 100));
//调整文本框大小适应文本
textShape.setTextAutofit(TextShape.TextAutofit.SHAPE);
textShape.resizeToFitText();
}
}
}
} /**
* 设置文本和格式
*
* @param textShape 文本对象
* @param text 文本
* @param color 文本颜色
* @param size 文本大小
* @param newParagraph 是否为新段落
*/
public static void setTextAndStyle(XSLFTextShape textShape, String text, String color, Double size, boolean newParagraph) {
if (newParagraph) {
text = text.replace(PPTConstant.IS_ENTER, "");
}
XSLFTextRun xslfTextRun = textShape.appendText(text, newParagraph);
xslfTextRun.setFontColor(colorMap.get(color));
xslfTextRun.setFontSize(size);
// 设置字体为微软雅黑
xslfTextRun.setFontFamily("微软雅黑");
} /**
* 更新图表 支持组合图(折线+柱状) 单种多系列图
*
* @param chart
* @throws Exception
*/
public static void updateChart(XSLFChart chart, GraphData graphData) {
String chartTitle = chart.getTitleShape().getText();
//设置图形标题
chart.setTitleText(graphData.getGraphName());
XSSFWorkbook workbook;
try {
workbook = chart.getWorkbook();
if (Objects.isNull(workbook)) {
workbook = new XSSFWorkbook();
}
XSSFSheet sheetAt = workbook.getSheetAt(0);
if (Objects.isNull(sheetAt)) {
sheetAt = workbook.createSheet();
}
//图表区
CTChart ctChart = chart.getCTChart();
//单图:柱状图、折线图 可以用多个系列数据
if (!CollectionUtils.isEmpty(graphData.getSerList())) {
if (chartTitle.contains(PPTConstant.CHART_TYPE_BAR)) {
//执行更新图表中的bar的数据refreshBarGraph
refreshBarGraph(ctChart, sheetAt, graphData.getSerList());
}
if (chartTitle.contains(PPTConstant.CHART_TYPE_LINE)) {
//执行更新图表中的line的数据refreshLineGraph
refreshLineGraph(ctChart, sheetAt, graphData.getSerList());
}
}
//组合图
if (!CollectionUtils.isEmpty(graphData.getSerMap()) && chartTitle.equals(PPTConstant.CHART_TYPE_LINE_AND_BAR)) {
//执行更新图表中的bar的数据refreshBarGraph
refreshBarGraph(ctChart, sheetAt, graphData.getSerMap().get(PPTConstant.CHART_TYPE_BAR));
//执行更新图表中的line的数据refreshLineGraph
refreshLineGraph(ctChart, sheetAt, graphData.getSerMap().get(PPTConstant.CHART_TYPE_LINE));
XDDFChartData xddfChartData = chart.getChartSeries().get(0);
//设置Y轴最小值 间隔自动调整
xddfChartData.getValueAxes().get(0).setMinimum(0);
}
//更新嵌入的workbook
POIXMLDocumentPart xlsPart = chart.getRelations().get(0);
OutputStream xlsOut = xlsPart.getPackagePart().getOutputStream();
workbook.write(xlsOut);
xlsOut.close();
} catch (Exception e) {
throw 异常类
}
} /**
* 刷新柱状图
*
* @param ctChart
* @param sheetAt
* @param serList
*/
public static void refreshBarGraph(CTChart ctChart, XSSFSheet sheetAt, List<SeriesData> serList) {
//绘图区
CTPlotArea plotArea = ctChart.getPlotArea();
CTBarChart ctBarChart = plotArea.getBarChartList().get(0);
if (ObjectUtil.isNotEmpty(ctBarChart)) {
CTBarSer[] serArray = ctBarChart.getSerArray();
for (int i = 0; i < serArray.length; i++) {
//设置系列名称
CTSerTx tx = serArray[i].getTx();
tx.setV(StringUtils.isBlank(serList.get(i).getSeriesName()) ? "" : serList.get(i).getSeriesName());
// 获取轴
CTAxDataSource cat = serArray[i].getCat();
// 获取图表的值
CTNumDataSource val = serArray[i].getVal();
refreshGraphContent(sheetAt, cat, val, serList.get(i).getPointDataList(), i + 1);
}
}
} /**
* 刷新折线图
*
* @param ctChart
* @param sheetAt
* @param serList
*/
public static void refreshLineGraph(CTChart ctChart, XSSFSheet sheetAt, List<SeriesData> serList) {
//绘图区
CTPlotArea plotArea = ctChart.getPlotArea();
CTLineChart lineChart = plotArea.getLineChartList().get(0);
if (ObjectUtil.isNotEmpty(lineChart)) {
CTLineSer[] serArray = lineChart.getSerArray();
for (int i = 0; i < serArray.length; i++) {
//设置系列名
CTSerTx tx = serArray[i].getTx();
tx.setV(serList.get(i).getSeriesName());
// 获取轴
CTAxDataSource cat = serArray[i].getCat();
// 获取图表的值
CTNumDataSource val = serArray[i].getVal();
refreshGraphContent(sheetAt, cat, val, serList.get(i).getPointDataList(), i + 1);
}
}
} /**
* 具体刷新图表内容操作
*
* @param sheet
* @param cat
* @param val
* @param serList
*/
public static void refreshGraphContent(Sheet sheet, CTAxDataSource cat, CTNumDataSource val, List<PointData> serList, int column) {
CTStrData axisData = cat.getStrRef().getStrCache();
CTNumData numData = val.getNumRef().getNumCache();
// 将轴置空
axisData.setPtArray(null);
// 将值置空
numData.setPtArray(null);
// 重新设置数据
long idx = 0;
int rownum = 1;
for (PointData pointData : serList) {
CTNumVal numVal = numData.addNewPt();
numVal.setIdx(idx);
numVal.setV(pointData.getPointVal() + "");
CTStrVal sVal = axisData.addNewPt();
sVal.setIdx(idx);
sVal.setV(pointData.getPointName());
idx++;
Row row = sheet.getRow(rownum);
if (ObjectUtil.isEmpty(row)) {
row = sheet.createRow(rownum++);
} else {
rownum++;
}
row.createCell(0).setCellValue(pointData.getPointName());
row.createCell(column).setCellValue(pointData.getPointVal());
}
numData.getPtCount().setVal(idx);
axisData.getPtCount().setVal(idx);
//更新数据源的公式 框定工作簿的范围
String numDataRange = new CellRangeAddress(1, rownum - 1, column, column).formatAsString(sheet.getSheetName(), true);
val.getNumRef().setF(numDataRange);
String axisDataRange = new CellRangeAddress(1, rownum - 1, 0, 0).formatAsString(sheet.getSheetName(), true);
cat.getStrRef().setF(axisDataRange);
}最后就是把这个PPT对象写到本地咯
下面就是定义的一些数据结构
/**
 * @author liukun
 * @date 2024/1/18
 */
@ApiModel(description = "PPT-单点数据-代表一个数据一条数据")
public class PointData {
    @ApiModelProperty(value = "轴值")
    private String pointName;

    @ApiModelProperty(value = "数值")
    private double pointVal;

    public PointData(String serName, double serVal)
    {
        this.pointName = serName;
        this.pointVal = serVal;
    }

    public String getPointName()
    {
        return pointName;
    }

    public double getPointVal()
    {
        return pointVal;
    }

    public void setPointName(String pointName) {
        this.pointName = pointName;
    }

    public void setPointVal(double pointVal) {
        this.pointVal = pointVal;
    }
}
/**
* @author liukun
* @date 2024/1/15
*/
@ApiModel(description = "PPT-图表数据-代表图表的一个系列")
public class SeriesData {
@ApiModelProperty(value = "系列名")
private String seriesName;
@ApiModelProperty(value = "系列值")
private List<PointData> pointDataList;
public SeriesData(String seriesName, List<PointData> pointDataList) {
this.seriesName = seriesName;
this.pointDataList = pointDataList;
}
public String getSeriesName() {
return seriesName;
}
public void setSeriesName(String seriesName) {
this.seriesName = seriesName;
}
public List<PointData> getPointDataList() {
return pointDataList;
}
public void setPointDataList(List<PointData> pointDataList) {
this.pointDataList = pointDataList;
}
}/**
* @author liukun
* @date 2024/1/15
*/
@ApiModel(description = "PPT-图表整体数据-代表一个图表")
public class GraphData {
@ApiModelProperty(value = "图表主题/名称")
private String graphName;
@ApiModelProperty(value = "图表数据")
private List<SeriesData> serList;
@ApiModelProperty(value = "组合图表数据")
private Map<String,List<SeriesData>> serMap;
public void setGraphName(String graphName) {
this.graphName = graphName;
}
public void setSerList(List<SeriesData> serList) {
this.serList = serList;
}
public Map<String, List<SeriesData>> getSerMap() {
return serMap;
}
public void setSerMap(Map<String, List<SeriesData>> serMap) {
this.serMap = serMap;
}
public GraphData() {
}
public GraphData(String title, List<SeriesData> serList, Map<String, List<SeriesData>> serMap) {
this.graphName = title;
this.serList = serList;
this.serMap = serMap;
}
public GraphData(String title, List<SeriesData> serList)
{
this.graphName = title;
this.serList = serList;
}
public String getGraphName()
{
return graphName;
}
public List<SeriesData> getSerList()
{
return serList;
}
}/**
* @author liukun
* @date 2024/1/16
*/
@ApiModel(description = "PPT-幻灯片数据-代表一个幻灯片")
public class SlideData {
@ApiModelProperty(value = "图表数据<图表主题(chartTitle),数据>")
Map<String, GraphData> graphDataMap;
@ApiModelProperty(value = "文本数据")
List<Map.Entry<String, String>> textDataList;
public List<Map.Entry<String, String>> getTextDataList() {
return textDataList;
}
public void setTextDataList(List<Map.Entry<String, String>> textDataList) {
this.textDataList = textDataList;
}
public Map<String, GraphData> getGraphDataMap() {
return graphDataMap;
}
public void setGraphDataMap(Map<String, GraphData> graphDataMap) {
this.graphDataMap = graphDataMap;
}
}文本替换的很简单就不细写
然后一些常量: 自己定义 就是基本和你模版上面的一样
/**
 * @author liukun
 * @date 2024/1/15
 */
@ApiModel(description = "PPT文件常量")
public class PPTConstant {
    public static final String SLIDE_01 = " ";
    public static final String SLIDE_02 = " ";
    public static final String SLIDE_03 = " ";
    public static final String SLIDE_01_CHART_01 = "  ";
    public static final String SLIDE_01_CHART_02 = " ";
    public static final String SLIDE_01_CHART_03 = " ";
    public static final String SLIDE_01_CHART_04 = " ";
    public static final String SLIDE_02_CHART_01 = " ";
    public static final String SLIDE_02_CHART_02 = " ";
    public static final String SLIDE_02_CHART_03 = " ";
    public static final String SLIDE_02_CHART_04 = " ";
    public static final String SLIDE_03_CHART_01 = " ";
    public static final String SLIDE_03_CHART_02 = " ";
    public static final String SLIDE_03_CHART_03 = " ";
    public static final String SLIDE_03_CHART_04 = " ";
    public static final String TEXT_INFO = "#info";
    public static final String CHART_TYPE_BAR = "bar";
    public static final String CHART_TYPE_LINE = "line";
    public static final String CHART_TYPE_LINE_AND_BAR = "line_bar";
    public static final String IS_ENTER = "#enter#";
    public static final String COLOR_BLACK = "black";
    public static final String COLOR_RED = "red";

}


 3624
3624

 被折叠的 条评论
为什么被折叠?
被折叠的 条评论
为什么被折叠?
 到【灌水乐园】发言


