


之前来说目标检测实时性好,但是想要有更好的剔除效果,所以准备使用实例分割。
实例分割怎么选择,一般来说YOLO系列会比较好点,但是TensorRT没部署过,然后代码也不太会。然后就看到了借助NCNN框架的ros环境下部署seg。
这次准备直接在系统装了,也不用docker了,还是一样,先装下cuda套件。
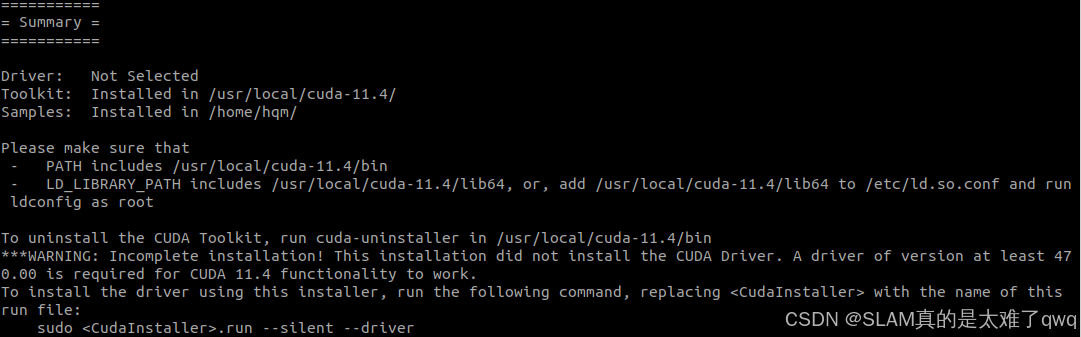
之前有教程,还是一样装的是11.4,适配自己版本。
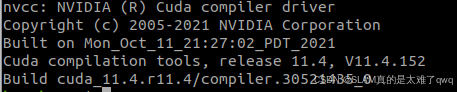
装完用nvcc --version检查一下,记得添加到环境变量里面。
用roslaunch启动
roslaunch sg-slam tum_offline.launchsudo apt update
sudo apt install libpcl-dev pcl-tools装一下可以看点云
pcl_viewer your_point_cloud_file.pcd用这个指令可以直接查看pcd后缀文件
启动之后都跑不了直接报错,然后
可以查看支持gpu加速的
Devices - Vulkan Hardware Database by Sascha Willems
然后有些调试需要关掉一些显示,可以在Viewer里面看一看,这次我准备把特征点的显示关掉看一下。然后刚说的文件里面看了下后,找到 FrameDrawer::DrawFrame()中
else if(state==Tracking::OK) //TRACKING
    {
        mnTracked=0;
        mnTrackedVO=0;
        const float r = 5;
        const int n = vCurrentKeys.size();
        for(int i=0;i<n;i++)
        {
            if(vbVO[i] || vbMap[i])
            {
                cv::Point2f pt1,pt2;
                pt1.x=vCurrentKeys[i].pt.x-r;
                pt1.y=vCurrentKeys[i].pt.y-r;
                pt2.x=vCurrentKeys[i].pt.x+r;
                pt2.y=vCurrentKeys[i].pt.y+r;

                // This is a match to a MapPoint in the map
                if(vbMap[i])
                {
                cv::rectangle(im,pt1,pt2,cv::Scalar(0,255,0));
                cv::circle(im,vCurrentKeys[i].pt,2,cv::Scalar(0,255,0),-1);
                    mnTracked++;
                }
                else // This is match to a "visual odometry" MapPoint created in the last frame
                {
                cv::rectangle(im,pt1,pt2,cv::Scalar(255,0,0));
                cv::circle(im,vCurrentKeys[i].pt,2,cv::Scalar(255,0,0),-1);
                    mnTrackedVO++;
                }
不需要特征点显示,就可以把cv::recrangle和circle那两行注释掉。
然后有些文章评估精度的时候是用TUM自带的评估工具的,用的都是py2,可以重构一下。然后调用脚本的命令,我只需要保存图,其他的我就删掉了。
python3 evaluate.py w_xyz.txt ours_w_xyz.txt --offset 0.0 --scale 1.0 --max_difference 0.02 --save --plot result_ate.png --verbose
这个是evaluate.py
#!/usr/bin/env python3


"""
This script computes the absolute trajectory error from the ground truth
trajectory and the estimated trajectory.
"""

import sys
import numpy as np
import argparse
import associate
import matplotlib
matplotlib.use('Agg')  # 使用非交互式后端
import matplotlib.pyplot as plt

def align(model, data):
    """Align two trajectories using the method of Horn (closed-form).

    Input:
    model -- first trajectory (3xn)
    data -- second trajectory (3xn)

    Output:
    rot -- rotation matrix (3x3)
    trans -- translation vector (3x1)
    trans_error -- translational error per point (1xn)

    """
    np.set_printoptions(precision=3, suppress=True)
    model_zerocentered = model - model.mean(1)
    data_zerocentered = data - data.mean(1)

    W = np.zeros((3, 3))
    for column in range(model.shape[1]):
        W += np.outer(model_zerocentered[:, column], data_zerocentered[:, column])
    U, d, Vh = np.linalg.svd(W.T)
    S = np.identity(3)
    if np.linalg.det(U) * np.linalg.det(Vh) < 0:
        S[2, 2] = -1
    rot = U @ S @ Vh
    trans = data.mean(1) - rot @ model.mean(1)

    model_aligned = rot @ model + trans
    alignment_error = model_aligned - data

    trans_error = np.sqrt(np.sum(np.multiply(alignment_error, alignment_error), 0)).A[0]

    return rot, trans, trans_error

def plot_traj(ax, stamps, traj, style, color, label):
    """
    Plot a trajectory using matplotlib.

    Input:
    ax -- the plot
    stamps -- time stamps (1xn)
    traj -- trajectory (3xn)
    style -- line style
    color -- line color
    label -- plot legend

    """
    stamps.sort()
    interval = np.median([s - t for s, t in zip(stamps[1:], stamps[:-1])])
    x = []
    y = []
    last = stamps[0]
    for i in range(len(stamps)):
        if stamps[i] - last < 2 * interval:
            x.append(traj[i][0])
            y.append(traj[i][1])
        elif len(x) > 0:
            ax.plot(x, y, style, color=color, label=label)
            label = ""
            x = []
            y = []
        last = stamps[i]
    if len(x) > 0:
        ax.plot(x, y, style, color=color, label=label)

if __name__ == "__main__":
    # parse command line
    parser = argparse.ArgumentParser(description='''
    This script computes the absolute trajectory error from the ground truth trajectory and the estimated trajectory.
    ''')
    parser.add_argument('first_file', help='ground truth trajectory (format: timestamp tx ty tz qx qy qz qw)')
    parser.add_argument('second_file', help='estimated trajectory (format: timestamp tx ty tz qx qy qz qw)')
    parser.add_argument('--offset', help='time offset added to the timestamps of the second file (default: 0.0)', default=0.0)
    parser.add_argument('--scale', help='scaling factor for the second trajectory (default: 1.0)', default=1.0)
    parser.add_argument('--max_difference', help='maximally allowed time difference for matching entries (default: 0.02)', default=0.02)
    parser.add_argument('--save', help='save aligned second trajectory to disk (format: stamp2 x2 y2 z2)')
    parser.add_argument('--save_associations', help='save associated first and aligned second trajectory to disk (format: stamp1 x1 y1 z1 stamp2 x2 y2 z2)')
    parser.add_argument('--plot', help='plot the first and the aligned second trajectory to an image (format: pdf)')
    parser.add_argument('--verbose', help='print all evaluation data (otherwise, only the RMSE absolute translational error in meters after alignment will be printed)', action='store_true')
    args = parser.parse_args()

    first_list = associate.read_file_list(args.first_file)
    second_list = associate.read_file_list(args.second_file)

    matches = associate.associate(first_list, second_list, float(args.offset), float(args.max_difference))
    if len(matches) < 2:
        sys.exit("Couldn't find matching timestamp pairs between groundtruth and estimated trajectory! Did you choose the correct sequence?")

    first_xyz = np.matrix([[float(value) for value in first_list[a][0:3]] for a, b in matches]).T
    second_xyz = np.matrix([[float(value) * float(args.scale) for value in second_list[b][0:3]] for a, b in matches]).T
    rot, trans, trans_error = align(second_xyz, first_xyz)

    second_xyz_aligned = rot @ second_xyz + trans

    first_stamps = list(first_list.keys())
    first_stamps.sort()
    first_xyz_full = np.matrix([[float(value) for value in first_list[b][0:3]] for b in first_stamps]).T

    second_stamps = list(second_list.keys())
    second_stamps.sort()
    second_xyz_full = np.matrix([[float(value) * float(args.scale) for value in second_list[b][0:3]] for b in second_stamps]).T
    second_xyz_full_aligned = rot @ second_xyz_full + trans

    if args.verbose:
        print(f"compared_pose_pairs {len(trans_error)} pairs")

        print(f"absolute_translational_error.rmse {np.sqrt(np.dot(trans_error, trans_error) / len(trans_error))} m")
        print(f"absolute_translational_error.mean {np.mean(trans_error)} m")
        print(f"absolute_translational_error.median {np.median(trans_error)} m")
        print(f"absolute_translational_error.std {np.std(trans_error)} m")
        print(f"absolute_translational_error.min {np.min(trans_error)} m")
        print(f"absolute_translational_error.max {np.max(trans_error)} m")
    else:
        print(f"{np.sqrt(np.dot(trans_error, trans_error) / len(trans_error))}")

    if args.save_associations:
        with open(args.save_associations, "w") as file:
            file.write("\n".join([f"{a} {x1} {y1} {z1} {b} {x2} {y2} {z2}" for (a, b), (x1, y1, z1), (x2, y2, z2) in zip(matches, first_xyz.T.A, second_xyz_aligned.T.A)]))

    if args.save:
        with open(args.save, "w") as file:
            file.write("\n".join([f"{stamp} {' '.join(map(str, line))}" for stamp, line in zip(second_stamps, second_xyz_full_aligned.T.A)]))

    if args.plot:
        fig = plt.figure(figsize=(10, 8), dpi=300)  # 设置图像大小和分辨率
        ax = fig.add_subplot(111)
        plot_traj(ax, first_stamps, first_xyz_full.T.A, '-', "black", "ground truth")
        plot_traj(ax, second_stamps, second_xyz_full_aligned.T.A, '-', "blue", "estimated")

        label = "difference"
        for (a, b), (x1, y1, z1), (x2, y2, z2) in zip(matches, first_xyz.T.A, second_xyz_aligned.T.A):
            ax.plot([x1, x2], [y1, y2], '-', color="red", label=label)
            label = ""

        ax.legend()

        ax.set_xlabel('x [m]')
        ax.set_ylabel('y [m]')
        plt.axis('equal')
        plt.grid(True)
        plt.tight_layout()  # 自动调整子图参数,使布局更紧凑

        # 保存为PDF格式
        plt.savefig(args.plot, format="pdf", bbox_inches='tight')
        print(f"Trajectory plot saved to {args.plot}")
还有个associate.py只要对应上就好了
画多个轨迹图对比
evo_traj tum ORB-SLAM2.txt SG-SLAM.txt xxxx-SLAM.txt --ref=groundtruth.txt -p --plot_mode=xyz -a
可以选择-a对齐。
关于写作的时候吧,也是记录一下,到时候来回顾。
首先就是引言和相关工作,以及结论、摘要都是要对应起来的。
简单的来说其实就是背景,提出总的改进,然后是两个贡献,摘要和引言中加入实验来说明。
结论直接就总结,然后提出未来展望,以后还需做的工作等。
要达成的就是所有的逻辑都是要清晰一致的。我之前有疑问就是为什么一直都在重复说一个东西,就是我感觉写的话会有很多重复的东西让我不知道怎么写。说是换个说法,然后详细和概括来区分,就是相当于一直在强调这个东西,然后就相当于是统一,然后增加了曝光度(类似)


 被折叠的 条评论
为什么被折叠?
被折叠的 条评论
为什么被折叠?
 到【灌水乐园】发言


