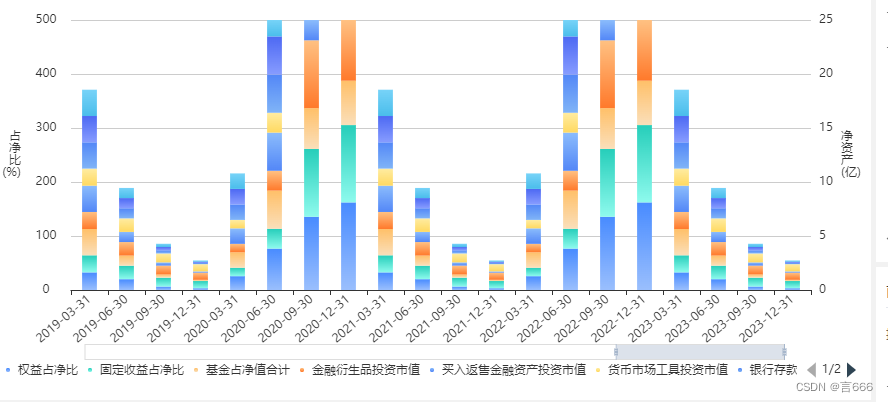
echarts堆积柱状图,渐变色


const option = {


 color: [

          new that.$echarts.graphic.LinearGradient(0, 0, 0, 1, [{

            offset: 0,

            color: '#488BFF' // 渐变起始颜色

          }, {

            offset: 1,

            color: '#9abffd' // 渐变结束颜色

          }]),

          new that.$echarts.graphic.LinearGradient(0, 0, 0, 1, [{

            offset: 0,

            color: '#26CEBA'

          }, {

            offset: 1,

            color: '#8efaed'

          }]),

          new that.$echarts.graphic.LinearGradient(0, 0, 0, 1, [{

            offset: 0,

            color: '#FFC069'

          }, {

            offset: 1,

            color: '#fadfba'

          }]),

          new that.$echarts.graphic.LinearGradient(0, 0, 0, 1, [{

            offset: 0,

            color: '#FFC182'

          }, {

            offset: 1,

            color: '#FF792B'

          }]),

          new that.$echarts.graphic.LinearGradient(0, 0, 0, 1, [{

            offset: 0,

            color: '#8BBCFC'

          }, {

            offset: 1,

            color: '#5387F7'

          }]),

          new that.$echarts.graphic.LinearGradient(0, 0, 0, 1, [{

            offset: 0,

            color: '#FFECA1'

          }, {

            offset: 1,

            color: '#FFD961'

          }]),

          new that.$echarts.graphic.LinearGradient(0, 0, 0, 1, [{

            offset: 0,

            color: '#5387F7'

          }, {

            offset: 1,

            color: '#80B4F7'

          }]),

          new that.$echarts.graphic.LinearGradient(0, 0, 0, 1, [{

            offset: 0,

            color: '#4D69F3'

          }, {

            offset: 1,

            color: '#879CFF'

          }]),

          new that.$echarts.graphic.LinearGradient(0, 0, 0, 1, [{

            offset: 0,

            color: '#77D3F8'

          }, {

            offset: 1,

            color: '#4ABDEB'

          }]),

          new that.$echarts.graphic.LinearGradient(0, 0, 0, 1, [{

            offset: 0,

            color: '#FFD961'

          }, {

            offset: 1,

            color: '#FFECA1'

          }]),

          new that.$echarts.graphic.LinearGradient(0, 0, 0, 1, [{

            offset: 0,

            color: '#FFC182'

          }, {

            offset: 1,

            color: '#FF792B'

          }]),

          new that.$echarts.graphic.LinearGradient(0, 0, 0, 1, [{

            offset: 0,

            color: '#FFECA1'

          }, {

            offset: 1,

            color: '#FFD961'

          }])

        ]

,

        tooltip: {

          trigger: 'axis',

          backgroundColor: '#fff',

          axisPointer: {

            type: 'none'

          },

          textStyle: {

            color: '#666'

          },

          formatter: (e) => {

            let tip = ''

            tip += '<b>' + e[0].name + '</b><br />'

            e.forEach(params => {

              let colorList = params.color.colorStops

              tip += `<span style="width: 8px;height: 8px;display: inline-block;margin-right: 5px;background: linear-gradient(229deg, ${colorList[0].color} 0%, ${colorList[1].color} 100%);;border-radius: 4px;"></span>` + params.seriesName + ':' + `<b style="background: linear-gradient(229deg, ${colorList[0].color} 0%, ${colorList[1].color} 100%);-webkit-background-clip: text;-webkit-text-fill-color: transparent;">` + params.value + '</b>' + '<br />'

            })

            return tip

          }

        },

,

        legend: {

          top: '94%',

          type: 'scroll',  //name太多,可用按钮切换

          itemWidth: 10,

          itemHeight: 4,

          itemGap: 10,

          textStyle: {

            padding: [2, 0, 0, 0],

          },

          data: [

            {

              name: '权益占净比',

              icon: 'circle'

            },

            {

              name: '固定收益占净比',

              icon: 'circle'

            },

            {

              name: '基金占净值合计',

              icon: 'circle'

            },

            {

              name: '金融衍生品投资市值',

              icon: 'circle'

            },

            {

              name: '买入返售金融资产投资市值',

              icon: 'circle'

            },

            {

              name: '货币市场工具投资市值',

              icon: 'circle'

            }, {

              name: '银行存款和结算备付金投资市值合计',

              icon: 'circle'

            },

            {

              name: '其他投资市值',

              icon: 'circle'

            }, {

              name: '贵金属投资',

              icon: 'circle'

            },

            {

              name: '净资产',

              icon: 'rect'

            }]

        },

        grid: {

          left: 70,

          right: 50,

          bottom: 60,

          top: 15,

          width: 740,

          height: 270

        },

xAxis: [{.....}],

yAxis:[{...}],

series:[{...}],

dataZoom: [

          {

            type: 'slider',

            show: true,

            startValue: dataZoomStart,   // dataZoomStart = Xdata.length - 20 (Xdata x轴的长度--默认展示最新的20条数据)

            endValue: dataZoomEnd, // dataZoomEnd = Xdata.length - 1  (Xdata x轴的长度)

            dataBackground: {

              areaStyle: { opacity: 0 },

              lineStyle: { opacity: 0 }

            },

            left: 81,

            right: 79,

            bottom: 20,

            height: 16,

            filterMode: 'empty'

          }

        ]

}

  • 22
    点赞
  • 20
    收藏
    觉得还不错? 一键收藏
  • 0
    评论
ECharts是一个基于JavaScript的开源可视化库,用于构建交互式的图表和数据可视化界面。它提供了丰富的图表类型和配置选项,可以满足各种数据可视化需求。 要实现ECharts自定义柱状图渐变色,可以通过设置渐变色的方式来实现。具体步骤如下: 1. 首先,在ECharts的配置项中找到柱状图的系列(series)配置项。 2. 在系列配置项中,找到柱状图的样式配置项(itemStyle)。 3. 在样式配置项中,找到渐变色配置项(color)。 4. 将渐变色配置项设置为一个数组,数组中每个元素表示一个渐变色。 5. 每个渐变色可以使用对象来表示,对象包含起始颜色(colorStops)和结束颜色(colorStops)。 6. 在起始颜色和结束颜色中,可以设置颜色值和位置(offset),用于控制渐变的起始和结束位置。 以下是一个示例代码,演示了如何实现ECharts自定义柱状图渐变色: ```javascript option = { // 其他配置项... series: [{ type: 'bar', data: [10, 20, 30, 40, 50], itemStyle: { color: [ { type: 'linear', x: 0, y: 0, x2: 0, y2: 1, colorStops: [ { offset: 0, color: 'red' // 起始颜色 }, { offset: 1, color: 'blue' // 结束颜色 } ] } ] } }] }; ``` 关于ECharts的legend渐变色,目前ECharts官方并没有直接提供设置legend渐变色的配置项。但是你可以通过自定义legend的方式来实现渐变色效果。 以下是一个示例代码,演示了如何通过自定义legend来实现渐变色效果: ```javascript option = { // 其他配置项... legend: { data: ['柱状图'], formatter: function (name) { return '{a|' + name + '}'; }, textStyle: { rich: { a: { color: { type: 'linear', x: 0, y: 0, x2: 1, y2: 0, colorStops: [ { offset: 0, color: 'red' // 起始颜色 }, { offset: 1, color: 'blue' // 结束颜色 } ] } } } } }, series: [{ type: 'bar', name: '柱状图', data: [10, 20, 30, 40, 50] }] }; ``` 通过上述代码,你可以将legend的文本设置为渐变色,从而实现legend的渐变色效果。

“相关推荐”对你有帮助么?

  • 非常没帮助
  • 没帮助
  • 一般
  • 有帮助
  • 非常有帮助
提交
评论
添加红包

请填写红包祝福语或标题

红包个数最小为10个

红包金额最低5元

当前余额3.43前往充值 >
需支付:10.00
成就一亿技术人!
领取后你会自动成为博主和红包主的粉丝 规则
hope_wisdom
发出的红包
实付
使用余额支付
点击重新获取
扫码支付
钱包余额 0

抵扣说明:

1.余额是钱包充值的虚拟货币,按照1:1的比例进行支付金额的抵扣。
2.余额无法直接购买下载,可以购买VIP、付费专栏及课程。

余额充值