


任务描述
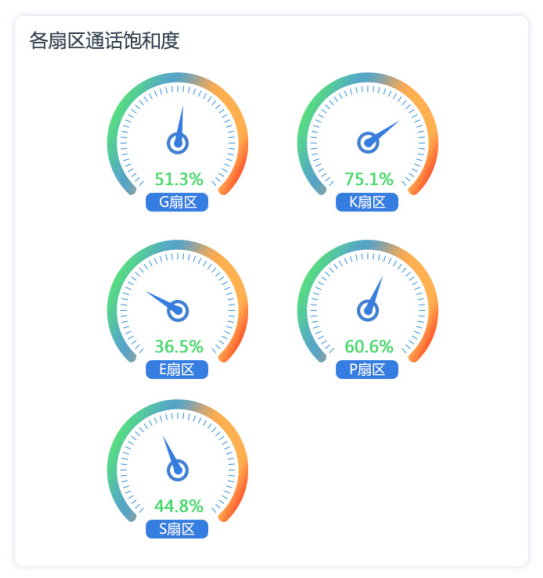
内 容:各扇区通话饱和度。扇区通话饱和度是由终端根据管制值班人员通话指挥率和人员与飞机通话次数等算法计算的出的扇区饱和度。这里由真实历史数据代替计算后的饱和度数据由前端页面显示出来
学 时:6学时
知识点:各扇区通话饱和度
重 点:数据绑定、后台请求
任务指导
确定扇区饱和度设计图,请求后台获取数据,绑定数据,最后在首页引入组件:
1、确认设计图,引入ECharts组件
2、后台请求数据
3、Vue页面绑定数据
4、实现设计效果
核心代码:
1、前端核心代码:kongguan_web/src/components/echart/SectorCallChart.vue
2、后端核心代码:BigData-KongGuan/src/main/java/com/qrsoft/controller/CallSaturationController.java
实现的设计效果:

任务实现
1、打开前端Vue项目kongguan_web,完成前端src/components/echart/SectorCallChart.vue页面设计
- 在SectorCallChart.vue页面添加div设计
<template>
  <div class="home">
    <div style="margin-left:17px;margin-top: 18px; text-align:left;"> <b>各扇区通话饱和度</b></div>
    <el-row>
      <el-col :span="12">
        <div id="G_GaugeChart" class="chart" style="margin-left: 30px"/>
      </el-col>
      <el-col :span="12">
        <div id="K_GaugeChart" class="chart" style="margin-right: 30px"/>
      </el-col>
    </el-row>
    <el-row>
      <el-col :span="12">
        <div id="E_GaugeChart" class="chart" style="margin-left: 30px"/>
      </el-col>
      <el-col :span="12">
        <div id="P_GaugeChart" class="chart" style="margin-right: 30px"/>
      </el-col>
    </el-row>
    <el-row>
      <el-col :span="12">
        <div id="S_GaugeChart" class="chart" style="margin-left: 30px"/>
      </el-col>
      <el-col :span="12">
        <div id="kong_GaugeChart" class="chart" style="margin-right: 30px"/>
      </el-col>
    </el-row>
  </div>
</template>
... 接下文 ...- 初始化报表数据
... 接上文 ...
<script>
  import {findCallSaturation} from "../../api/chartdata/chartdata"
  export default {
    name: "SectorCallChart",
    data() {
      return {
        data: [],
        e_SectorNum: 0,
        k_SectorNum: 0,
        s_SectorNum: 0,
        g_SectorNum: 0,
        p_SectorNum: 0,
        e_sec_chart: {},
        k_sec_chart: {},
        s_sec_chart: {},
        g_sec_chart: {},
        p_sec_chart: {},
      }
    },
    mounted() {
      this.drawSectorChart();
      this.loadData();
    },
... 接下文 ...- 加载数据,并初始化报表
... 接上文 ...
  methods: {
      //加载数据
      loadData() {
        findCallSaturation().then(data => {
          if (data.isSuccess) {
            this.formatData(data.result);
          } else {
            this.$message.error("数据获取失败");
          }
        });
      },
      formatData(param) {
        let e_SectorNum = param.E
        let k_SectorNum = param.K
        let s_SectorNum = param.S
        let g_SectorNum = param.G
        let p_SectorNum = param.P

        let e_opt = this.initSectorOption({text: "E扇区", value: e_SectorNum})
        let k_opt = this.initSectorOption({text: "K扇区", value: k_SectorNum})
        let s_opt = this.initSectorOption({text: "S扇区", value: s_SectorNum})
        let g_opt = this.initSectorOption({text: "G扇区", value: g_SectorNum})
        let p_opt = this.initSectorOption({text: "P扇区", value: p_SectorNum})

        this.e_sec_chart.setOption(e_opt);
        this.k_sec_chart.setOption(k_opt);
        this.s_sec_chart.setOption(s_opt);
        this.g_sec_chart.setOption(g_opt);
        this.p_sec_chart.setOption(p_opt);
      },
      drawSectorChart() {
        this.e_sec_chart = this.$echarts.init(document.getElementById("E_GaugeChart"));
        this.k_sec_chart = this.$echarts.init(document.getElementById("K_GaugeChart"));
        this.s_sec_chart = this.$echarts.init(document.getElementById("S_GaugeChart"));
        this.g_sec_chart = this.$echarts.init(document.getElementById("G_GaugeChart"));
        this.p_sec_chart = this.$echarts.init(document.getElementById("P_GaugeChart"));
      },
... 接下文 ...- 在加载数据后,需要将数据转换为EChart所需的Option格式,所以在上面的代码中调用了initSectorOption方法,代码如下:
... 接上文 ...
       initSectorOption(ChartObj) {
        let option = {

          title: [{
            text: ChartObj.text,
            top: '140',
            x: 'center',
            borderColor: '#fff',
            backgroundColor: '#337cde',
            borderWidth: 1,
            borderRadius: 15,
            padding: [7, 14],
            textStyle: {
              fontWeight: 'normal',
              fontSize: 12,
              color: '#fff'
            }
          }],
          angleAxis: {
            show: false,
            max: 100 * 360 / 270, //-45度到225度,二者偏移值是270度除360度
            type: 'value',
            startAngle: 225, //极坐标初始角度
            splitLine: {
              show: false
            }
          },
          barMaxWidth: 14, //圆环宽度
          radiusAxis: {
            show: false,
            type: 'category',
          },
          //圆环位置和大小
          polar: {
            center: ['50%', '50%'],
            radius: '150'
          },
          series: [{
            type: "gauge",
            // center: t.pos,
            radius: "56%",
            // splitNumber: t.splitNum || 10,
            min: 0,
            max: 100,
            startAngle: 225,
            endAngle: -45,
            axisLine: {show: !0, lineStyle: {width: 1, color: [[1, "rgba(0,0,0,0)"]]}},
            axisTick: {show: !0, lineStyle: {color: "rgba(53,125,224,0.6)", width: 1}, length: -5},
            splitLine: {show: !1, length: -20, lineStyle: {color: "rgba(53,125,224,0.6)"}},
            axisLabel: {show: !1, distance: -20, textStyle: {fontSize: "14", fontWeight: "bold"}},
            pointer: {show: 0},
            detail: {show: 0}
          }, {
            // name: t.name,
            type: "gauge",
            // center: t.pos,
            radius: "75%",
            startAngle: 225,
            endAngle: -45,
            min: 0,
            max: 100,
            axisLine: {
              show: !0,
              lineStyle: {
                width: 9,
                color: [[ChartObj.value[0] * 10 / 100, new this.$echarts.graphic.LinearGradient(0, 0, 1, 0, [{
                  offset: 0,
                  color: "#5ce07e"
                }, {offset: .5, color: "#558ed7"}, {offset: 1, color: "#fec16b"}])], [1, "#dde8fe"]]
              }
            },
            axisTick: {show: 0},
            splitLine: {show: 0},
            axisLabel: {show: 0},
            pointer: {show: !0, width: "8%", length: "50%"},
            itemStyle: {normal: {color: "#357de0"}},
            detail: {
              show: !0,
              offsetCenter: [0, "60%"],
              textStyle: {fontSize: 14, color: "#44d96b"},
              formatter: ["{value} %" ].join("\n"),
              rich: {
                name: {fontSize: 14, lineHeight: 30, color: "#ddd"},
                score: {
                  backgroundColor: "#357de0",
                  padding: [2, 10, 5, 10],
                  lineHeight: 30,
                  borderRadius: 10,
                  color: "#fff",
                  fontFamily: "微软雅黑",
                  fontSize: 12
                }
              }
            },
            data: [ChartObj.value[0] * 10]
          }
          ]
        };
        return option;
      }
    }
  }
</script>
... 接下文 ...- 页面的样式
... 接上文 ...
<style scoped>
  .home {
    height: 700px;
    overflow: auto;
    background-color: #ffffff;
    border: 1px solid #ebedf2;
    border-radius: 10px;
    box-shadow: 3px 3px 3px 3px #ebedf2;
  }
  .home::-webkit-scrollbar {
    display: none;
  }
  .chart {
    height: 181px;
  }
</style>- 加载数据时,会调用src/api/chartdata/chartdata.js中定义的findCallSaturation()方法,向服务端发送GET请求,获取各个扇区通话饱和度,chartdata.js的完整代码如下:
import request from '../../utils/request'
const baseUrl = "/api"
/**
 * 扇区架次数动态统计
 */
export function findATCTime() {
  return request({
    url: baseUrl + "/atc/findATCTime",
    method: "GET"
  })
}
/**
 * 获取各个扇区通话饱和度
 */
export function findCallSaturation() {
  return request({
    url: baseUrl + "/callSaturation/findCallSaturation",
    method: "GET"
  })
}
export function annualWarningStatisticsByCategory() {
  return request({
    url: baseUrl + "/warnFlightHistory/annualWarningStatisticsByCategory",
    method: "GET"
  })
}
export function getAirPortCount() {
  return request({
    url: baseUrl + "/company/getAirPortCount",
    method: "GET"
  })
}
/**
 * 获取从青岛起飞航班数前十的航线
 * @returns {AxiosPromise}
 */
export function findByLimit() {
  return request({
    url: baseUrl + "/airLine/findByLimit",
    method: "GET"
  })
}
2、后端服务开发
- 打开后端项目 BigData-KongGuan,编写实体类src/main/java/com/qrsoft/entity/Callsaturation.java,用于保存通话饱和度信息
package com.qrsoft.entity;

import com.baomidou.mybatisplus.annotation.IdType;
import com.baomidou.mybatisplus.annotation.TableField;
import com.baomidou.mybatisplus.annotation.TableId;
import com.baomidou.mybatisplus.annotation.TableName;
import lombok.AllArgsConstructor;
import lombok.Data;
import lombok.NoArgsConstructor;

import java.io.Serializable;

@Data
@AllArgsConstructor
@NoArgsConstructor
@TableName("callsaturation_number")
public class Callsaturation implements Serializable {

	@TableId(value = "id",type = IdType.AUTO)
	private Integer id;

	@TableField(value = "SEND_TIME")
	private String sendTime;

	@TableField(value = "AREA_SOURCE")
	private String areaSource;

	@TableField(value = "THBH_TIME")
	private String thbhTime;

	@TableField(value = "THBH_SECT")
	private String thbhSect;

	@TableField(value = "THBH_VALUE")
	private String thbhValue;
}- 编写数据访问类src/main/java/com/qrsoft/mapper/CallsaturationMapper.java,查询各扇区通话饱和度
package com.qrsoft.mapper;

import com.baomidou.mybatisplus.core.mapper.BaseMapper;
import com.qrsoft.entity.Callsaturation;
import org.apache.ibatis.annotations.Mapper;
import org.apache.ibatis.annotations.Select;

import java.util.List;

@Mapper
public interface CallsaturationMapper extends BaseMapper<Callsaturation> {

    @Select("select THBH_SECT,THBH_VALUE from callsaturation_number group by THBH_SECT;")
    List<Callsaturation> findCallSaturation();
}- 编写Service层接口类src/main/java/com/qrsoft/service/CallsaturationService.java,查询各扇区通话饱和度
package com.qrsoft.service;

import com.baomidou.mybatisplus.extension.service.impl.ServiceImpl;
import com.qrsoft.common.Result;
import com.qrsoft.common.ResultConstants;
import com.qrsoft.entity.Callsaturation;
import com.qrsoft.mapper.CallsaturationMapper;
import org.springframework.stereotype.Service;

import java.util.HashMap;
import java.util.List;
import java.util.Map;

@Service
public class CallsaturationService extends ServiceImpl<CallsaturationMapper, Callsaturation> {
	/**
	 * 查询各扇区通话饱和度
	 * @return
	 */
	public Result findCallSaturation(){
		Map<String,String> map = new HashMap<>();
		List<Callsaturation> callSaturation = baseMapper.findCallSaturation();

		for (Callsaturation c:callSaturation ) {
			map.put(c.getThbhSect(),String.valueOf((Double.parseDouble(c.getThbhValue())*100)));
		}
		return new Result(ResultConstants.SUCCESS, ResultConstants.C_SUCCESS,map);
	}
}- 编写控制器类src/main/java/com/qrsoft/controller/CallSaturationController.java,查询各扇区通话饱和度
package com.qrsoft.controller;

import com.qrsoft.common.Result;
import com.qrsoft.service.CallsaturationService;
import io.swagger.annotations.Api;
import io.swagger.annotations.ApiOperation;
import org.springframework.beans.factory.annotation.Autowired;
import org.springframework.web.bind.annotation.GetMapping;
import org.springframework.web.bind.annotation.RequestMapping;
import org.springframework.web.bind.annotation.RestController;

@Api(tags = "扇区饱和度")
@RestController
@RequestMapping("/api/callSaturation")
public class CallSaturationController {

	@Autowired
	private CallsaturationService service;

	@ApiOperation(value = "获取各个扇区通话饱和度")
	@GetMapping("/findCallSaturation")
	public Result findCallSaturation(){
		return service.findCallSaturation();
	}
}
3、前后端整合,实现设计效果
- 打开前端Vue项目kongguan_web,在src/views/Home/Index.vue引入SectorCallChart组件
... 略 ...
  import AirLine from "../../components/AirLine";
  import Section from "../../components/Section";
  import Delay from "../../components/Delay";
  import WarnStatistice from "../../components/WarnStatistice";
  import SectorFlightChart from "../../components/echart/SectorFlightChart";
  import SectorCallChart from "../../components/echart/SectorCallChart";
  import {hasPermission} from "../../utils/permission";
  export default {
    data() {
      return {
      };
    },
    mounted() {
    },
    components: {AirLine,Section,Delay,WarnStatistice,SectorFlightChart,SectorCallChart},
    methods: {
      isShow(permission){
        return hasPermission(permission);
      }
  }
... 略 ...- 在src/views/Home/Index.vue添加“扇区通话饱和度”组件,代码如下:
<el-row :gutter="30" v-show="isShow('/section/detail')">
      <el-col :span="16" align="center">
        <SectorFlightChart/>
      </el-col>
      <el-col :span="8" align="center">
        <SectorCallChart/>
      </el-col>
</el-row>- src/views/Home/Index.vue的完整代码如下:
<template>
  <div class="index">
      <el-row :gutter="30" v-show="isShow('/flight/airline')">
      <el-col :span=24 align="center">
        <AirLine/>
      </el-col>
    </el-row>
    <el-row :gutter="30"  v-show="isShow('/flight/section')">
      <el-col :span="24" align="center">
        <Section/>
      </el-col>
    </el-row>
    <el-row :gutter="30" v-show="isShow('/flight/delay')">
      <el-col :span="16" align="center">
        <Delay/>
      </el-col>
      <el-col :span="8" align="center">
        <year-warning-chart/>
      </el-col>
    </el-row>
    <el-row :gutter="30" v-show="isShow('/section/warning')">
      <el-col :span="12" align="center">
        <air-port-count-chart/>
      </el-col>
      <el-col :span="12" align="center">
        <WarnStatistice/>
      </el-col>
    </el-row>
    <el-row :gutter="30" v-show="isShow('/section/detail')">
      <el-col :span="16" align="center">
        <SectorFlightChart/>
      </el-col>
      <el-col :span="8" align="center">
        <SectorCallChart/>
      </el-col>
    </el-row>
  </div>
</template>

<script>
  import AirLine from "../../components/AirLine";
  import Section from "../../components/Section";
  import Delay from "../../components/Delay";
  import WarnStatistice from "../../components/WarnStatistice";
  import SectorFlightChart from "../../components/echart/SectorFlightChart";
  import SectorCallChart from "../../components/echart/SectorCallChart";
  import {hasPermission} from "../../utils/permission";
  export default {
    data() {
      return {
      };
    },
    mounted() {
    },
    components: {AirLine,Section,Delay,WarnStatistice,SectorFlightChart,SectorCallChart},
    methods: {
      isShow(permission){
        return hasPermission(permission);
      }
    }
  };
</script>

<style scoped>
  .index {
    height: 100%;
    overflow: auto;
    padding-left: 44px;
    padding-right: 44px
  }
  .index::-webkit-scrollbar {
    display: none;
  }

  .caseClass {
    background: url('../../assets/images/index-bg.png') no-repeat;
    background-size: cover;
    margin-top: 20px;
    height: 284px;
  }

  .el-button {
    background: transparent;
  }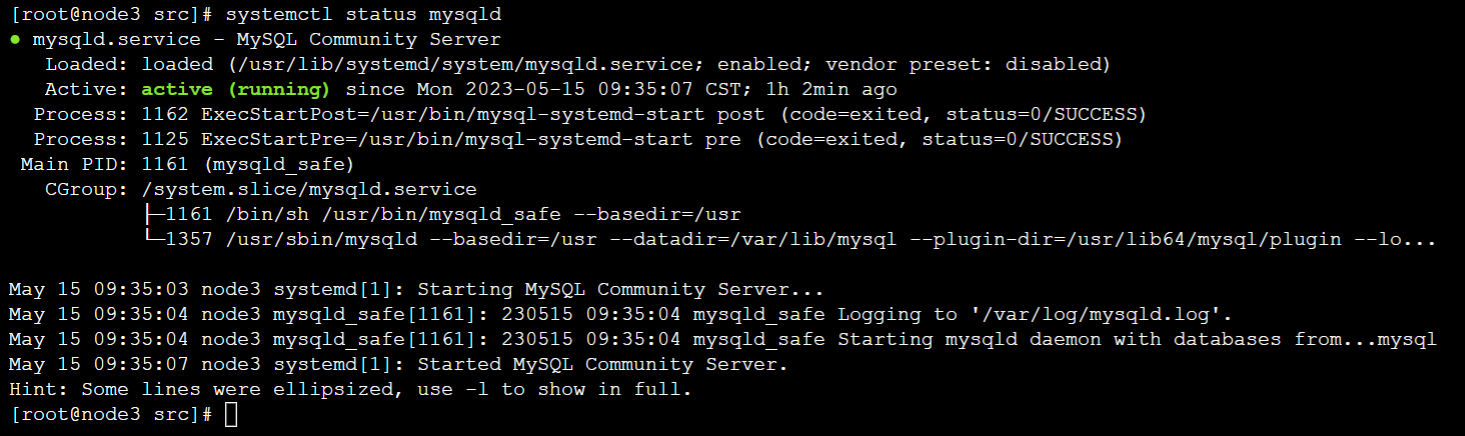
</style>- 确保Hadoop、Spark、Kafka、Redis、MySQL等服务均已经正常启动,如果没有正常启动,请参照前面的安装部署任务,完成这些服务的启动。
例如:查看MySQL是否正常启动。
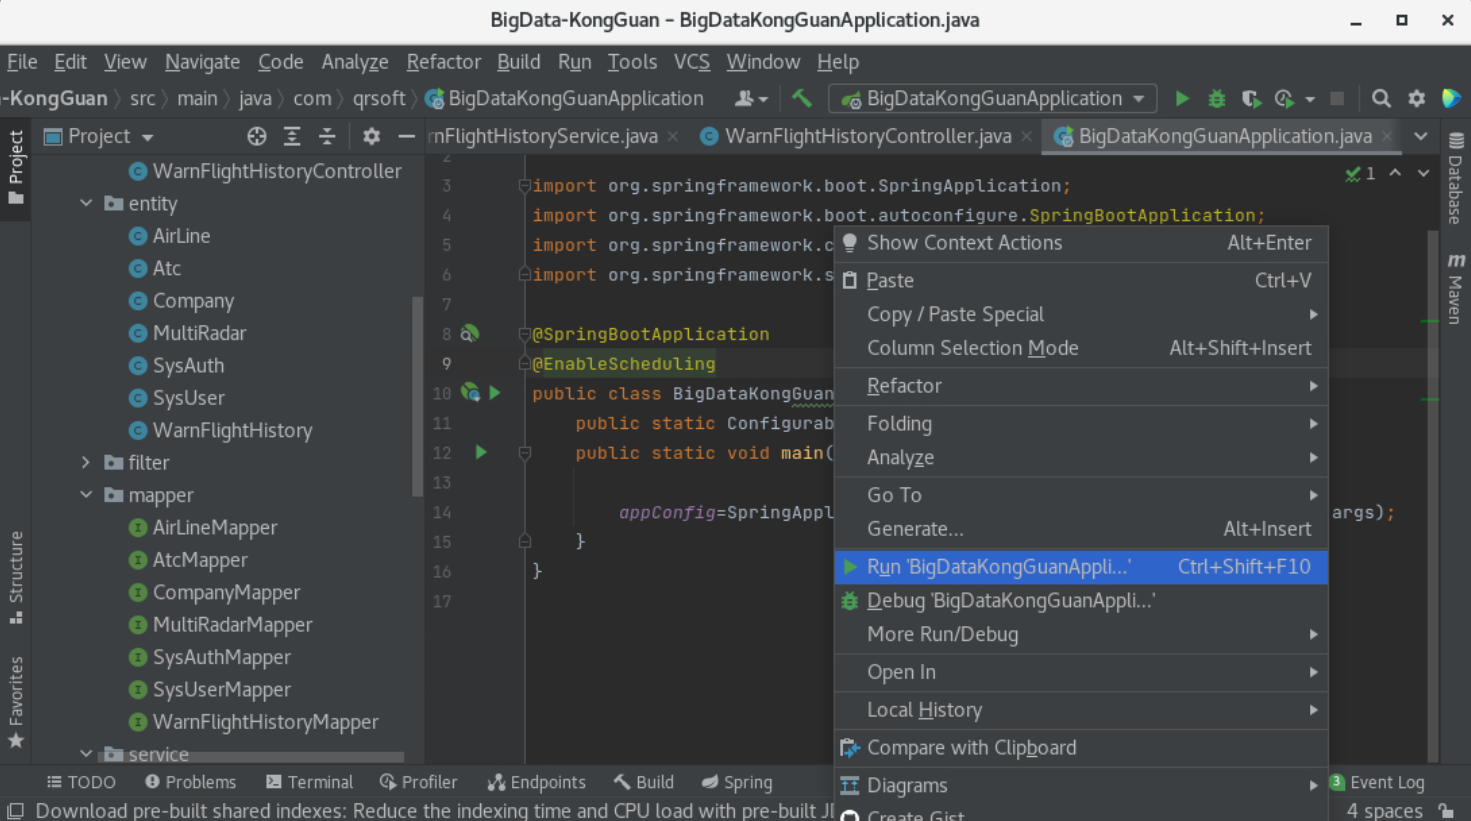
- 启动后端项目 BigData-KongGuan,如图启动src/main/java/com/qrsoft/BigDataKongGuanApplication.java类
- 启动前端项目 kongguan_web,代码如下
kongguan_web@0.1.0 dev /root/kongguan_web
vue-cli-service serve --open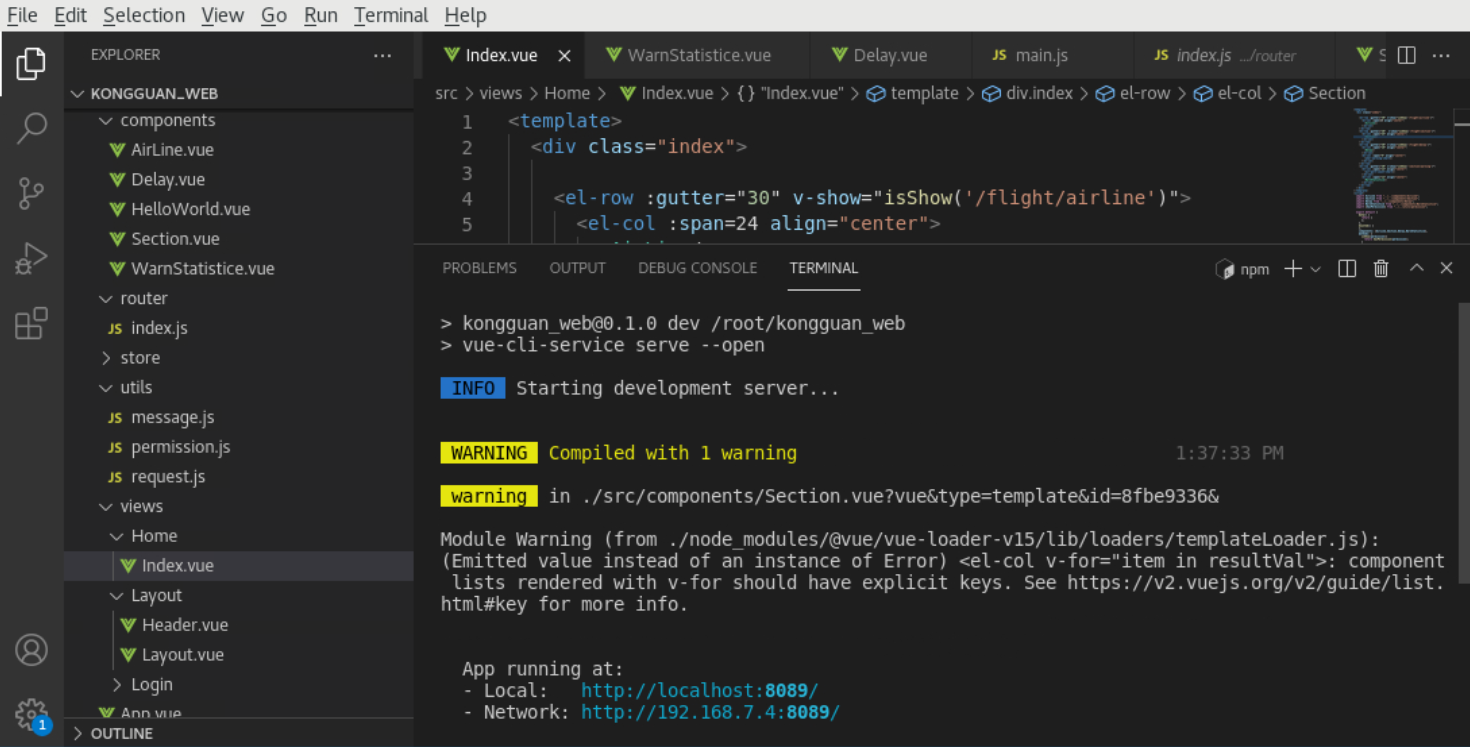
- 报表的最终展示效果如下图所示:


 被折叠的 条评论
为什么被折叠?
被折叠的 条评论
为什么被折叠?
 到【灌水乐园】发言


