


前言
注意:请先引入 ecahrts,如果不会则直接跳到第三步
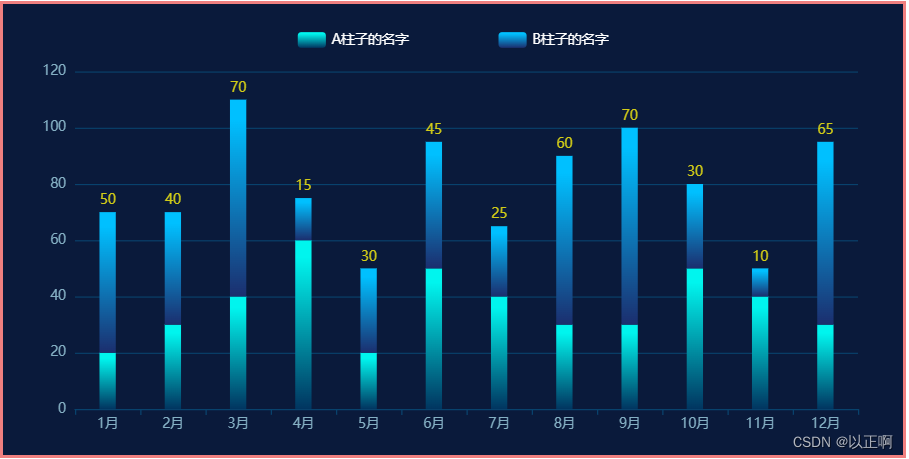
一、效果图:
二、完整代码:
<template>
  <div class="echart">
    <!-- 这个 div 就会被解析为 echarts图 -->
    <div class="barChart" ref="barChart"></div>
  </div>
</template>

<script>
export default {
  mounted() {
    this.initBarChart();
  },
  methods: {
    initBarChart() {
      let myChart = this.$echarts.init(this.$refs.barChart);
      let option = {
        tooltip: {
          trigger: "axis",
          axisPointer: {
            type: "cross",
            crossStyle: {
              color: "#999",
            },
          },
        },
        grid: {
          //调整图表位置
          show: false, //是否显示直角坐标系网格
          top: "15%", // 一下数值可为百分比也可为具体像素值
          right: "5%",
          bottom: "10%",
          left: "8%",
        },
        legend: {
          top: "5%", // 控制 板块控制器的位置
          // icon: 'rect',//形状  类型包括 circle,rect,line,roundRect,triangle,diamond,pin,arrow,none
          // itemWidth: 10,  // 设置宽度
          // itemHeight: 4, // 设置高度
          itemGap: 80, // 设置顶部图标间距
          right: "center",
          data: [
            {
              name: "A柱子的名字",
              textStyle: {
                color: "#fff", // 单独设置某一个图列的颜色
              },
            },
            {
              name: "B柱子的名字",
              textStyle: {
                color: "#fff", // 单独设置某一个图列的颜色
              },
            },
          ],
        },
        xAxis: [
          {
            type: "category",
            data: [
              "1月", "2月","3月","4月","5月","6月", "7月","8月","9月","10月","11月","12月",
            ],
            axisPointer: {
              type: "shadow",
            },
            axisLine: {
              //横轴样式
              lineStyle: {
                color: "#08426D",
              },
            },
            axisLabel: {
              show: true,
              textStyle: {
                color: "#85B0C4",
              },
            },
          },
        ],
        yAxis: [
          {
            type: "value",
            splitLine: {
              show: true,
              lineStyle: {
                color: ["#08426D"],
                width: 1,
                type: "solid",
              },
              textStyle: {
                color: "green",
              },
            },
            axisLabel: {
              show: true,
              formatter: "{value}",
              textStyle: {
                color: "#85B0C4",
              },
            },
          },
        ],
        series: [
          {
            name: "A柱子的名字",
            type: "bar",
            barWidth: "25%", // 设置柱子的宽度
            stack: "柱子", //同个类目轴上系列配置相同的stack值可以堆叠放置
            data: [20, 30, 40, 60, 20, 50, 40, 30, 30, 50, 40, 30],
            itemStyle: {
              color: {
                type: "linear",
                x: 0, // 右
                y: 1, // 下
                x2: 0, // 左
                y2: 0, // 上
                colorStops: [
                  {
                    offset: 0,
                    color: "#013560", // 0% 处的颜色
                  },
                  {
                    offset: 0.9,
                    color: "#00F5EE", // 90% 处的颜色
                  },
                ],
              },
            },
          },
          {
            name: "B柱子的名字",
            type: "bar",
            barWidth: "25%", // 设置柱子的宽度
            stack: "柱子", //同个类目轴上系列配置相同的stack值可以堆叠放置
            data: [50, 40, 70, 15, 30, 45, 25, 60, 70, 30, 10, 65],
            itemStyle: {
              color: {
                type: "linear",
                x: 0, // 右
                y: 1, // 下
                x2: 0, // 左
                y2: 0, // 上
                colorStops: [
                  {
                    offset: 0,
                    color: "#1B2E6E", // 0% 处的颜色
                  },
                  {
                    offset: 0.9,
                    color: "#00C0FF", // 90% 处的颜色
                  },
                ],
              },
            },
            label: {
              show: true, // 开启显示
              position: "top", // 在上方显示
              distance: 10, // 距离图形元素的距离。当 position 为字符描述值(如 'top'、'insideRight')时候有效。
              verticalAlign: "middle",
              textStyle: {
                // 数值样式
                color: "#D2CC17",
                fontSize: 12,
              },
            },
          },
        ],
      };
      myChart.setOption(option);
    },
  },
};
</script>
<style scoped lang="less">
.echart {
  width: 800px;
  height: 400px;
  margin: auto;
  border: 3px solid lightcoral;
  background-color: #0a1a3b;

  //  宽高是必须给的,可以给百分比、具体的像素等....
  .barChart {
    width: 800px;
    height: 400px;
  }
}
</style>


 1183
1183


 被折叠的 条评论
为什么被折叠?
被折叠的 条评论
为什么被折叠?
 到【灌水乐园】发言


