


Matplotlib绘图--中文乱码问题
在jupyter notebook 中,使用 Matplotlib 绘图过程中涉及了中文字符,出现警告
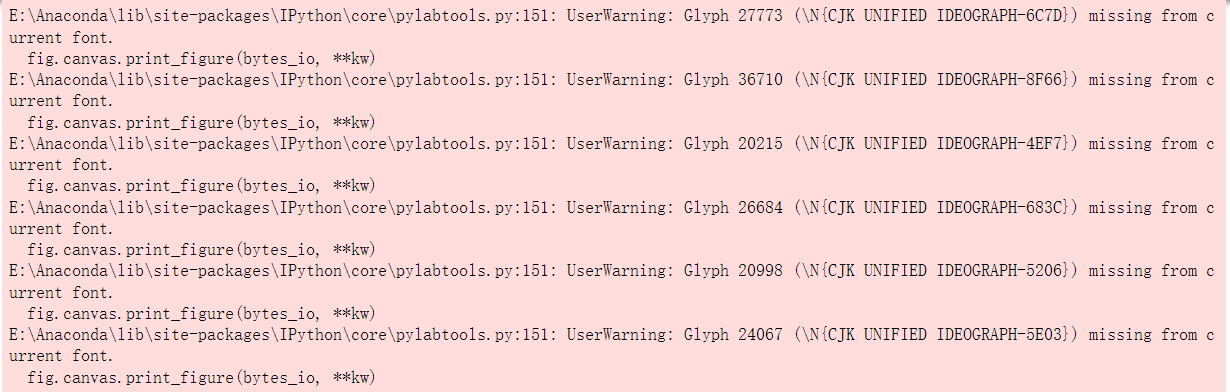
E:\Anaconda\lib\site-packages\IPython\core\pylabtools.py:151: UserWarning: Glyph 20215 (\N{CJK UNIFIED IDEOGRAPH-4EF7}) missing from current font.
  fig.canvas.print_figure(bytes_io, **kw)
matplotlib默认不支持中文
示例:使用matplotlib绘制直方图并设置参数
import matplotlib.pyplot as plt
# 绘制价格分布直方图
(
    price_explode[price_explode!= '0']
    .value_counts()
    .sort_index()
    .plot(figsize=(12, 6),title="价格分布", kind="hist", rot=15, ylabel="弹幕数")  # 绘图
#        -- plot()对结果绘图,
#        -- figsize即调整图的大小,
#        -- title即图的标题,
#        -- kind="hist"以直方图进行绘图,
#        -- rot=15将x坐标旋转15度,
#        -- ylabel用来设置y轴标签
)
结果

解决方法
在Mac和Windows中分别添加下列代码
#plt.rcParams['font.sans-serif'] = ['Arial Unicode MS']  # Mac中使得图标的中文能够正常显示
plt.rcParams['font.sans-serif'] = ['SimHei']  # Windows中使得图标的中文能够正常显示
结果:绘图成功


 4万+
4万+


 被折叠的 条评论
为什么被折叠?
被折叠的 条评论
为什么被折叠?
 到【灌水乐园】发言


