


Prometheus&Grafana安装及使用教程
1、Prometheus与Grafana简介
Prometheus和Grafana是两个在监控和数据分析领域非常流行的开源工具。
Prometheus: 负责收集指标,这些指标可以是系统性能、应用程序行为、基础设施状态等任何类型的数据。Grafana:负责可视化。允许用户通过创建漂亮的仪表板来展示从各种数据源(如Prometheus、InfluxDB、Elasticsearch等)获取的数据
ClickHouse V20.1.2.4中内置了 Prometheus 的访问接口(需开启),直接配置 Prometheus 的 Endpoint服务,会自动将metrics,events,aysnchronous_metrics 三张系统表的数据发送给 Prometheus。
2、安装教程
Prometheus-install
安装在master01机器上
# 解压
	tar -zxvf /opt/download/prometheus-2.54.0.linux-amd64.tar.gz -C /opt/software/

# 重命名
	cd /opt/software/
	mv prometheus-2.54.0.linux-amd64/ prometheus-2.54.0

# 环境变量
	vim /etc/profile.d/myenv.sh
	--------------------------------------------------------
    # prometheus 2.54.0
    export PROMETHEUS_HOME=/opt/software/prometheus-2.54.0
    export PATH=$FLINK_HOME/bin:$PATH
	--------------------------------------------------------
	激活环境变量:
		source /etc/profile

# 修改配置(配置监听clickhouse端口)—— 运行情况概要信息
	一:配置exporter服务(端口暴露)
		vim /etc/clickhouse-server/config.xml
	去除注释:
		-------------------------------------------
		<prometheus>
			<endpoint>/metrics</endpoint>
			<port>9363</port>

			<metrics>true</metrics>
			<events>true</events>
			<asynchronous_metrics>true</asynchronous_metrics>
			<status_info>true</status_info>
		</prometheus>
		--------------------------------------------
	重启clickhouse:
			clickhouse restart

	二:配置监听clickhouse端口,从而可以获取到clickhouse相关信息
		cd /opt/software/prometheus-2.54.0/
		vim prometheus.yml
		-----------------------------------------
          - job_name: "clickhouse"
            static_configs:
              - targets: ["master01:9363"]
		-----------------------------------------
基本操作:
# 启动服务:
nohup $PROMETHEUS_HOME/prometheus --config.file=$PROMETHEUS_HOME/prometheus.yml >/dev/null 2>&1 &
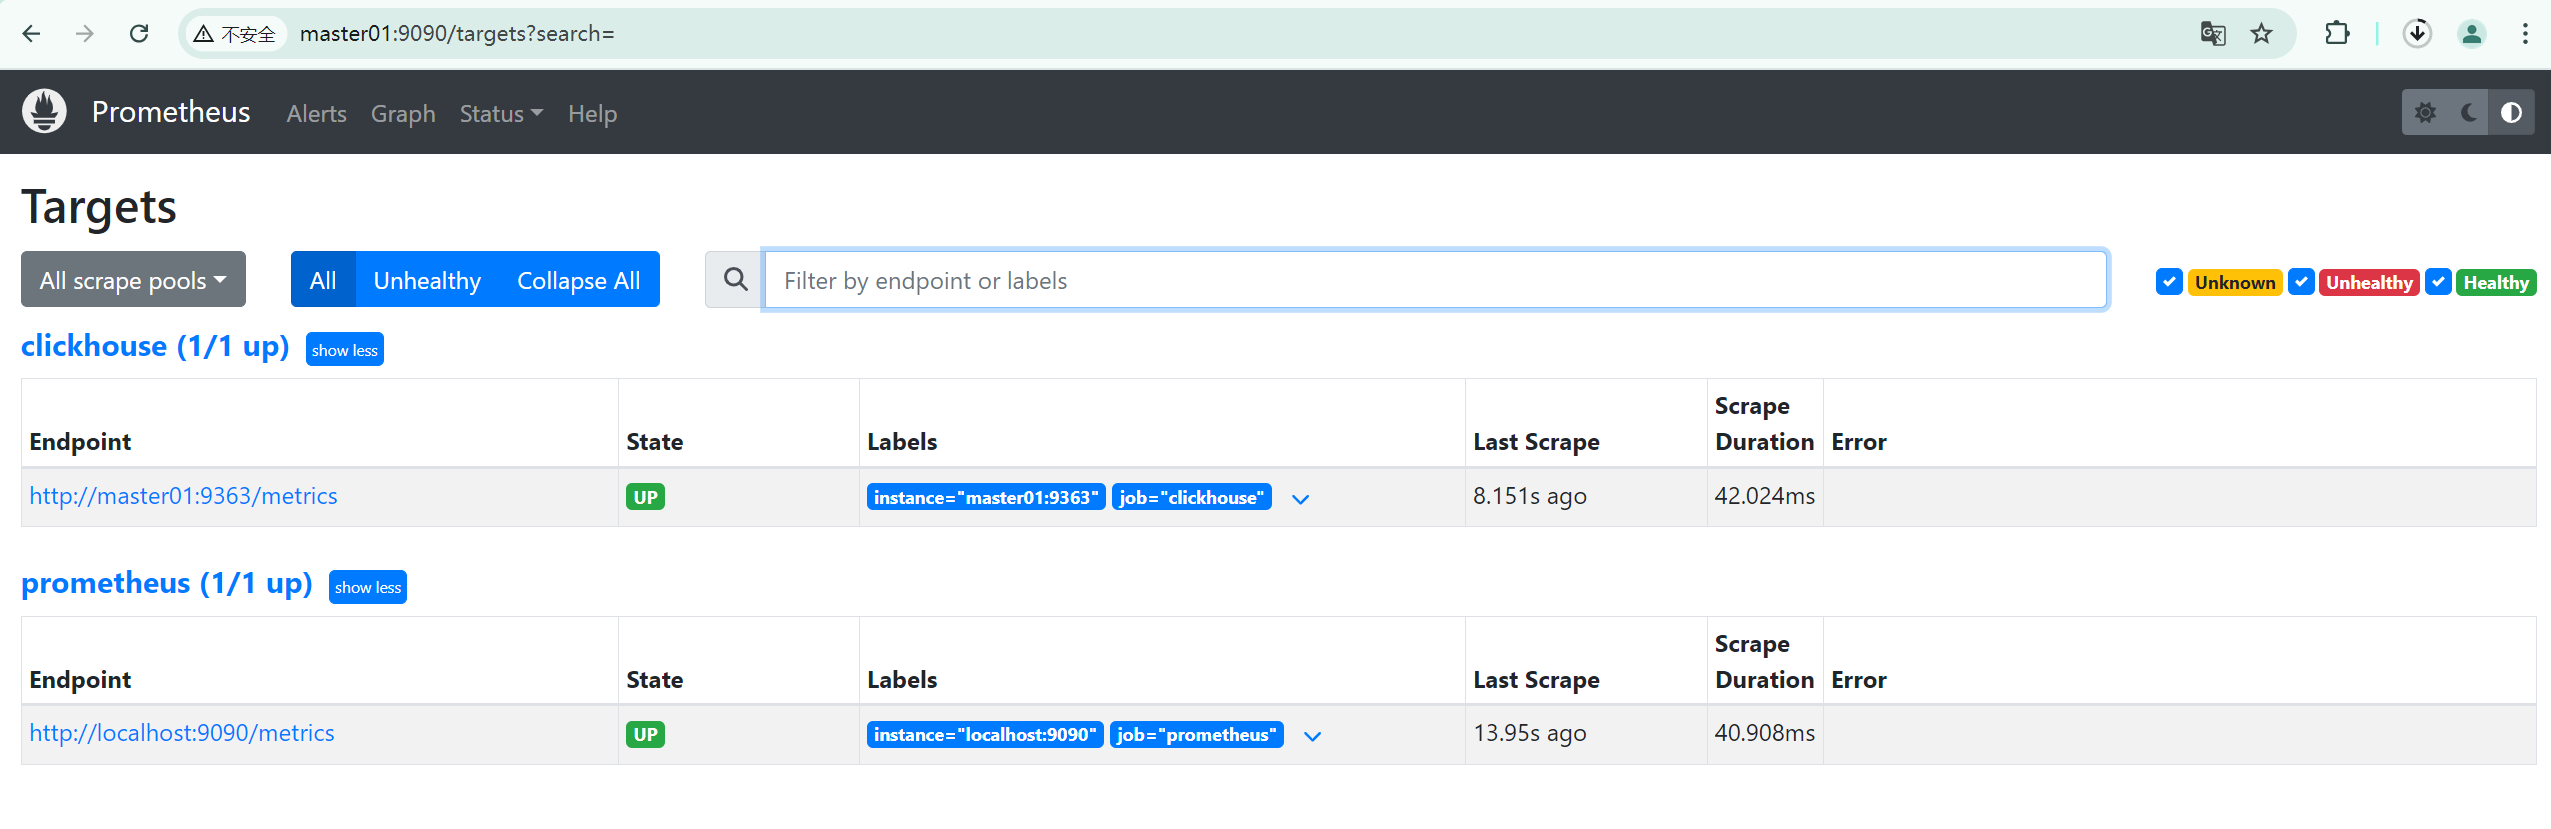
# web访问:http://master01:9090
Web页面展示:Status -> Targets
Grafana-install
安装在master01机器上
# 安装服务:
	# 选择一:本地安装包下载
	yum -y install grafana-enterprise-11.1.3-1.x86_64.rpm
	# 选择二:远程下载
	yum -y install https://dl.grafana.com/enterprise/release/grafana-enterprise-11.1.3-1.x86_64.rpm

# 查看资源:
	yum list installed|grep grafana
基本操作:
# 启动服务:
systemctl start grafana-server
# 查看服务:
systemctl status grafana-server
# 关服务:
systemctl stop grafana-server
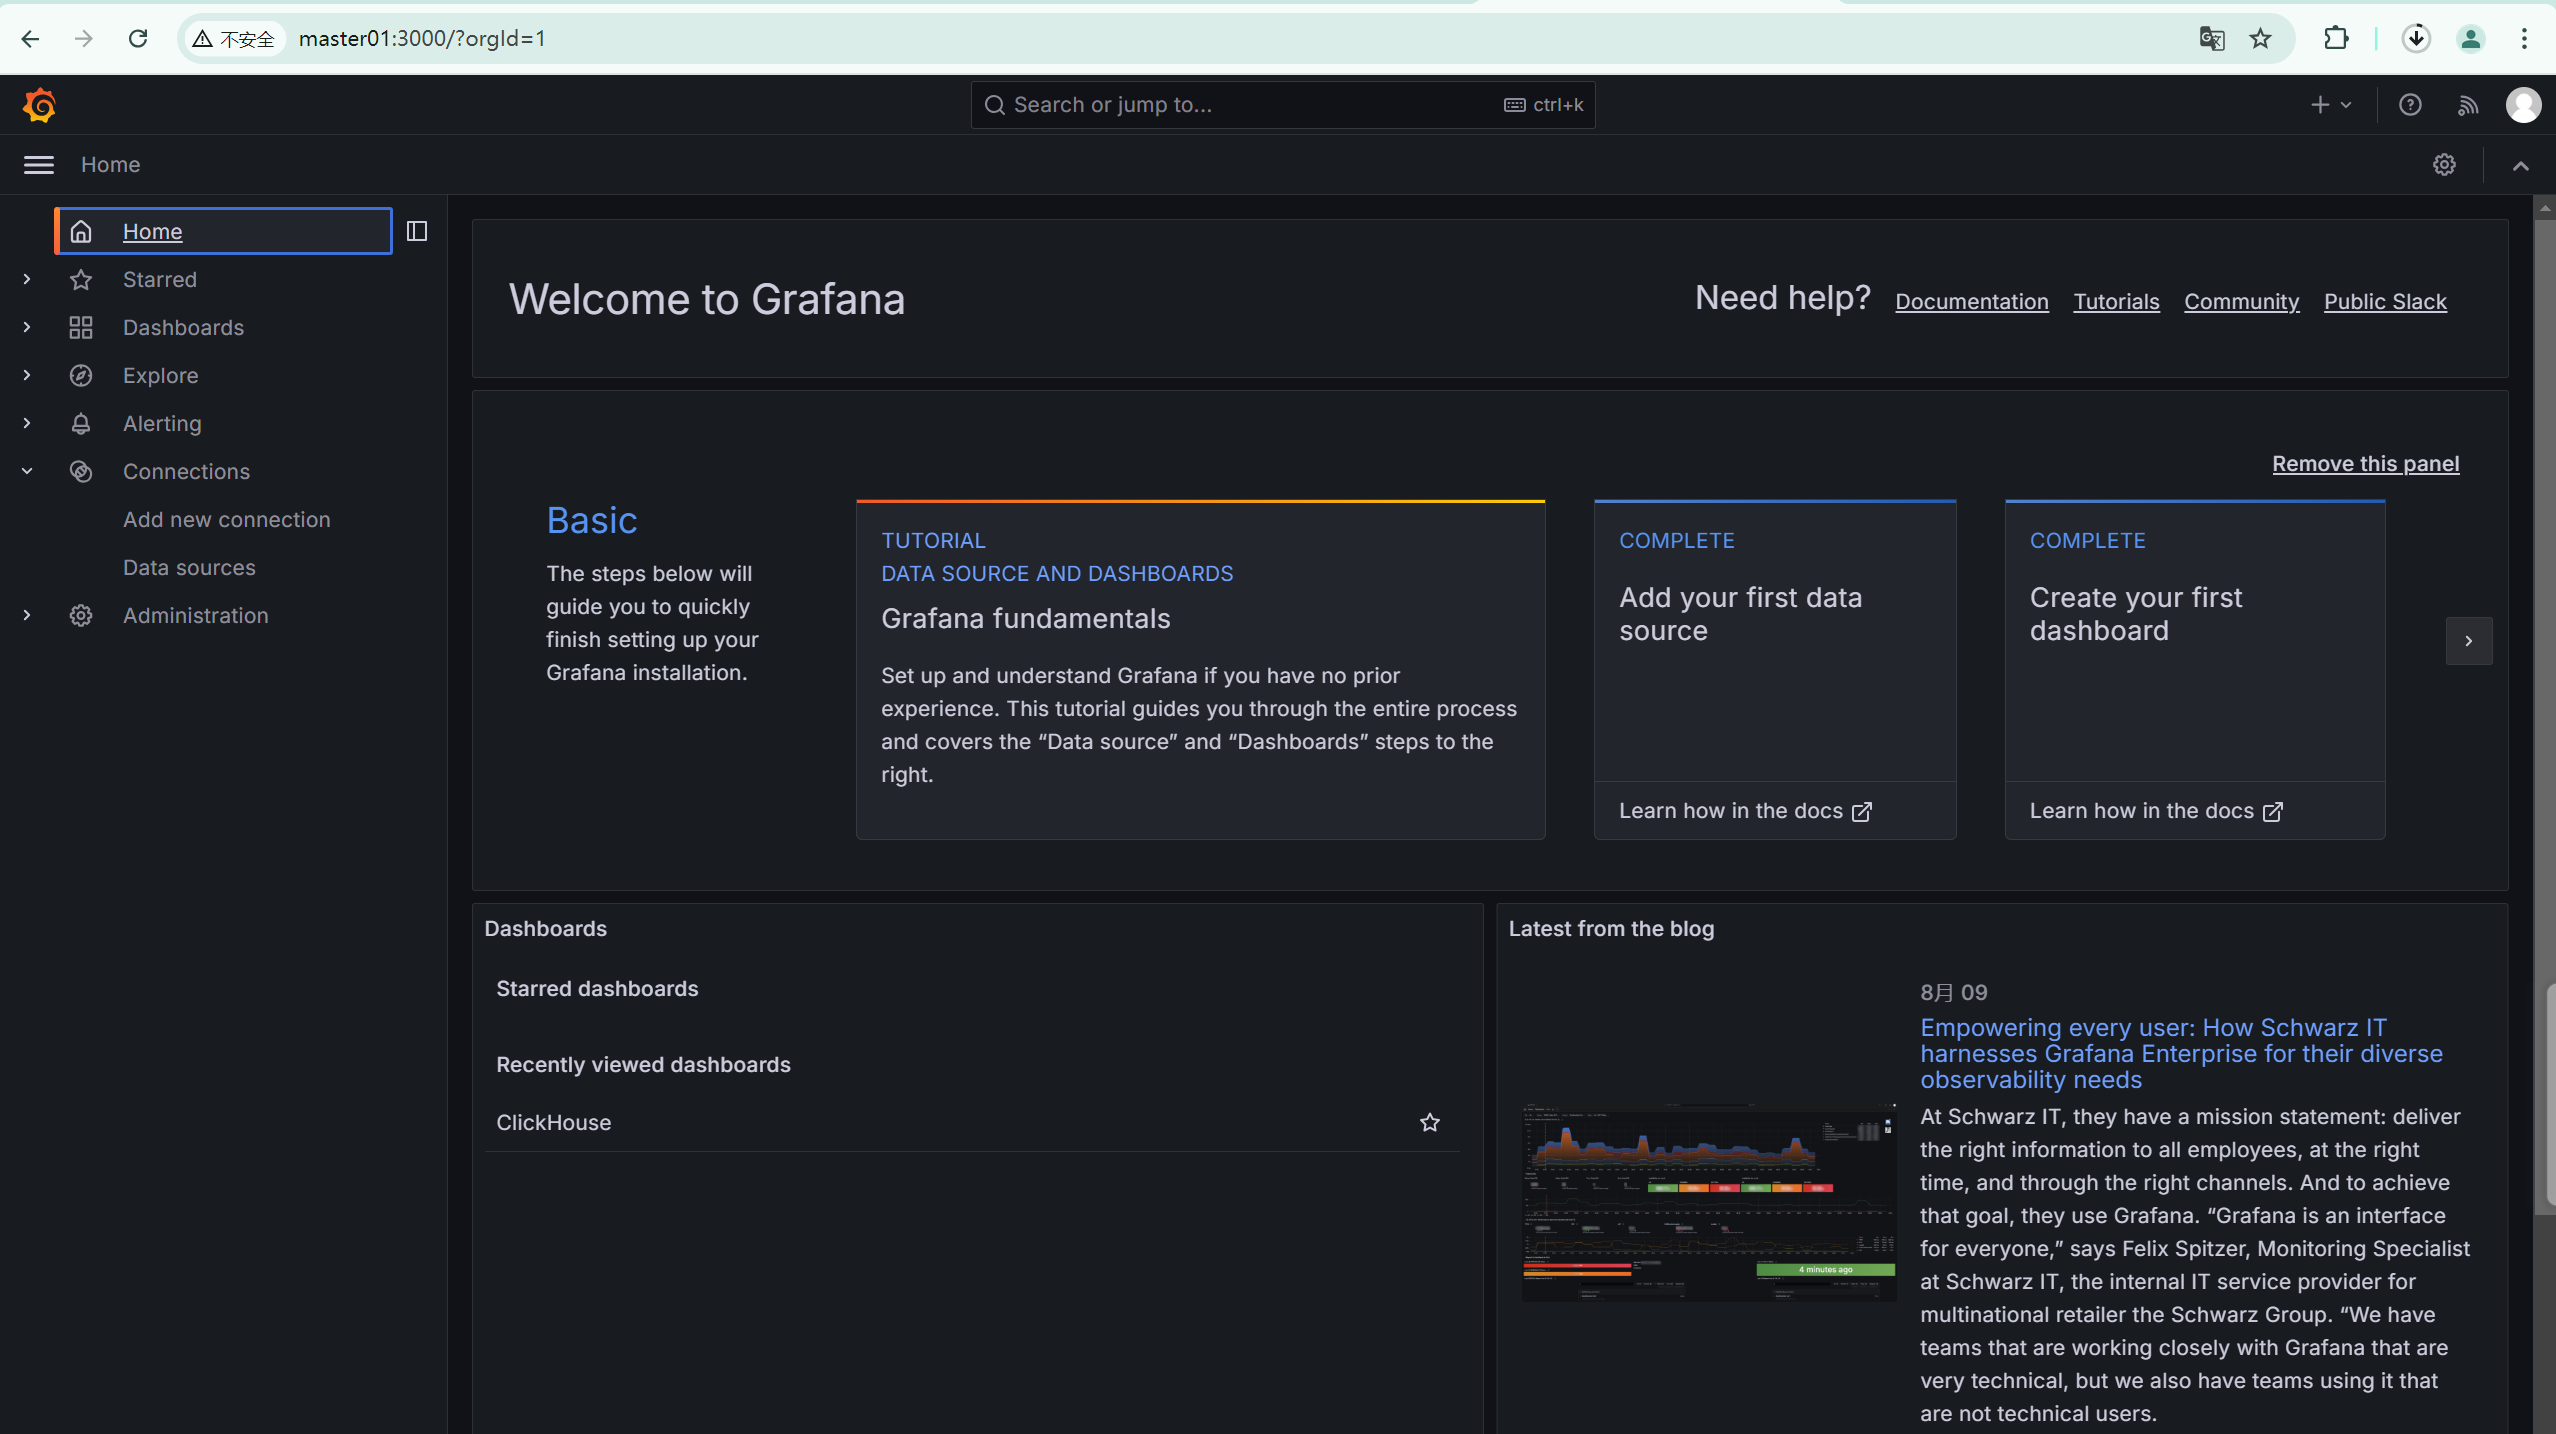
# web访问:http://master01:3000
账号:admin
初始密码:admin
Web页面展示:
3、使用教程
一:Grafana连接Prometheus
Grafana作为一个可视化工具,通常与Prometheus配合使用。Prometheus来监控clickhouse的运行情况相关信息(metrics,events,asynchronous_metrics,status_info),从而反馈给grafana。
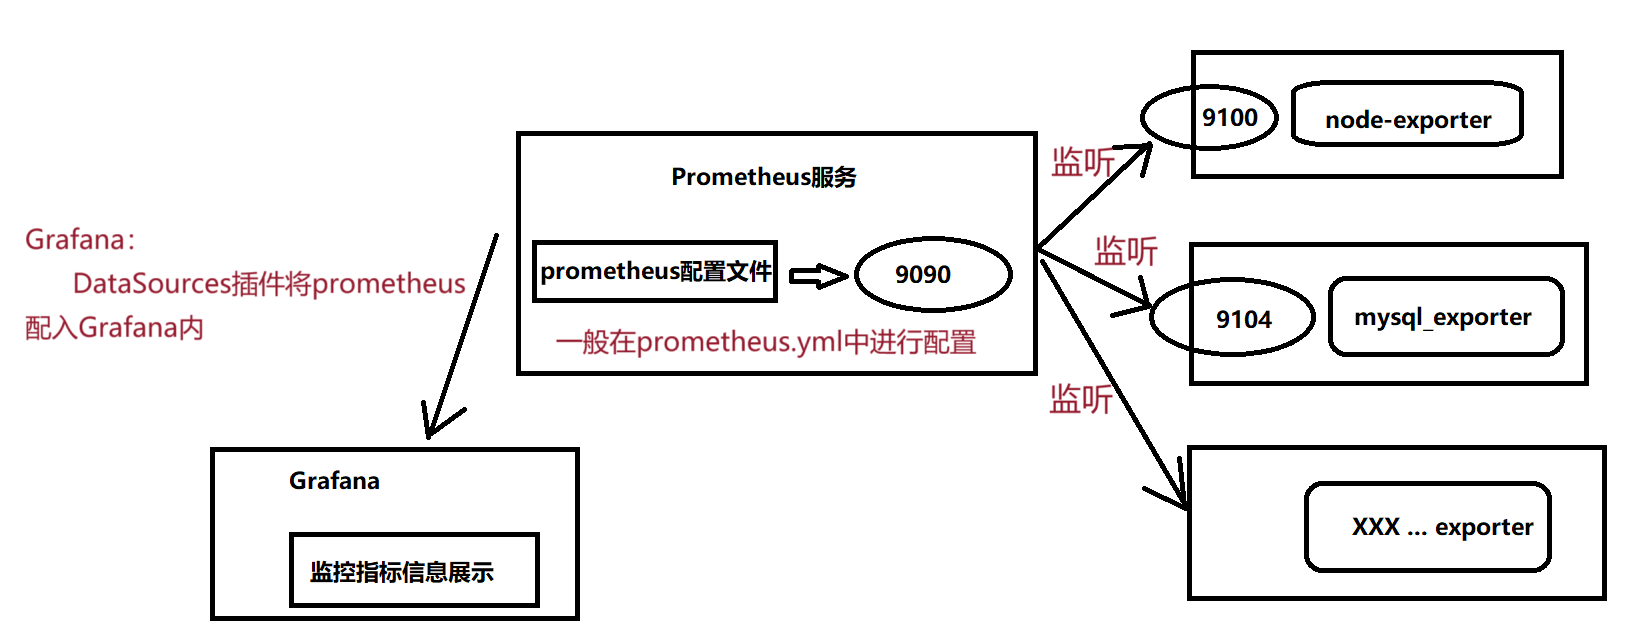
- 被监控的机器上需配置prometheus相关的exporter服务;
- Prometheus机器上通过prometheus.yml配置来监控上述的exporter暴露的端点;
- 上一步配置完成后,重新加载Prometheus服务;
- 配置Grafana,将待监控的指标通过可视化大屏展示出来;
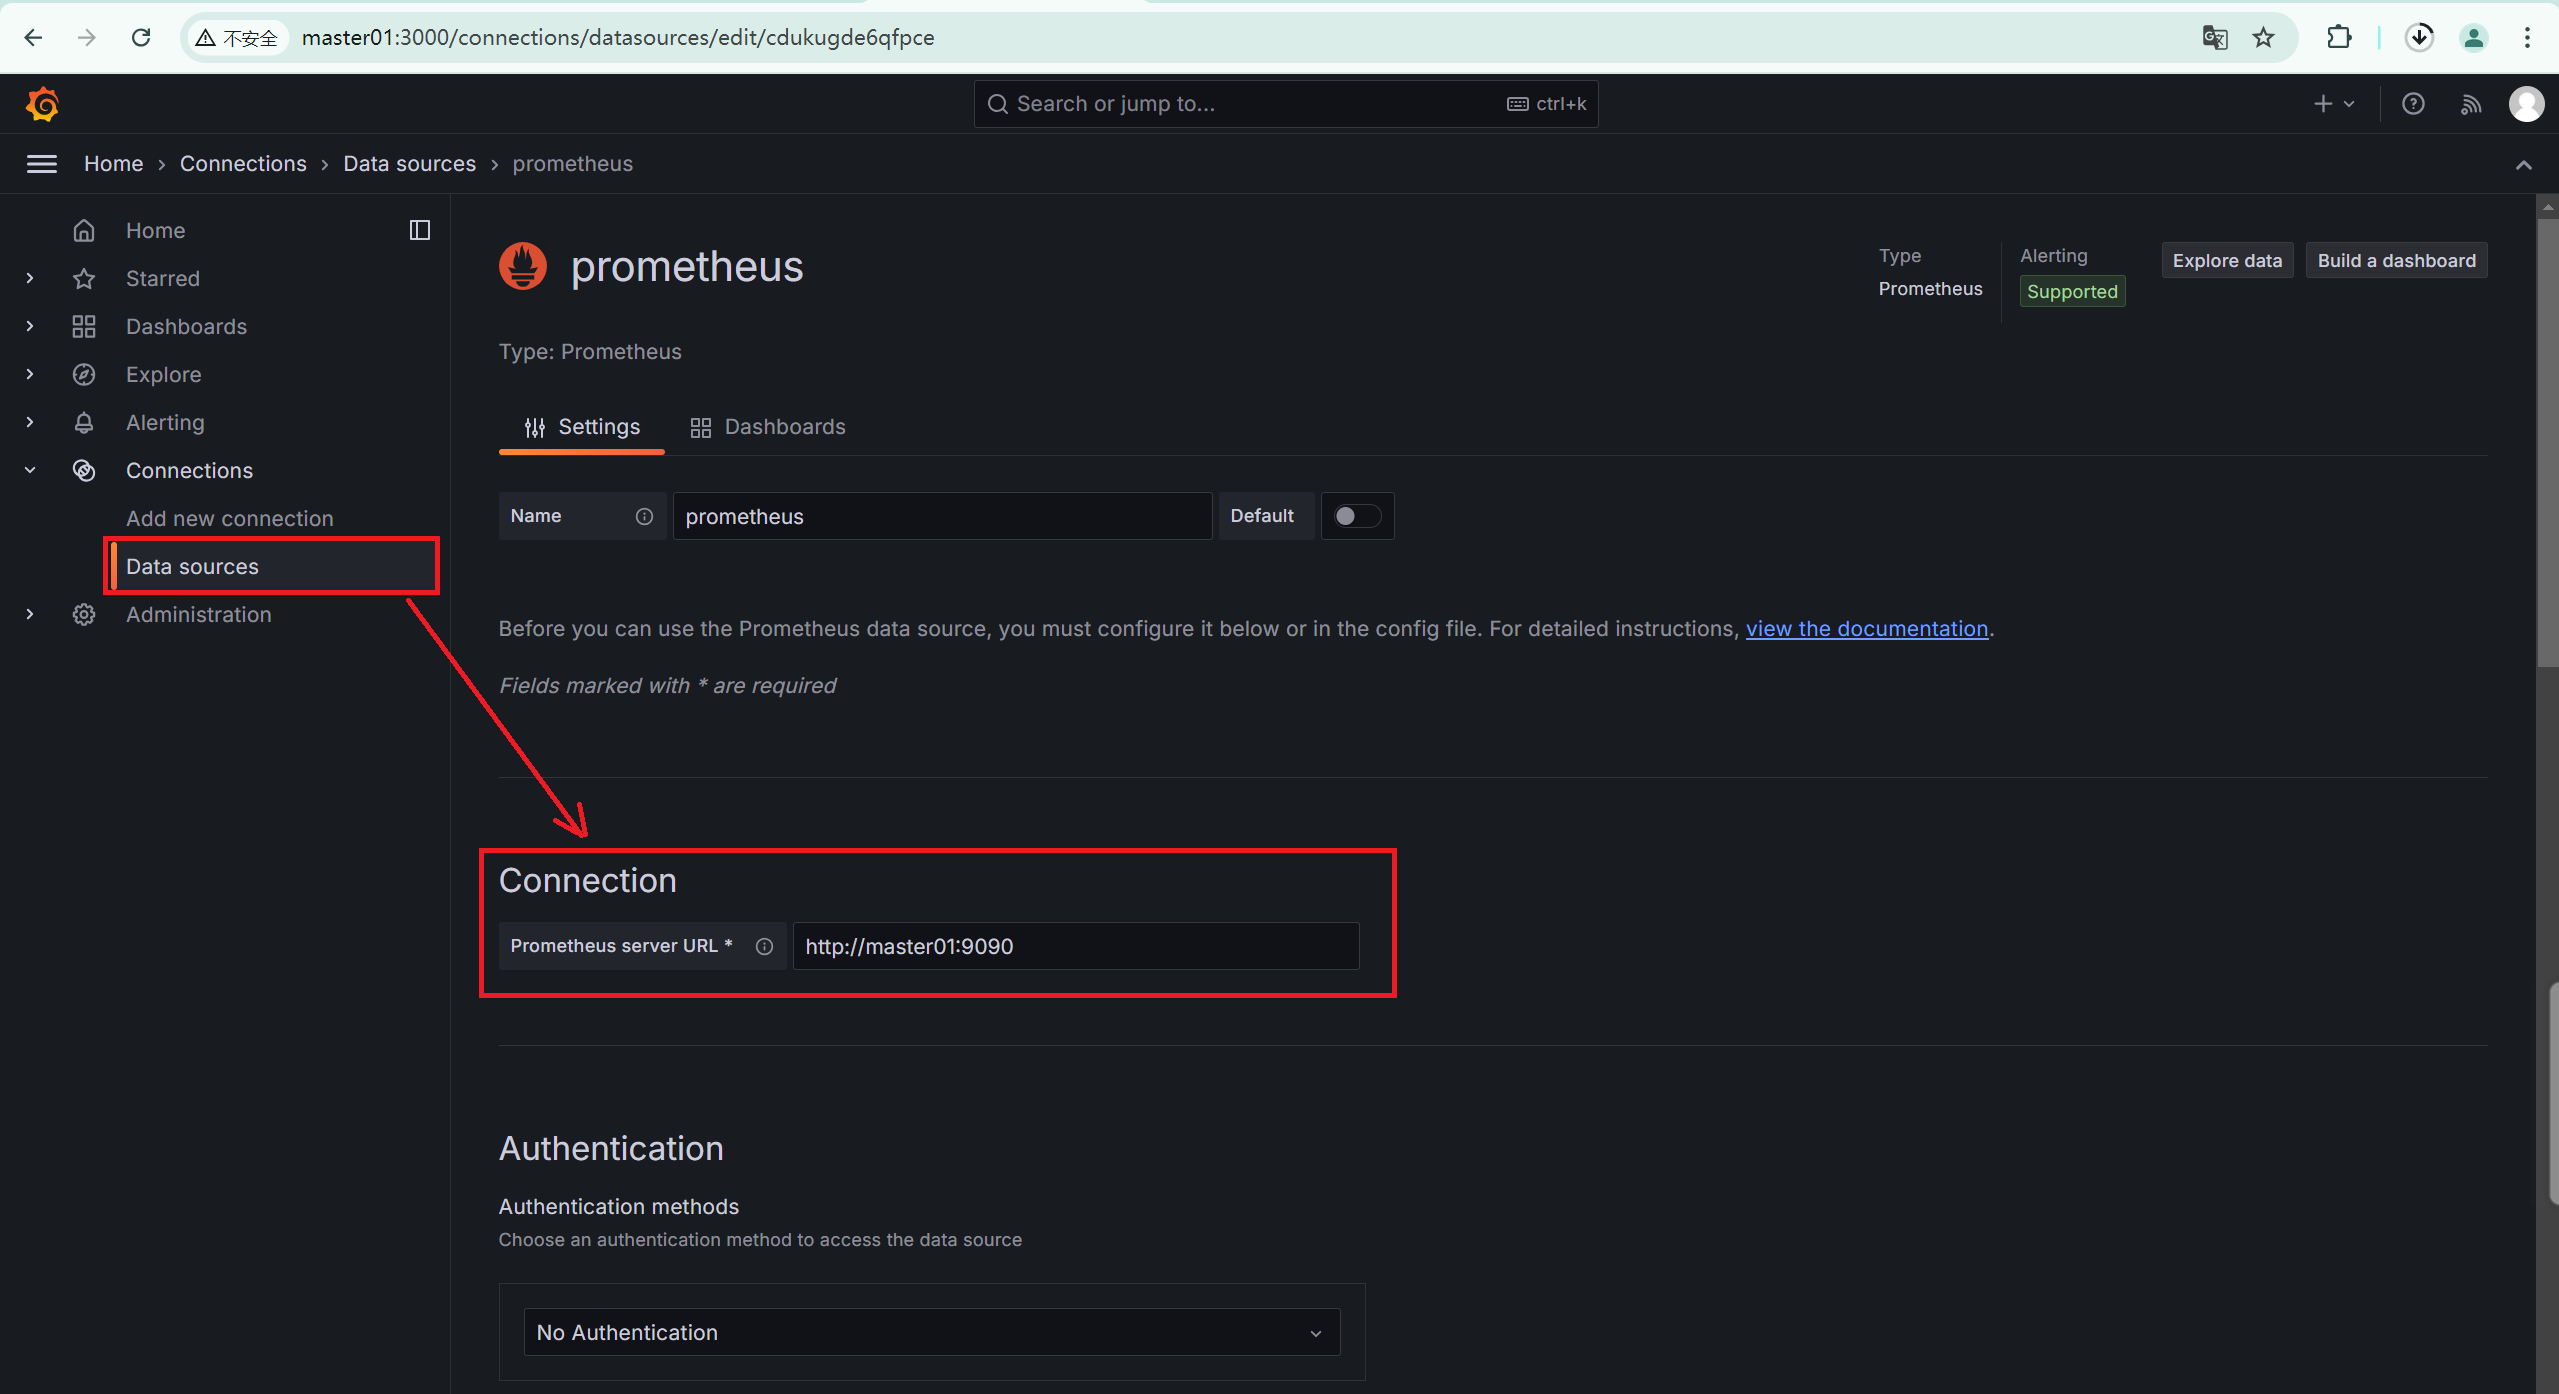
Grafana中的详细步骤:
配置Data sources,将【Prometheus组件导入进来】
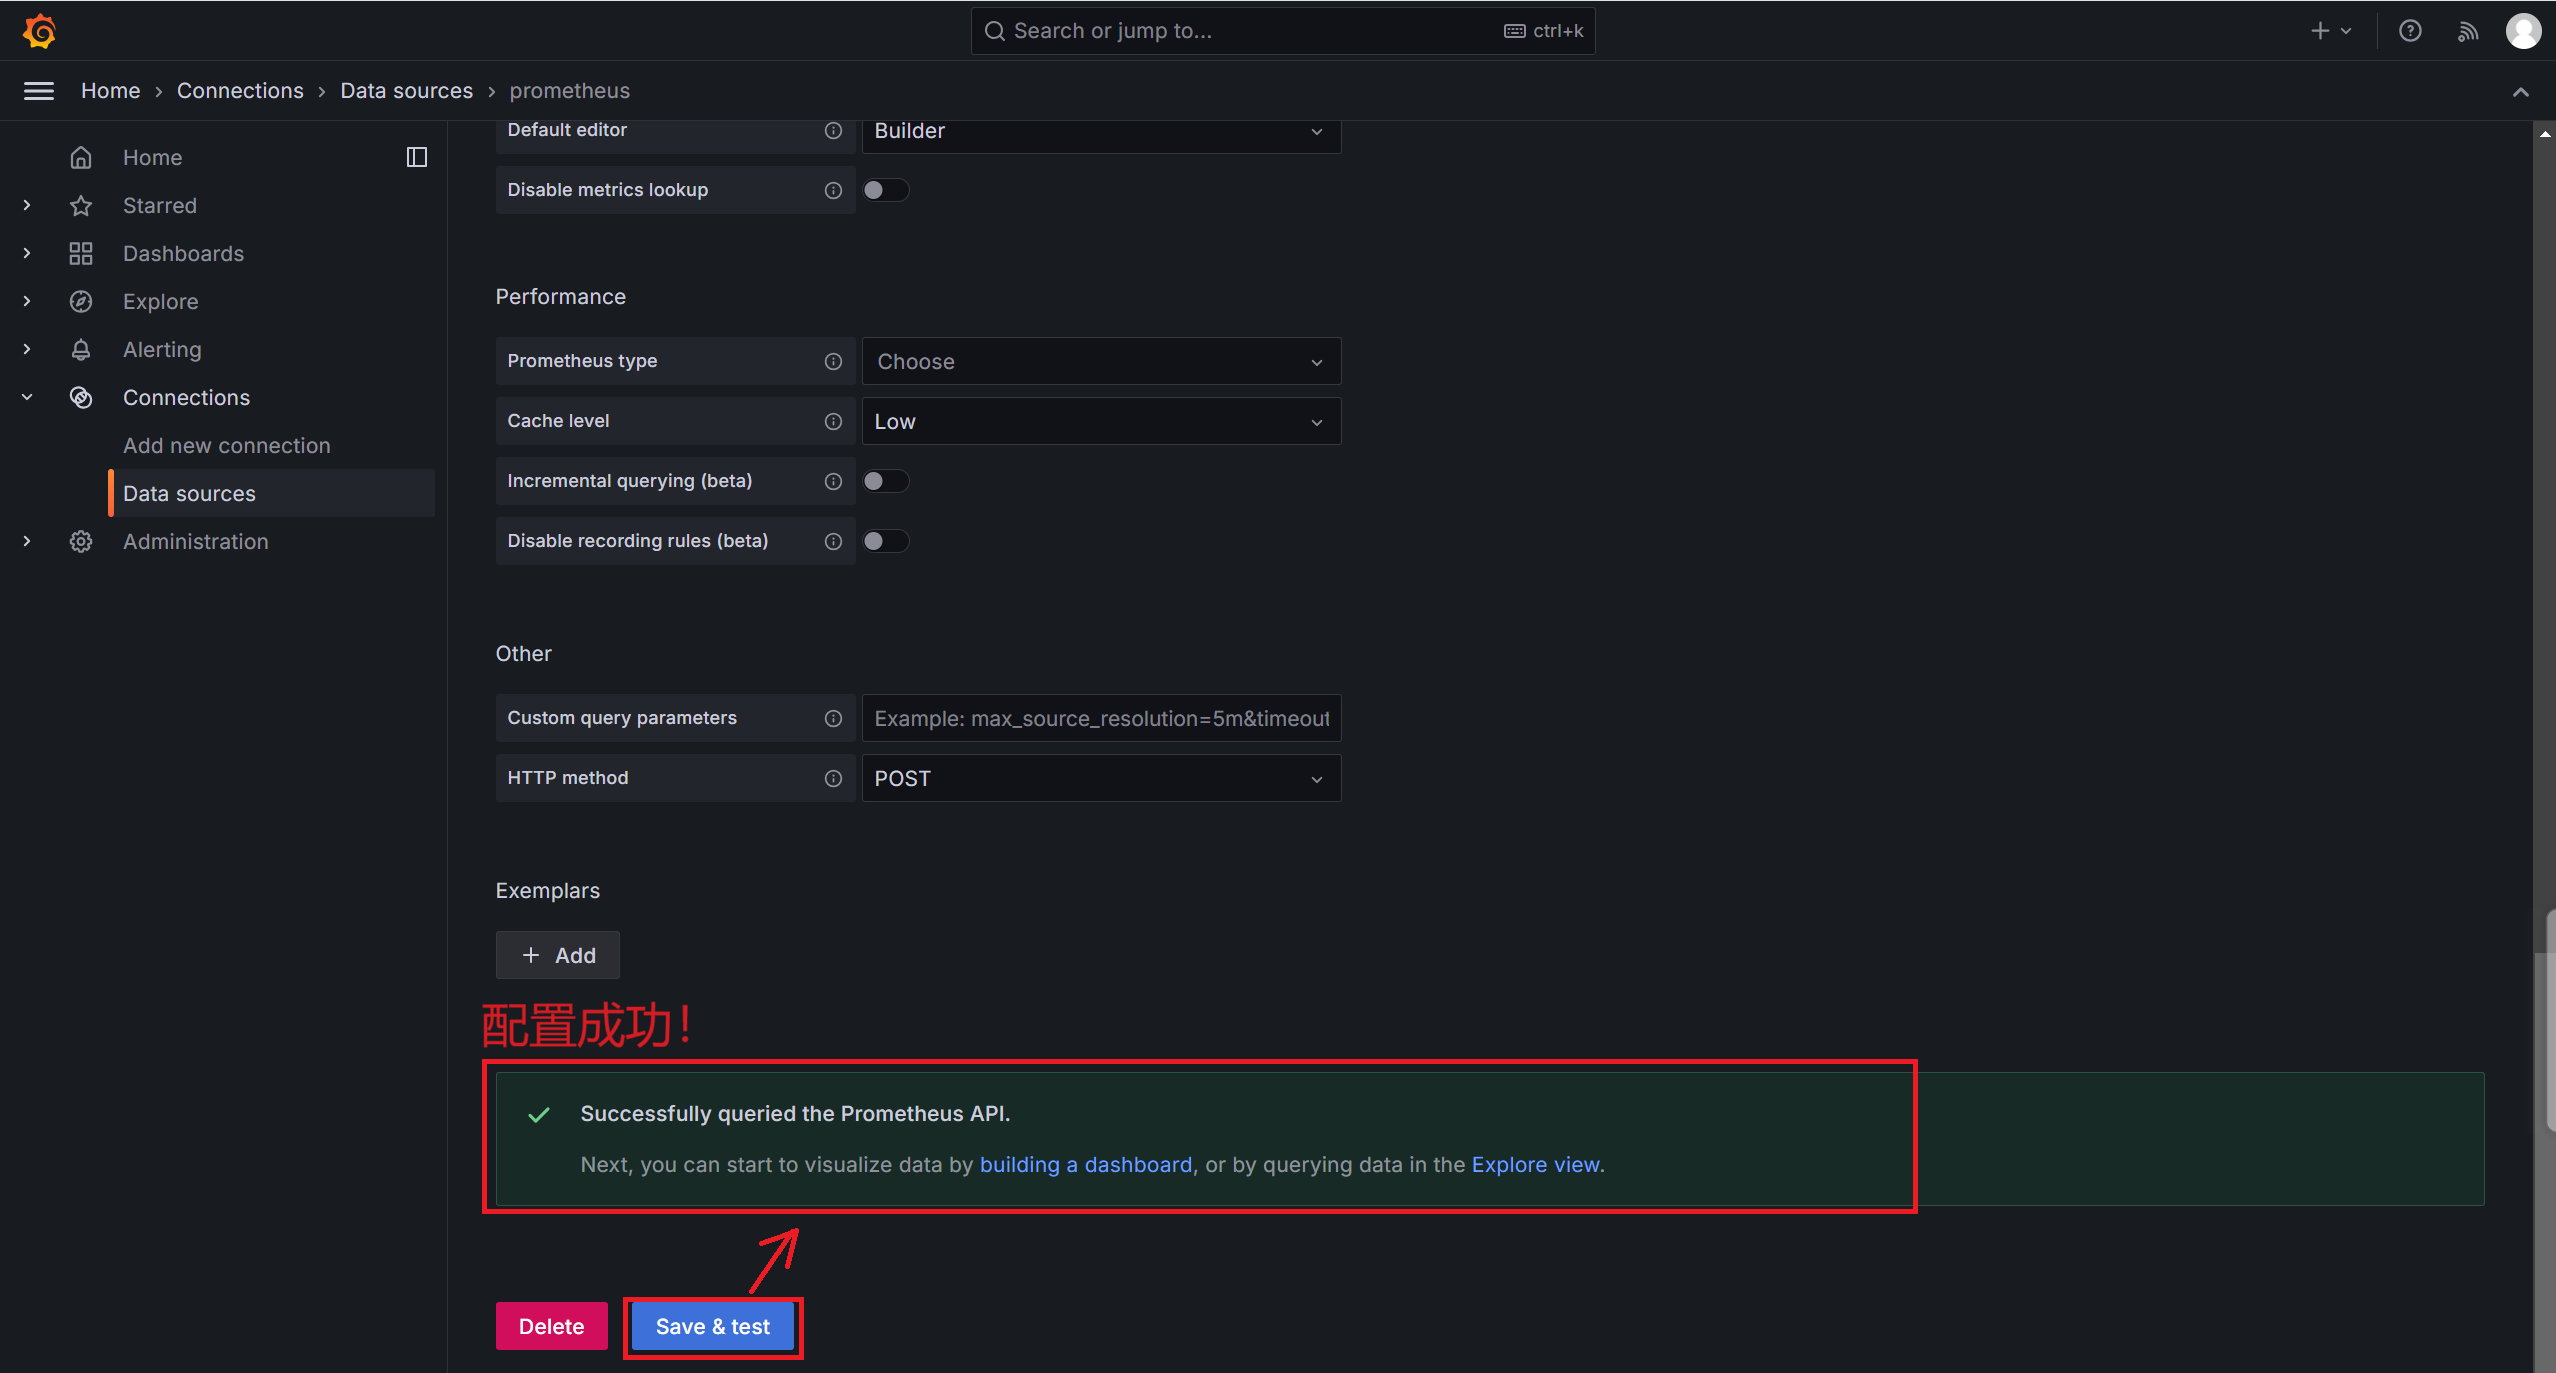
步骤一:只需要配置Connection选项即可
步骤二:点击
Save & test按钮,出现以下图案表示成功。
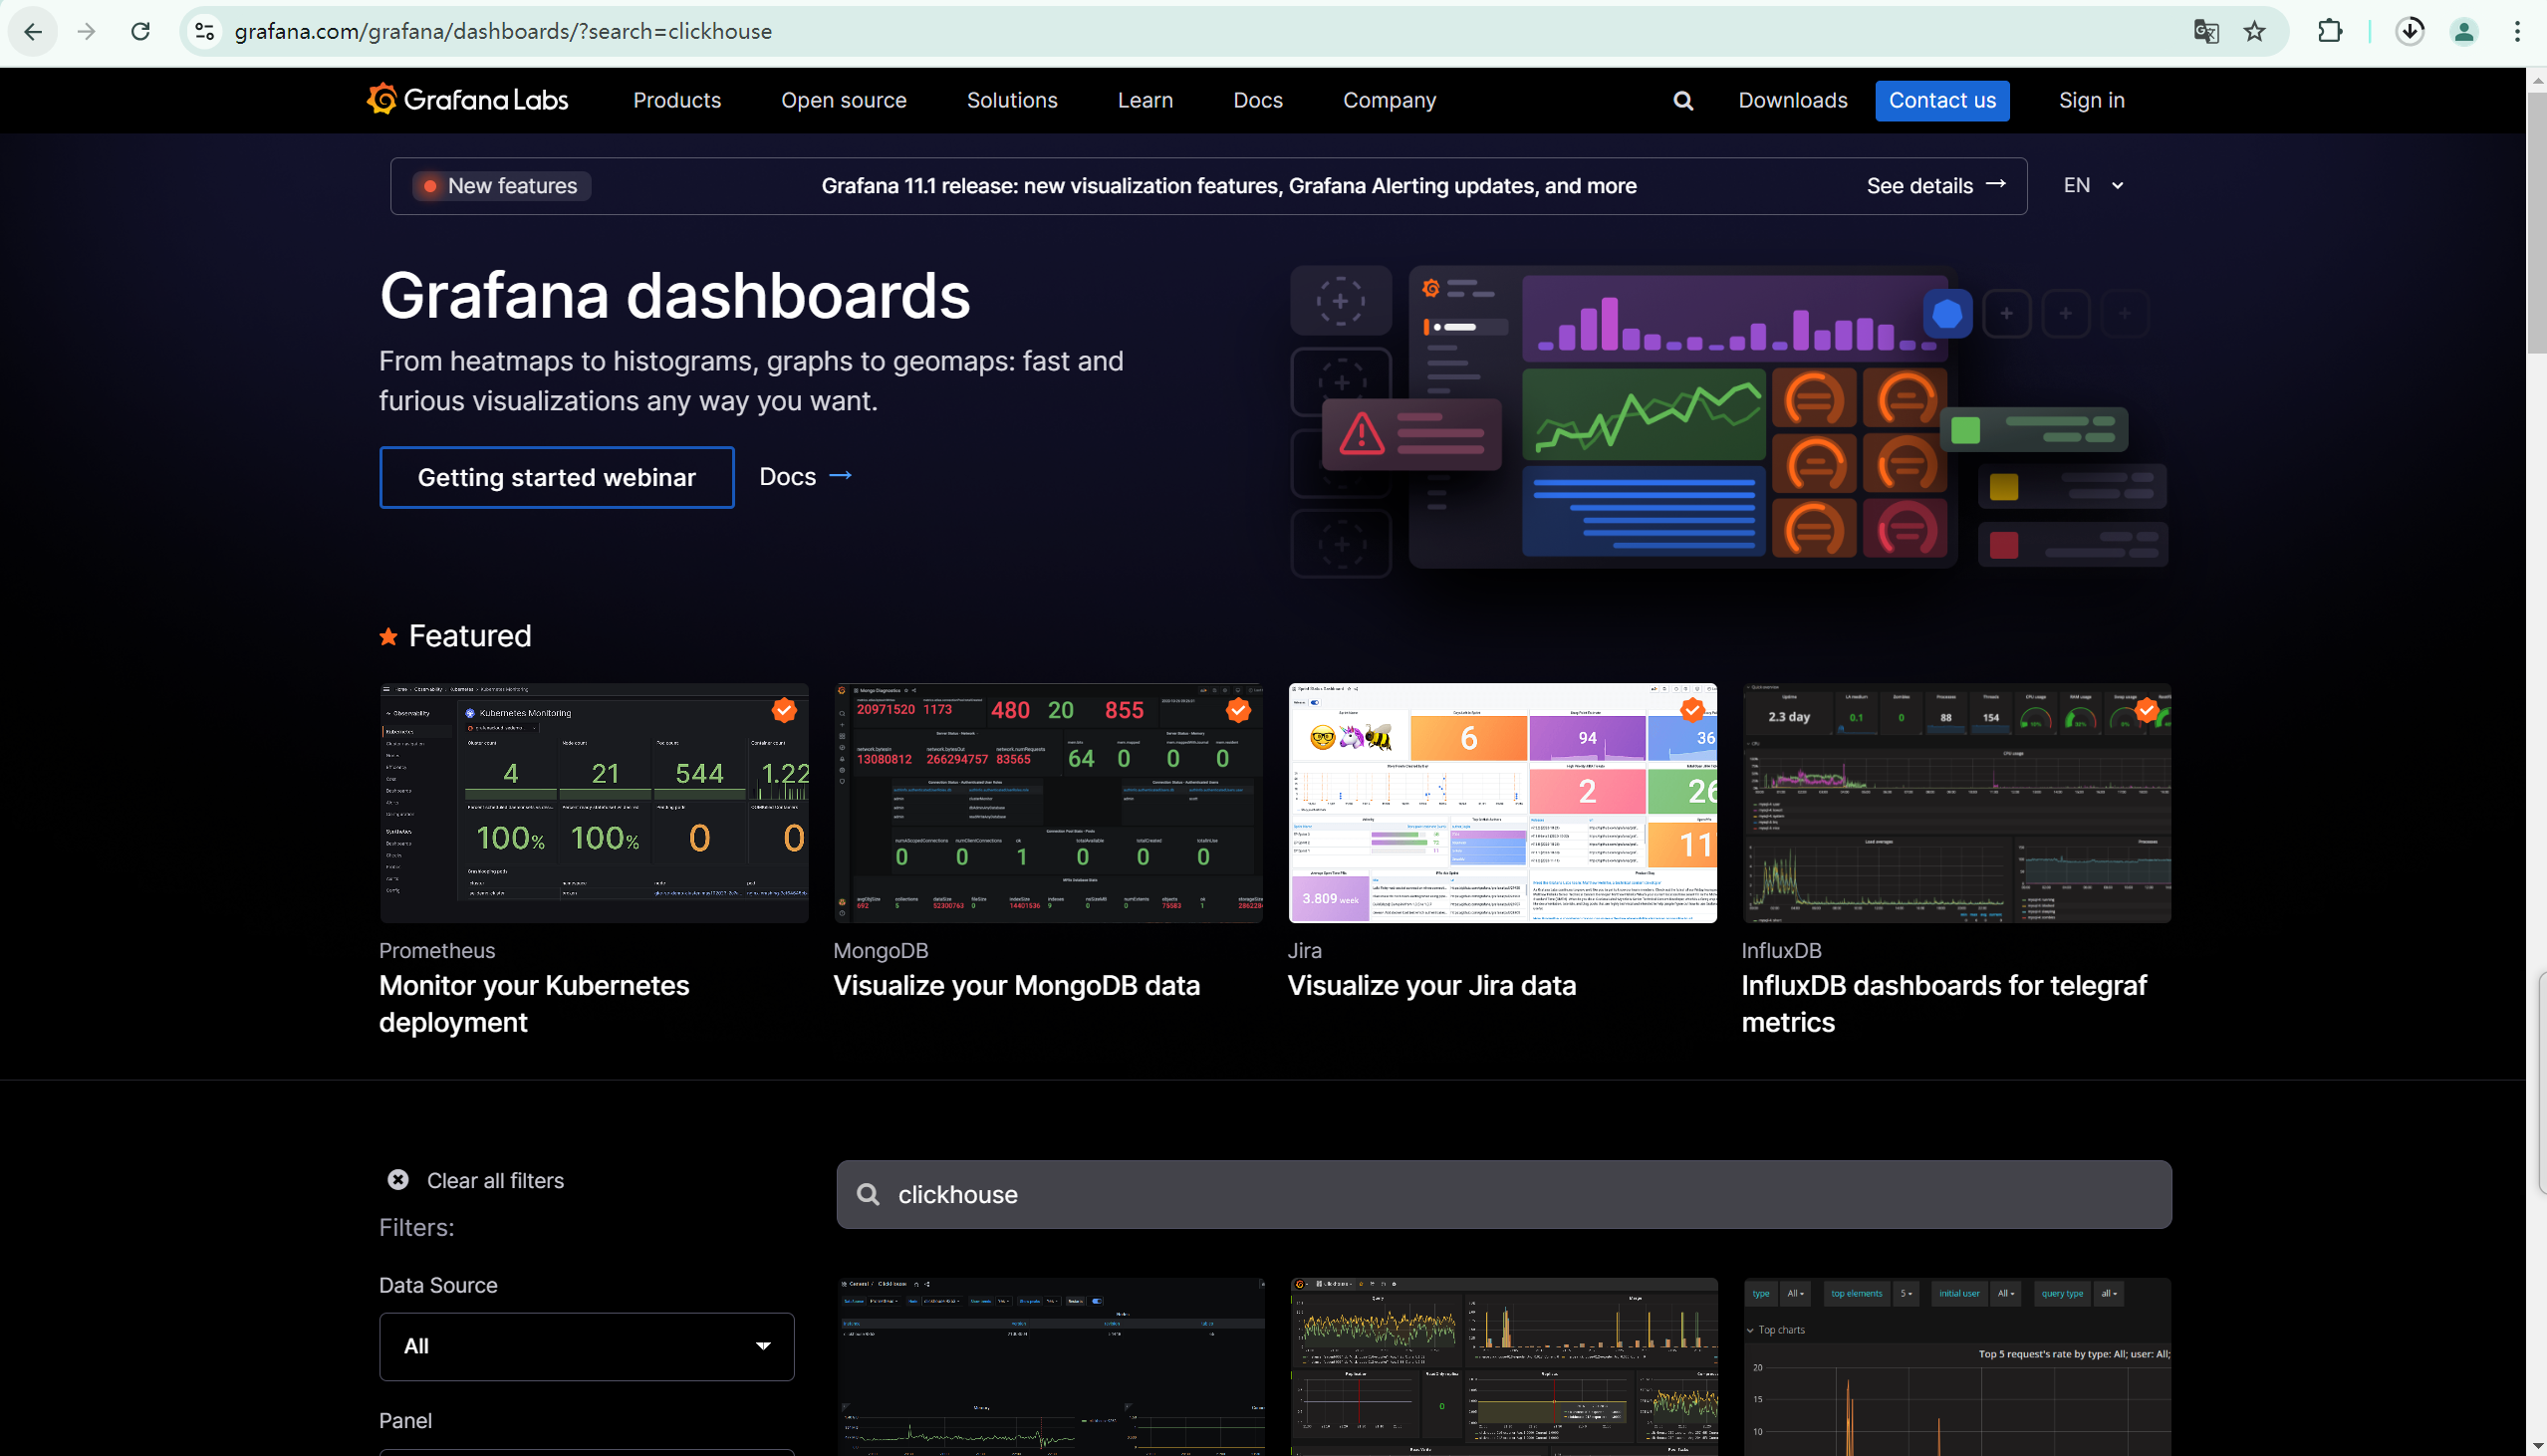
在grafana模版网站中找到一个心仪的模版,将其下载下来即可
grafana模版网站:https://grafana.com/grafana/dashboards/
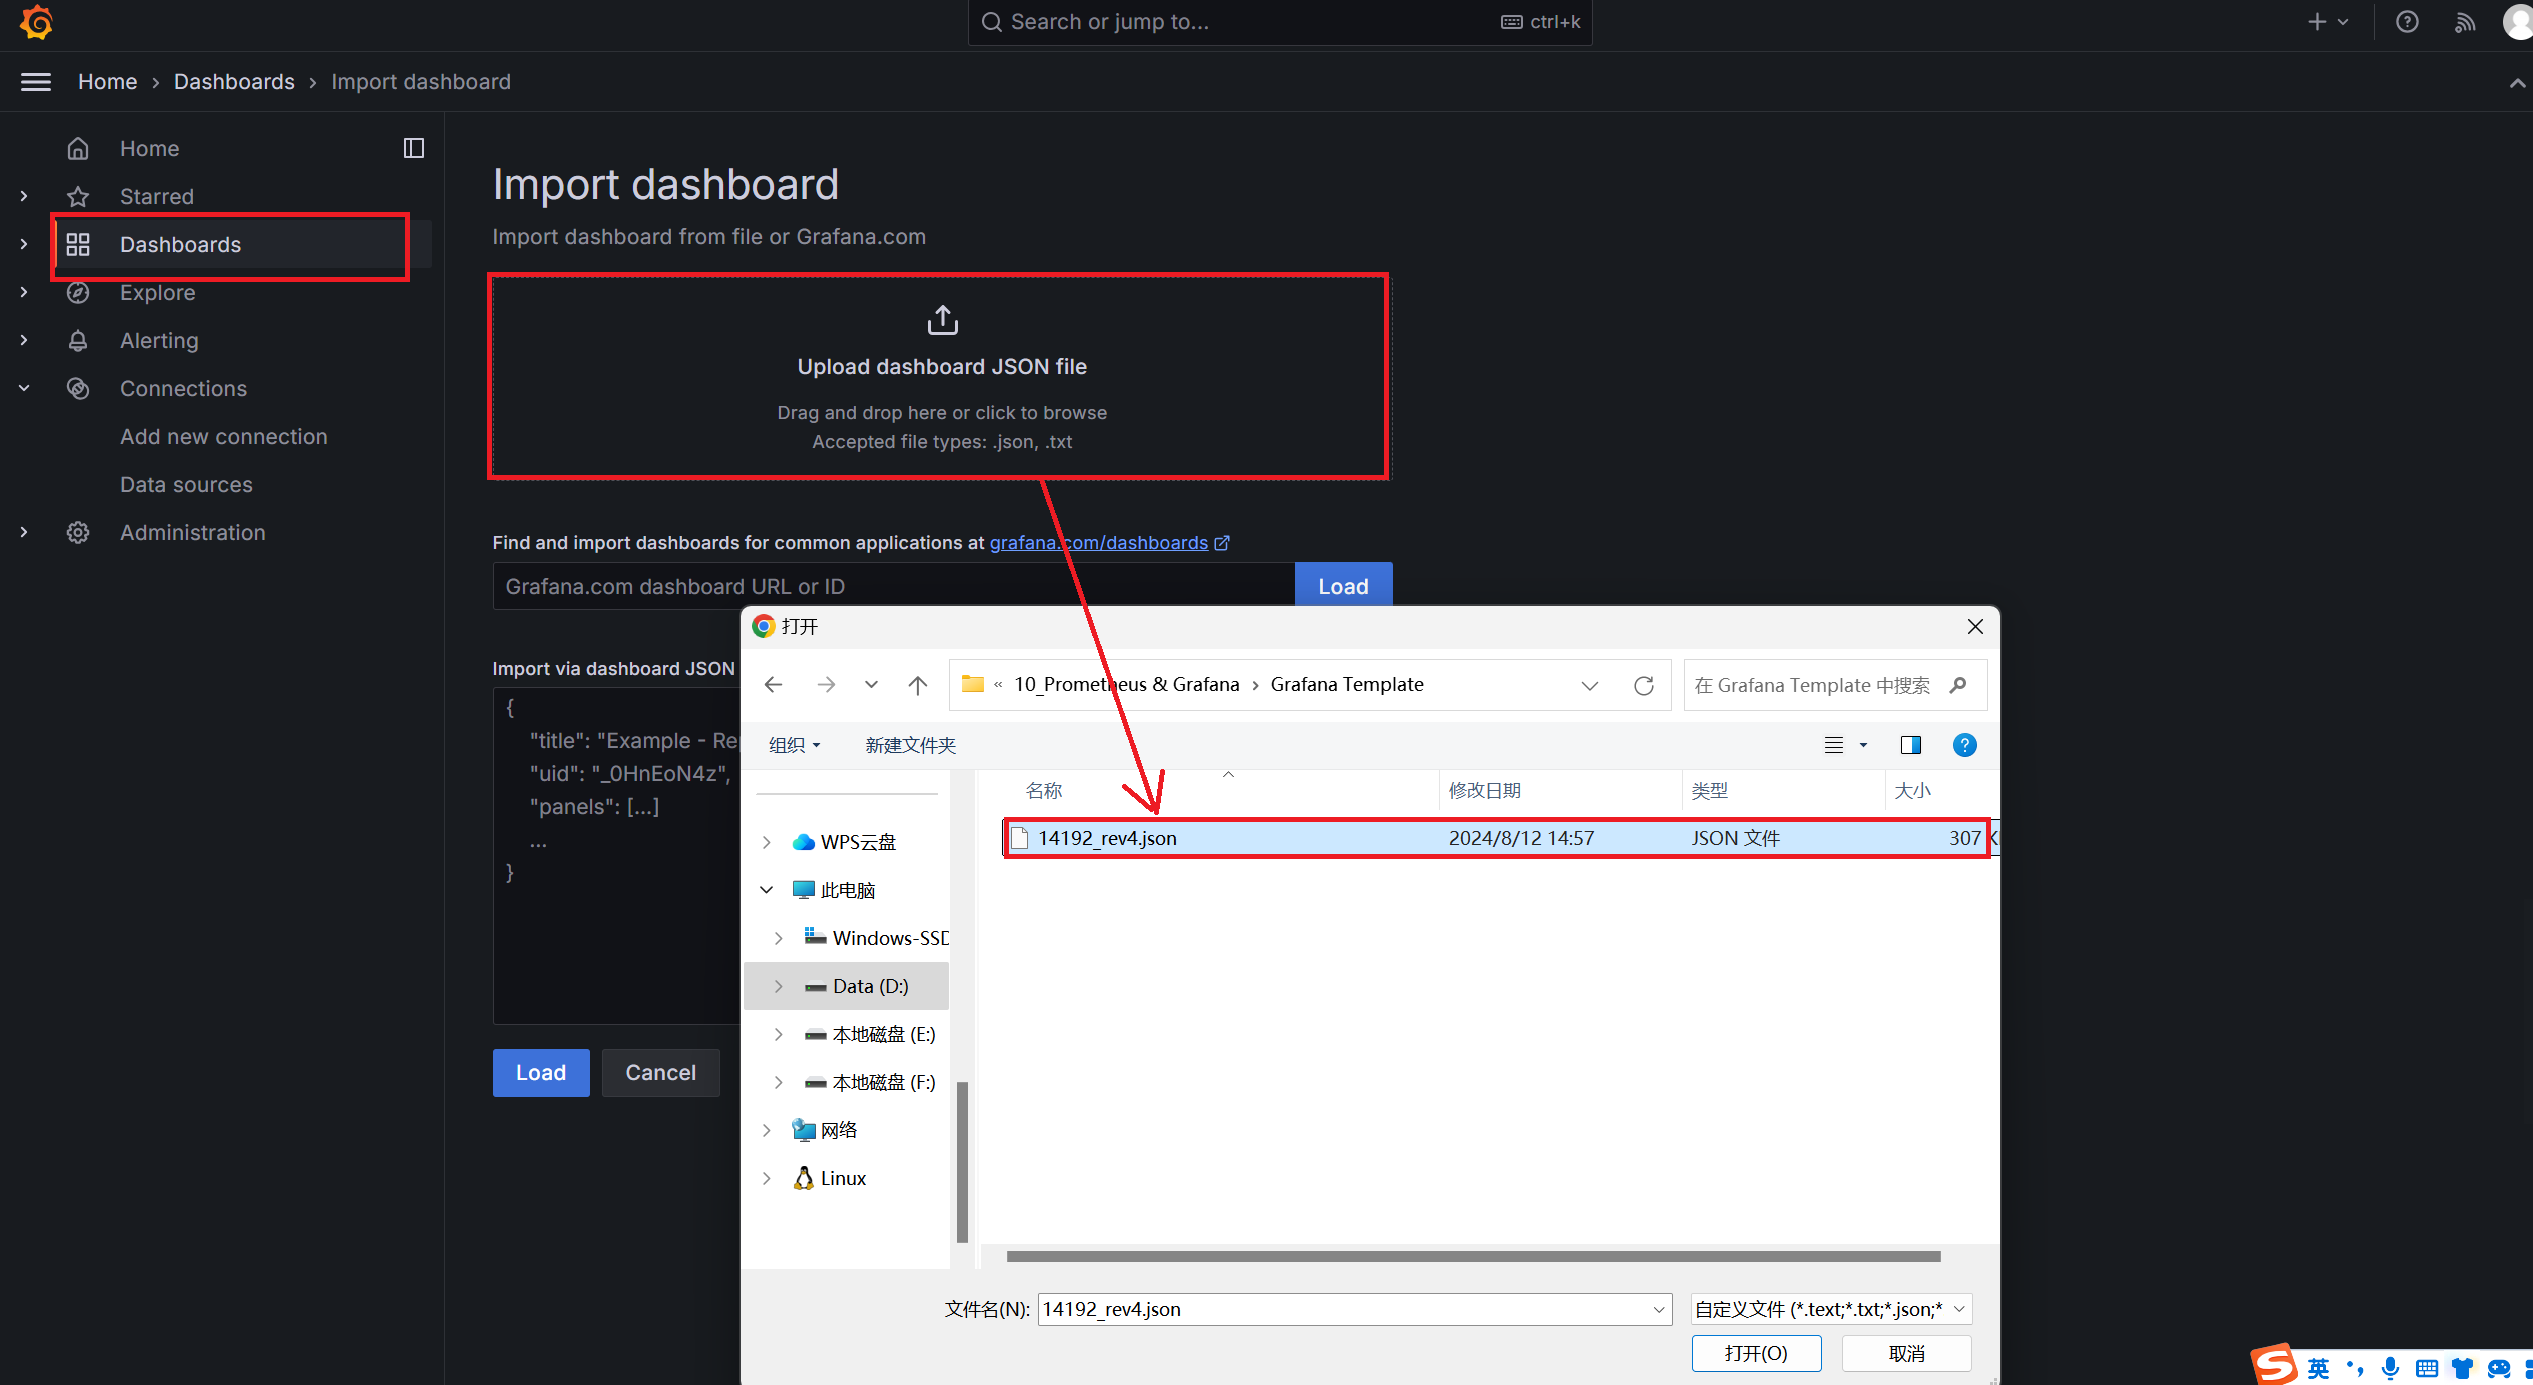
在Dashboards中配置可视化页面
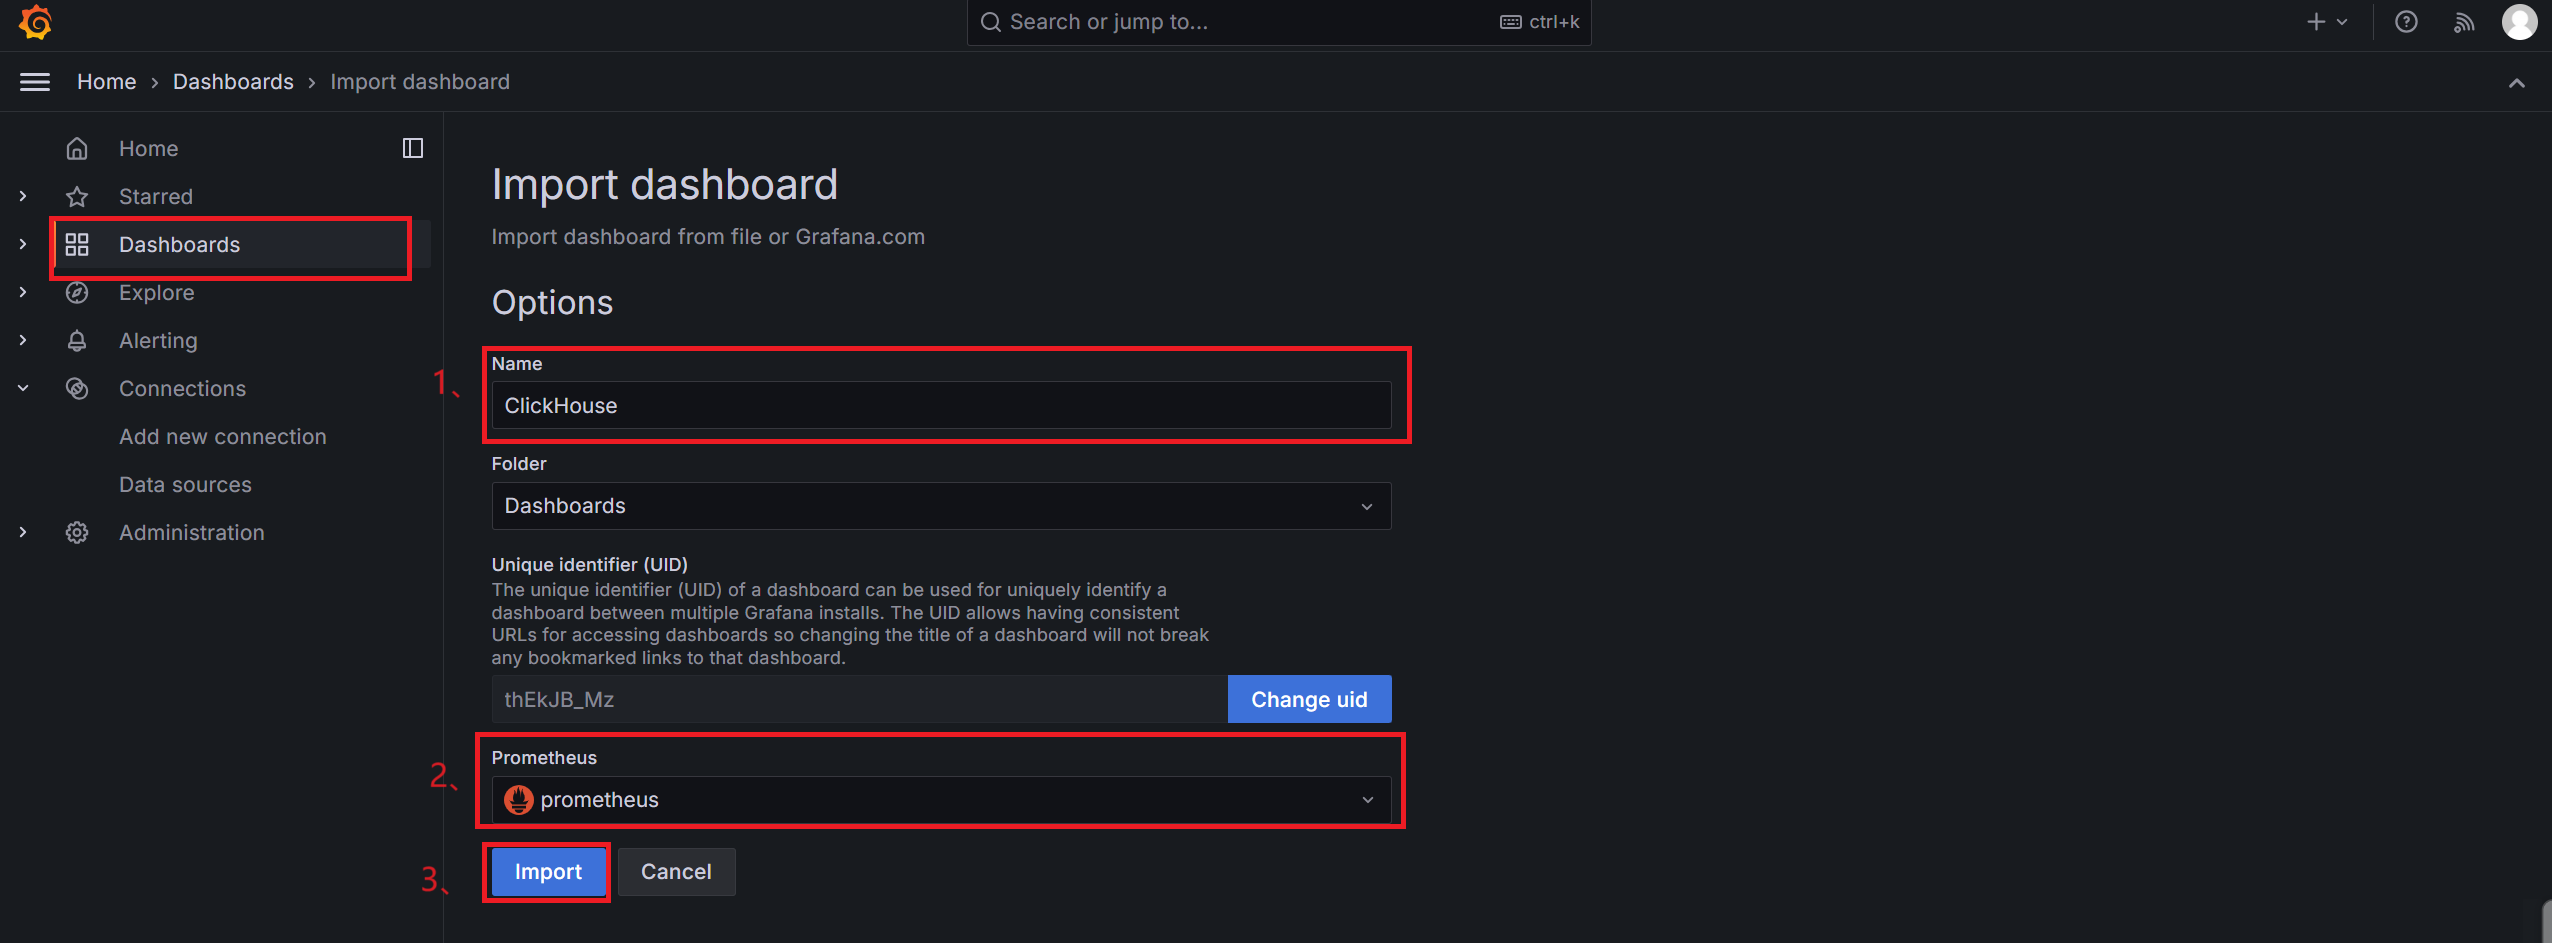
步骤一:点击“new”中的import选项,进入页面,将选好的模版导入
步骤二:进行配置
最终结果呈现
二:Grafana连接clickhouse
Grafana监控clickhouse,用于获取clickhouse中的数据,从而在大屏上展示内容。
详细步骤:
步骤一:创建用户并授权(开放授权管理)
1、进入clickhouse的users.xml中进行配置
vim /etc/clickhouse-server/users.xml ----------------------------------------------------------------------------------- <!-- Users and ACL. --> <users> <!-- If user name was not specified, 'default' user is used. --> <default> <password></password> <!-- 开放所有 ip 的访问权限 --> <networks> <ip>::/0</ip> </networks> <!-- 👉 取消注释,并将值设置为1,开放管理权限 👈 --> <access_management>1</access_management> </default> </users> -----------------------------------------------------------------------------------2、重启clickhouse服务
clickhouse status步骤二:导入grafana中的clickhouse插件
# 安装插件 grafana-cli plugins install grafana-clickhouse-datasource # 查看组件 ls /var/lib/grafana/plugins/ ------------------------------ grafana-clickhouse-datasource ------------------------------ # 列出已经安装的插件 grafana-cli plugins ls ---------------------------------------- installed plugins: grafana-clickhouse-datasource @ 4.3.2 ----------------------------------------步骤三:grafana重启
systemctl restart grafana-server步骤四:grafana页面操作
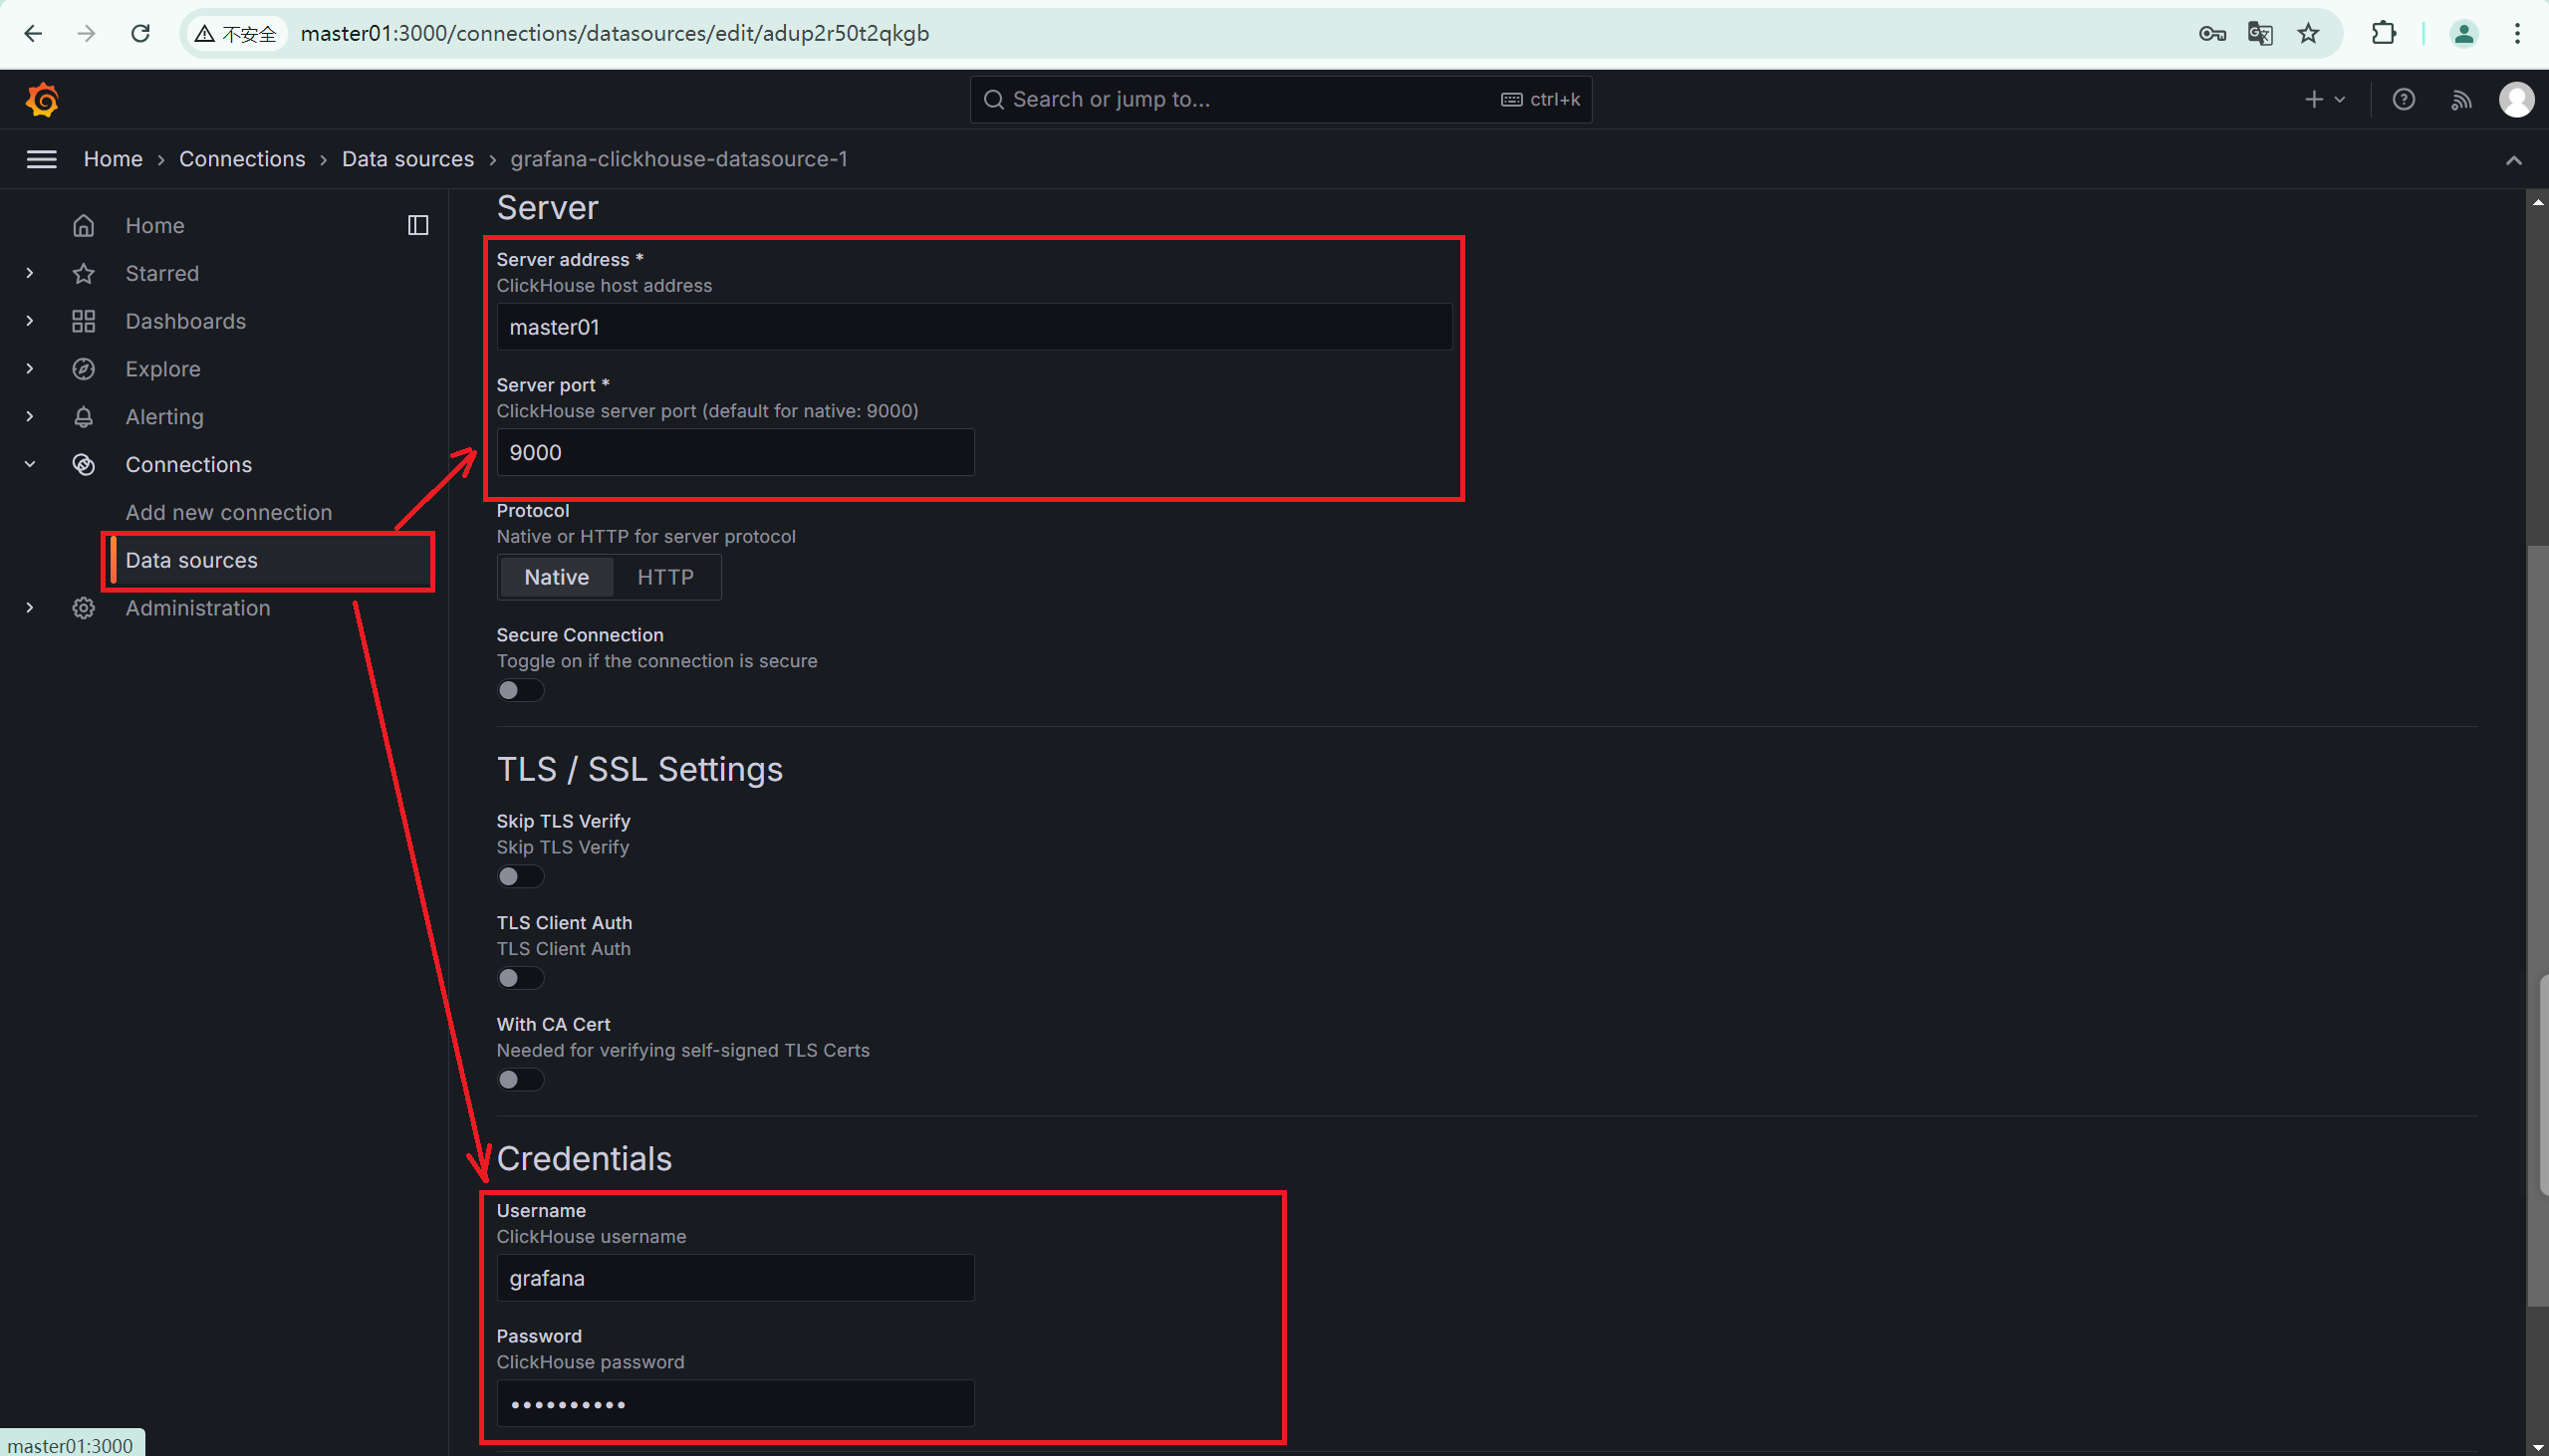
配置端口号以及账号密码
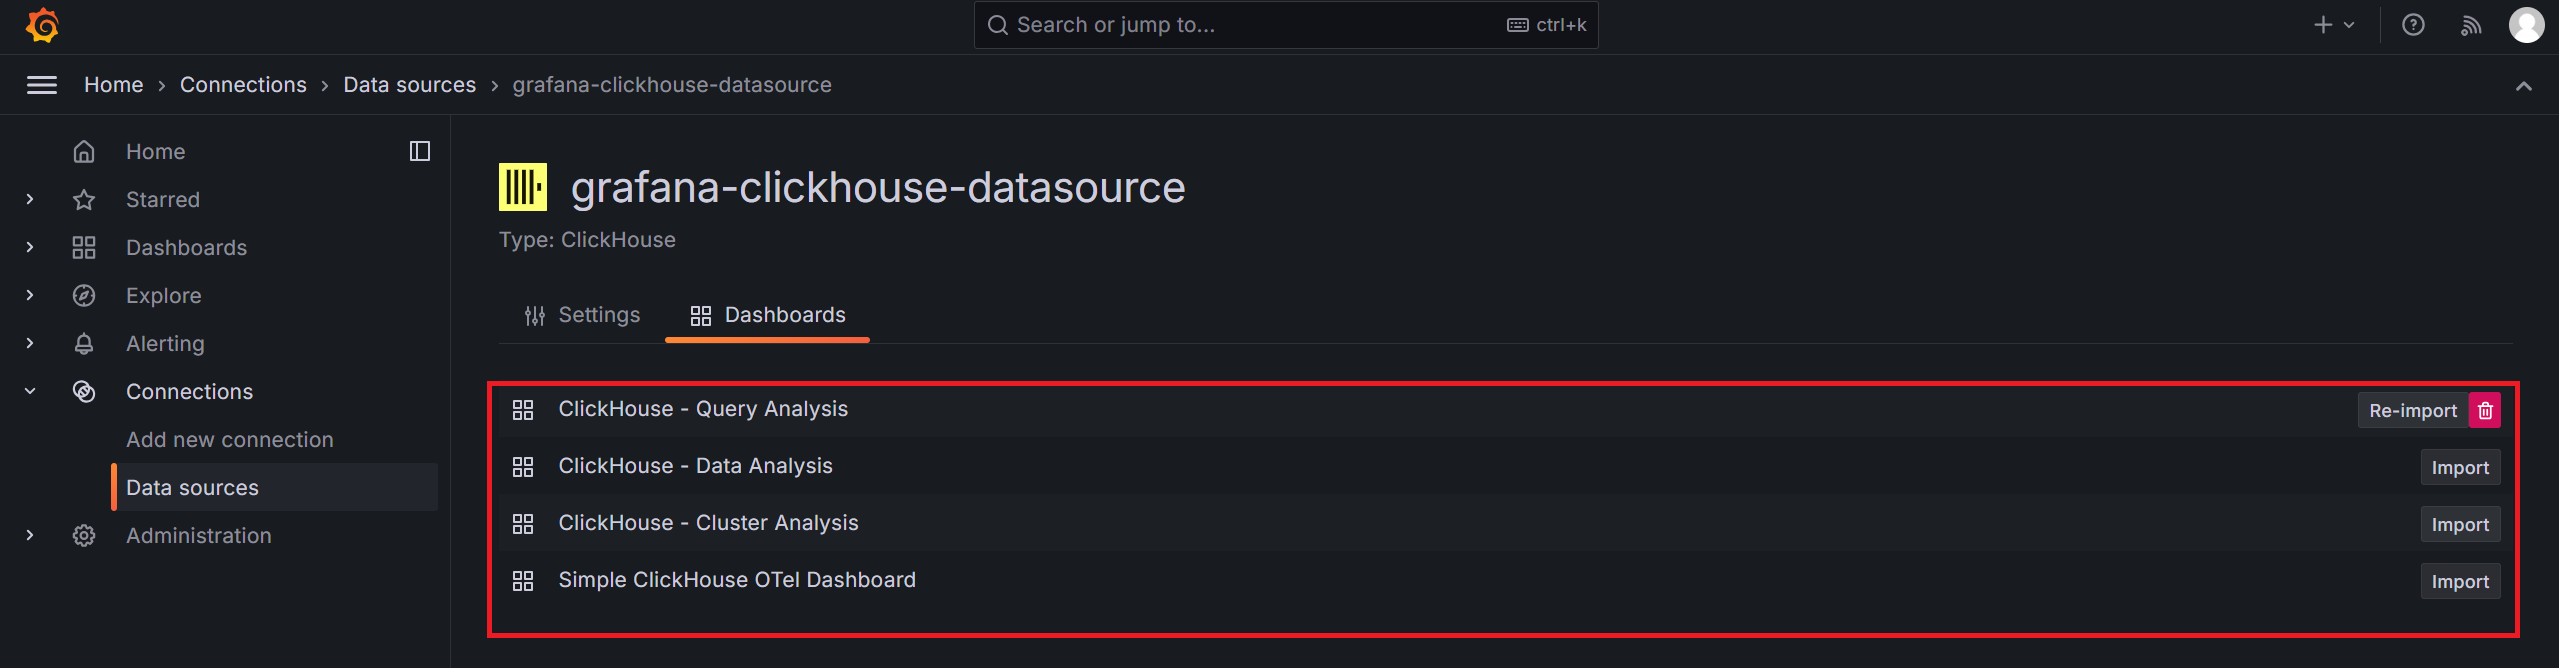
在Dashboards中会有四个模版,选取一个即可。
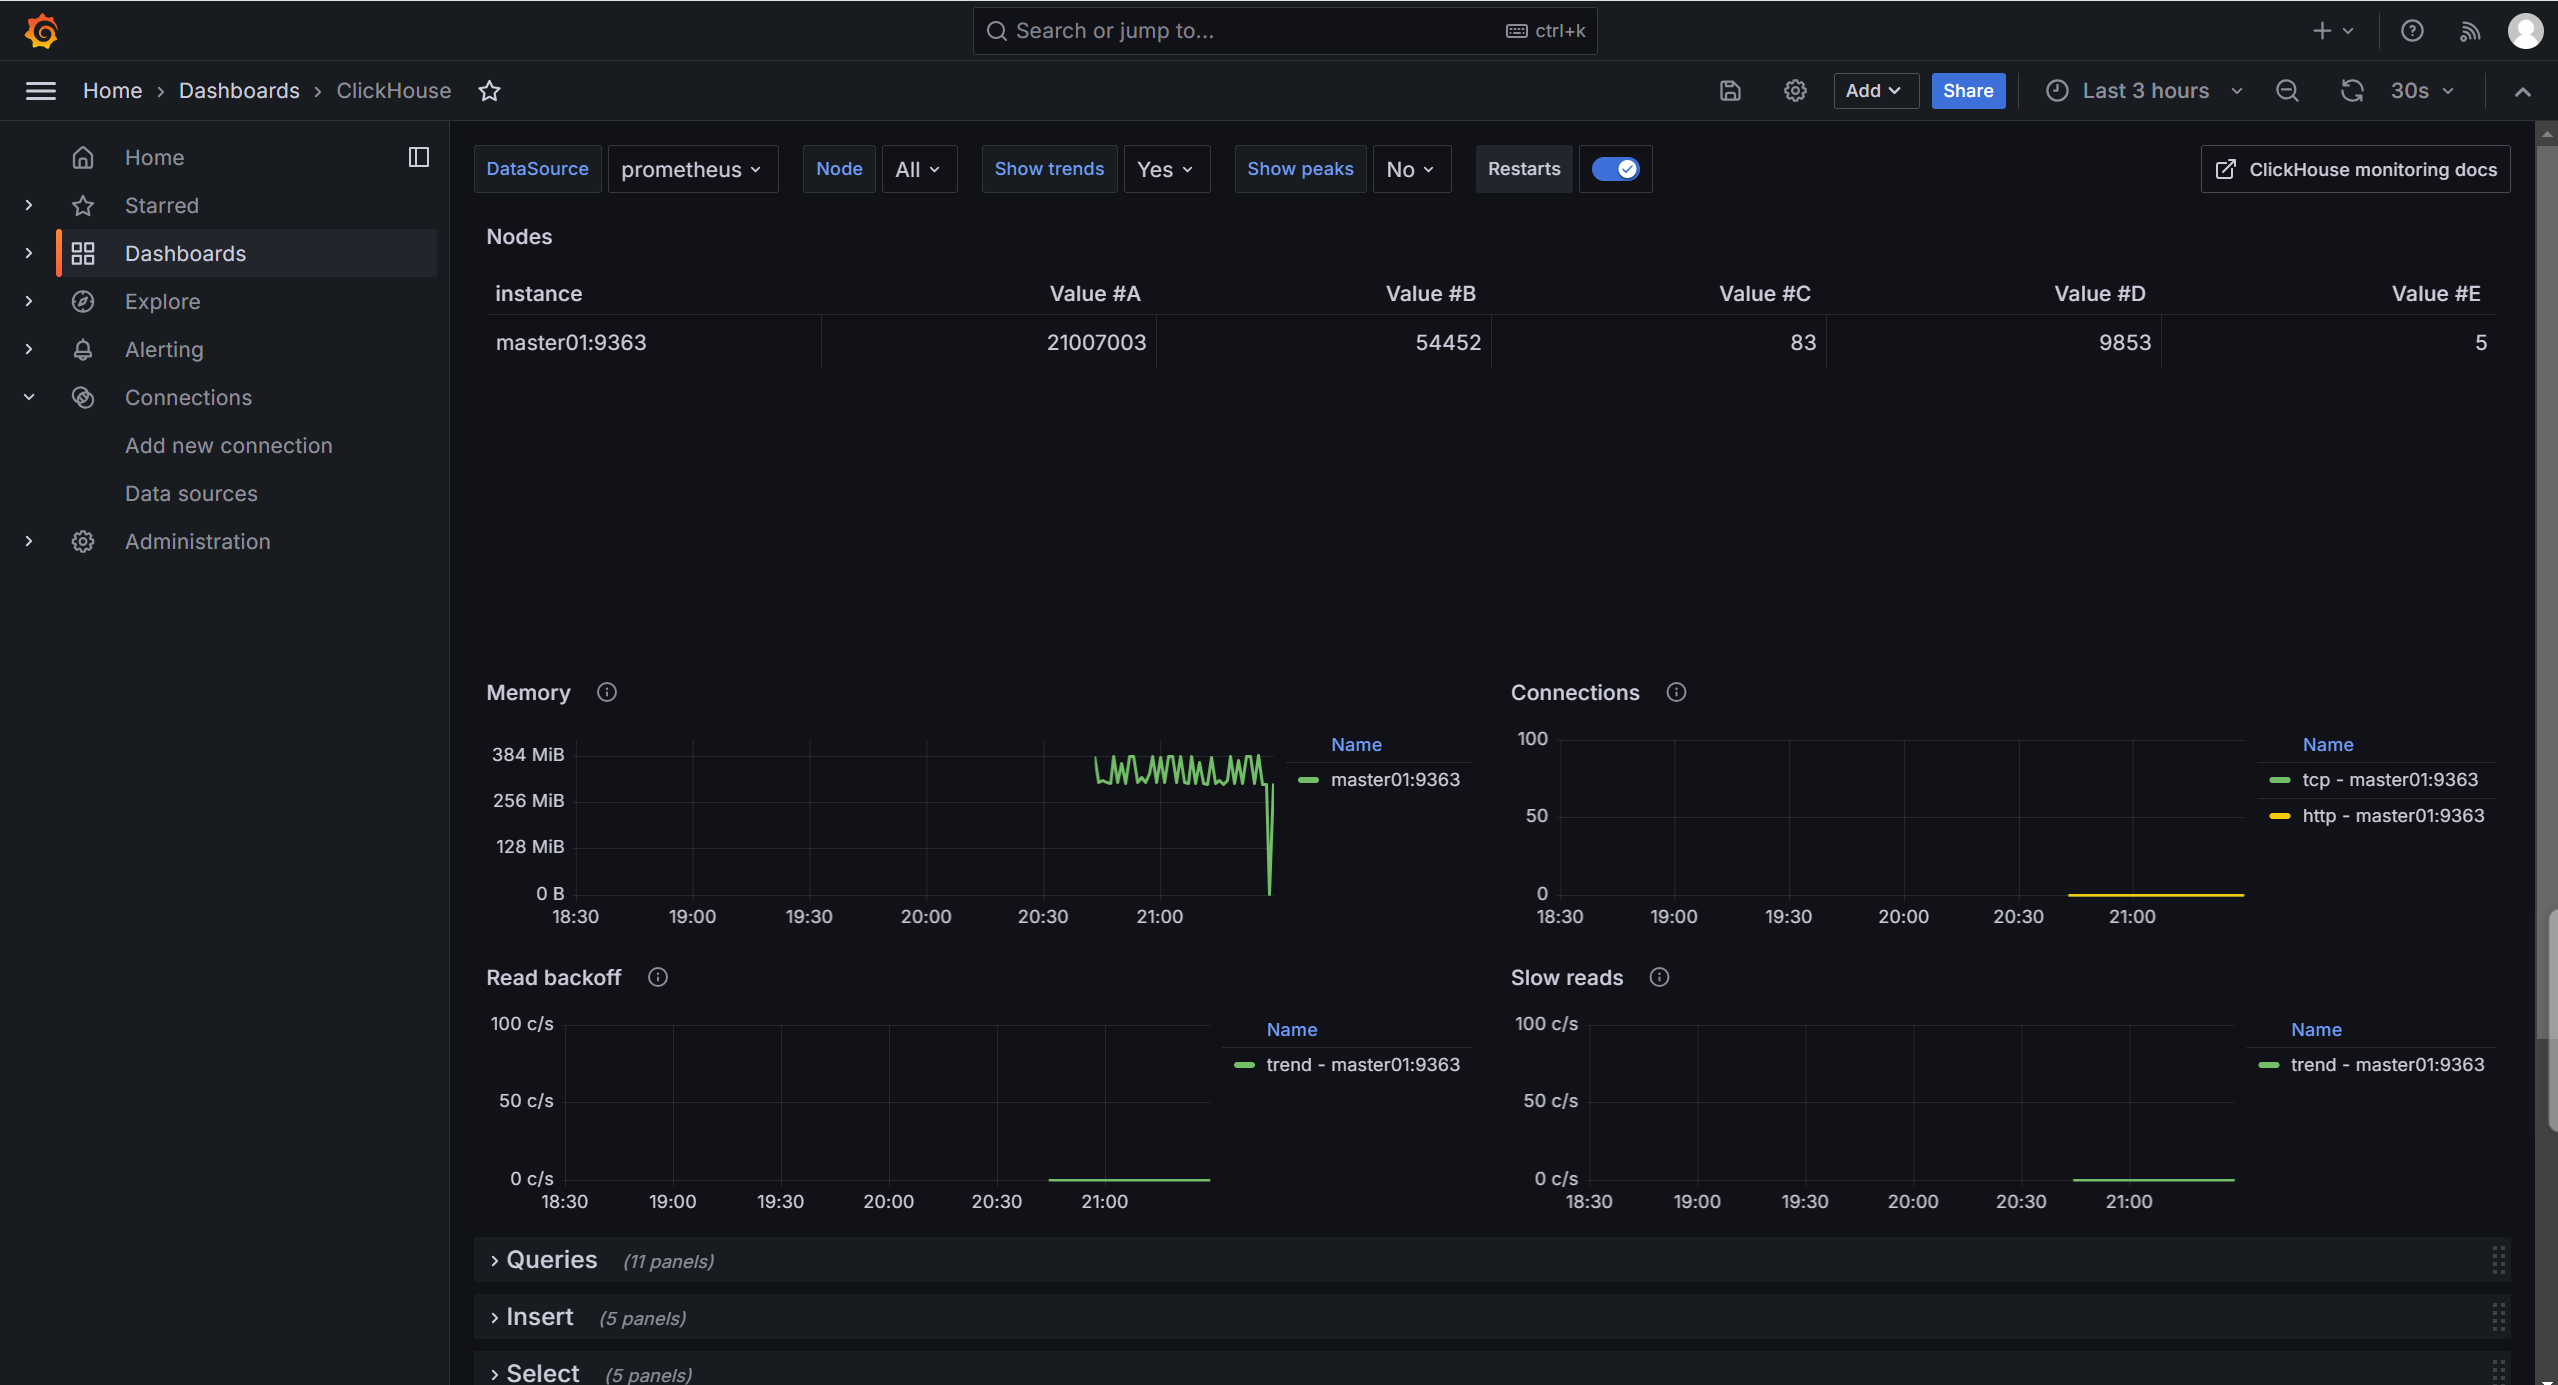
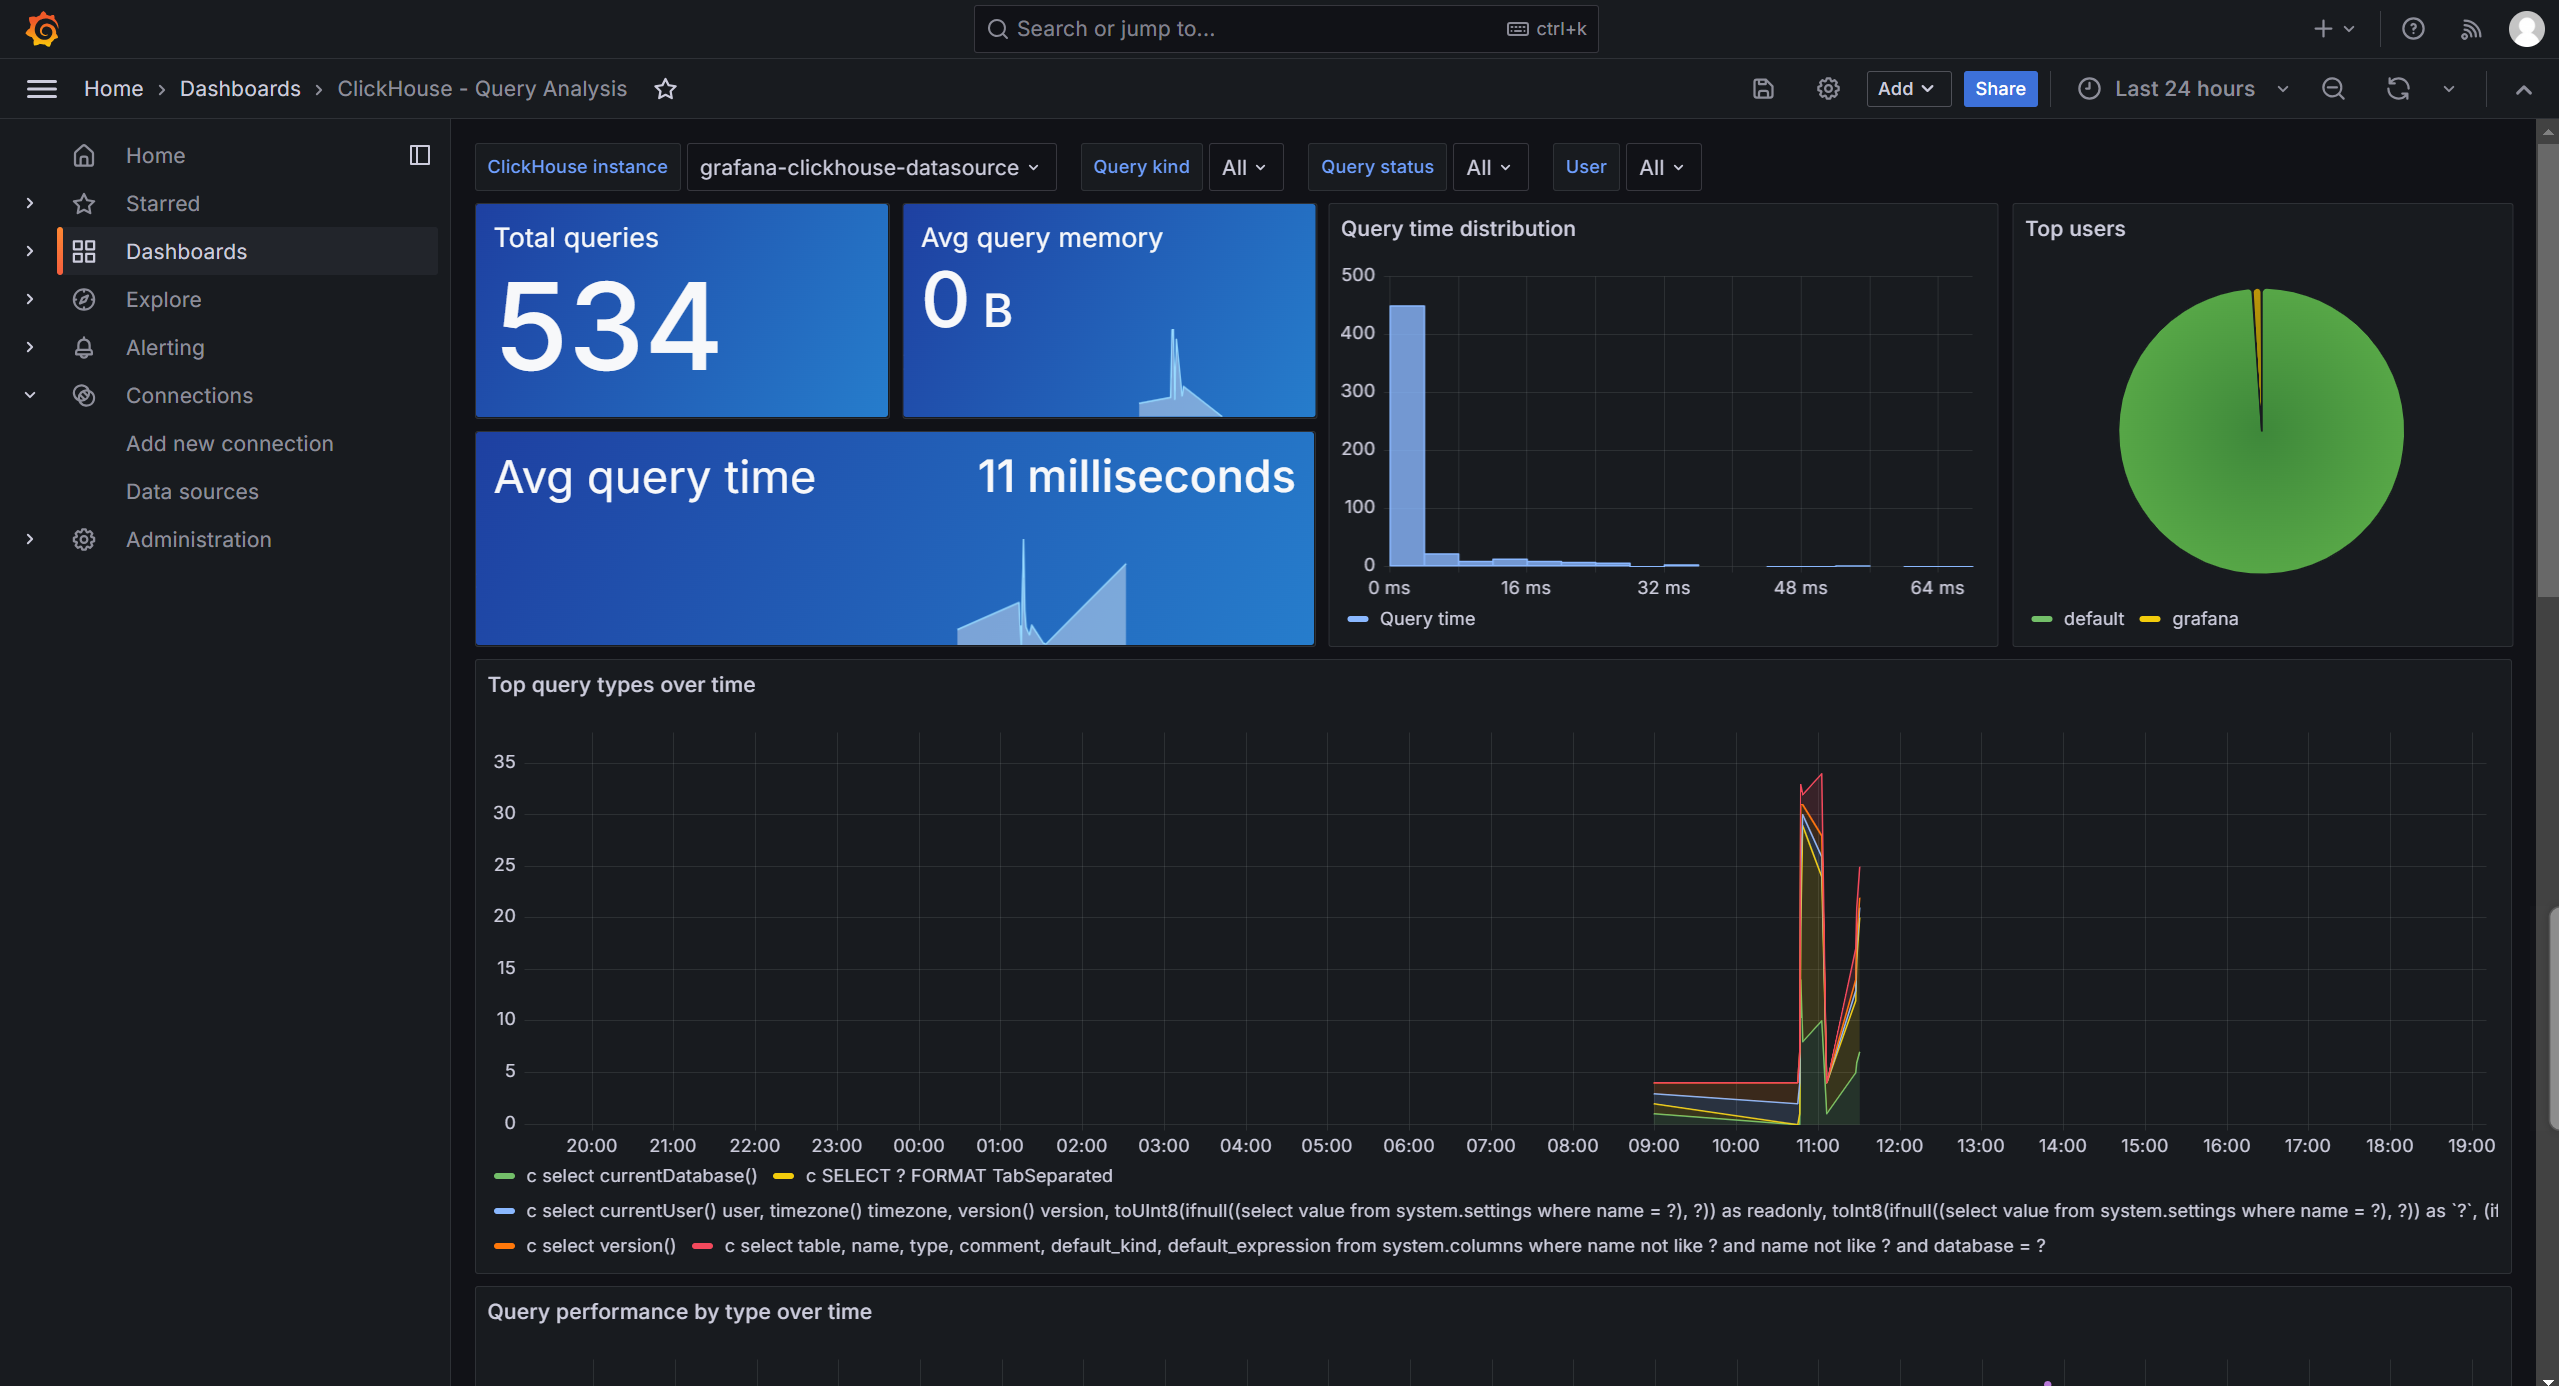
可以在左菜单中的DashBoards中看到最终结果。


 2089
2089

 被折叠的 条评论
为什么被折叠?
被折叠的 条评论
为什么被折叠?
 到【灌水乐园】发言


