


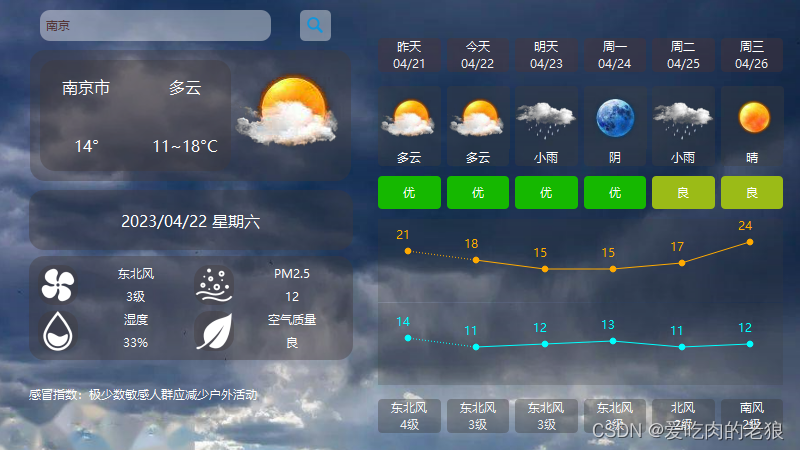
最近在学习如何获取天气信息并展示,通过总结别人博客加自己的理解, 使用Qt写了一版天气预报。
城市搜索功能
该功能模块可以实现从Lineedit获取用户输入的城市,处理后获取对应的天气信息。
#include <QNetworkAccessManager>
#include <QNetworkReply>

protected:
Q_INVOKABLE void getWeatherInfo(QString cityName);  // 通过城市编码获取天气信息
private:
QNetworkAccessManager *mNetAccessManager;// Http请求

//获取天气信息
void Weather::getWeatherInfo(QString cityName)
{
    QString cityCode= getCityCode(cityName);
    if(cityCode.isEmpty())
    {
      return;
    }
    QUrl url("http://t.weather.itboy.net/api/weather/city/"+cityCode);
    mNetAccessManager->get(QNetworkRequest(url));
}
请求的url为 http://t.weather.itboy.net/api/weather/city/cityCode
cityCode为城市编码,每一个城市对应一个编码,例如北京的编码为101010100, 替换上述链接的cityCode即可查询北京的天气。对于不同城市的编码可以从网上下载后(JSON格式)放入Qt的资源文件,当我们输入一个城市查询天气时,可以读资源文件找到对应城市的编码,将编码替换cityCode后获取天气信息。
天气信息显示
因为获取信息需要联网,需要在pro文件增加 QT += network 并引入头文件QNetworkAccessManager和QNetworkReply
#include <QNetworkAccessManager>
#include <QNetworkReply>
#include <QJsonArray>
#include <QJsonObject>
#include <QJsonDocument>
#include <QJsonParseError>

//网络对象
mNetAccessManager=new QNetworkAccessManager(this);
connect(mNetAccessManager,SIGNAL(finished(QNetworkReply*)),this,SLOT(onReplied(QNetworkReply *)));

// 处理HTTP服务返回数据
void Weather::onReplied(QNetworkReply *reply)
{
    int statusCode=reply->attribute(QNetworkRequest::HttpStatusCodeAttribute).toInt();
    if(statusCode!=200 || reply->error()!=QNetworkReply::NoError)
    {
        QMessageBox::warning(this,"天气","请求数据失败",QMessageBox::Ok);
    }
    else
    {
        QByteArray byteArray=reply->readAll();
        parseJson(byteArray);// 分析Json数据
    }
    reply->deleteLater();//延时释放,防止堆区的接收数据泄漏
}
请求到的数据为JSON格式,需要用到QJson相关的头文件进行JSON解析,此处不详细介绍,主要思路是先构建出QJsonObject,依次解析日期和城市、未来5天数据、今日天气数据(根据回复的JSON结构体进行处理),将需要的信息显示在界面上,包括温湿度、风力等信息。
这里我们最好建立一个包含这些信息的类来存储上述信息。
class Info{
public:
    QString date;   // 日期
    QString city;   //城市
    QString ganmao; //感冒
    int wendu;  // 温度
    QString shidu;  // 湿度
    int pm25;   //   pm2.5
    QString quality;    //质量
    QString type;   // 天气类型
    QString fx; //风向
    QString fl; //风力
    int high;   //高温
    int low;    //低温
};
温度曲线绘制
这里我们重写父类的eventFilter方法。
protected:
    bool eventFilter(QObject* watched,QEvent *e);
    void paintHighCurve();//绘制高温曲线
    void paintLowCurve();//绘制低温曲线

// 重写父类的eventFilter方法
bool Weather::eventFilter(QObject *watched, QEvent *e)
{
    if(watched == ui->HighCurve&& e->type() == QEvent::Paint){
        paintHighCurve();
    }
    if(watched == ui->LowCurve&& e->type() == QEvent::Paint){
        paintLowCurve();
    }
    return QWidget::eventFilter(watched,e);
}
绘制主要使用QPainter类, 采用drawEllipse函数进行点的绘制, 采用drawLine函数进行线的绘制。
//绘制高温曲线
void Weather::paintHighCurve()
{
    QPainter painter(ui->HighCurve);// 画家类
    painter.setRenderHint(QPainter::Antialiasing,true);
    // 1. 获取x轴坐标
    int pointX[6]={0};
    for(int i=0;i<6;i++){
        pointX[i]=mWeekList[i]->pos().x()+(mWeekList[i]->width()/3);
    }
    // 2. 获取y轴坐标
    int tempSum=0;//总和
    int tempAverage=0;//平均
    for(int i=0;i<6;i++){
        tempSum+=mDay[i].high;
    }
    tempAverage=tempSum/6; // 最高温的平均值
    // 计算y轴坐标
    int pointY[6]={0};
    int yCenter = ui->lblHighCurve_4->height()/2;
    for(int i=0;i<6;i++){
        pointY[i]=yCenter - ((mDay[i].high-tempAverage)*INCREMENT);
    }
    // 3. 开始绘制
    QPen pen=painter.pen();
    pen.setWidth(1);
    pen.setColor(QColor(255,170,0)); //设置画笔的颜色
    painter.setPen(pen);//给画家设置画笔
    painter.setBrush(QColor(255,170,0));//设置画刷的颜色-内部填充的颜色
    // 3.2 画点、画文字
    for(int i=0;i<6;i++){
        // 显示点
        painter.drawEllipse(QPoint(pointX[i],pointY[i]),POINT_RADIUS,POINT_RADIUS);
        // 显示温度
        painter.drawText(pointX[i]-TEXT_OFFSET_X,pointY[i]-TEXT_OFFSET_X,
                         QString::number(mDay[i].high));
    }
    // 3.3绘制曲线
    for(int i=0;i<6-1;i++){
        if(i == 0){
            pen.setStyle(Qt::DotLine);//虚线
            painter.setPen(pen);
        }else{
            pen.setStyle(Qt::SolidLine);//虚线
            painter.setPen(pen);
        }
        painter.drawLine(pointX[i],pointY[i],pointX[i+1],pointY[i+1]);
    }
}


 778
778


 被折叠的 条评论
为什么被折叠?
被折叠的 条评论
为什么被折叠?
 到【灌水乐园】发言


