System monitoring is the primary responsibility of every System Administrator. I think every system admin must know few command line and few automatic system monitoring tools. In this article, I am providing 15 monitoring tools and i hope it will help you.
#1. Top ( A Linux Command )
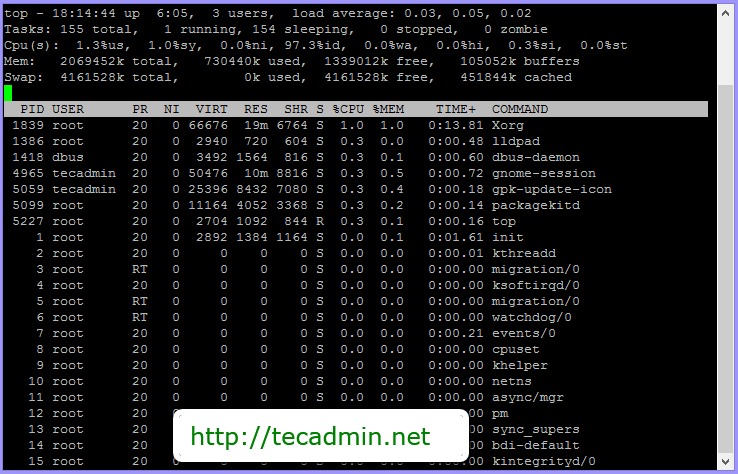
Top is the basic and frequently used command. It shows all real time statics of running process and monitor system performance. I had used it during my study time and I am still using it. This command comes with most Linux/Unix versions. Top provides Process PID, CPU and Memory usage, Swap Memory, cache size, Buffer Size etc.
# top
Read more – How to read Top command output
#2. ps
ps command provides the details of current running processes. ps also provides many options to get results more specific results
  # ps -e

  PID TTY          TIME CMD
    1 ?        00:00:01 init
    2 ?        00:00:00 kthreadd
    3 ?        00:00:00 migration/0
    4 ?        00:00:00 ksoftirqd/0
    5 ?        00:00:00 migration/0
    6 ?        00:00:00 watchdog/0
    7 ?        00:00:00 events/0
    8 ?        00:00:00 cpuset
    9 ?        00:00:00 khelper
   10 ?        00:00:00 netns
   11 ?        00:00:00 async/mgr
   12 ?        00:00:00 pm
   13 ?        00:00:00 sync_supers
   ...
To List all Processes on Server
# ps aux
To List all Processes of Specific User
# ps -u <user_name>
#3. netstat (network statistics)
netstat is very useful tool for printing network connections, routing tables, interface statistics, masquerade connections, and multicast memberships.
For example following command will provide list of all listening TCP and UDP ports with there services name.
# netstat -tulnp

Active Internet connections (only servers)
Proto Recv-Q Send-Q Local Address     Foreign Address     State       PID/Program name
tcp        0      0 0.0.0.0:111       0.0.0.0:*           LISTEN      1371/rpcbind
tcp        0      0 0.0.0.0:39698     0.0.0.0:*           LISTEN      1458/rpc.statd
tcp        0      0 0.0.0.0:22        0.0.0.0:*           LISTEN      1683/sshd
tcp        0      0 127.0.0.1:631     0.0.0.0:*           LISTEN      1556/cupsd
tcp        0      0 127.0.0.1:25      0.0.0.0:*           LISTEN      1771/master
tcp        0      0 :::80             :::*                LISTEN      2247/httpd
tcp        0      0 :::22             :::*                LISTEN      1683/sshd
udp        0      0 0.0.0.0:47307     0.0.0.0:*                       1440/avahi-daemon
udp        0      0 0.0.0.0:111       0.0.0.0:*                       1371/rpcbind
udp        0      0 0.0.0.0:631       0.0.0.0:*                       1556/cupsd
udp        0      0 0.0.0.0:41242     0.0.0.0:*                       1458/rpc.statd
udp        0      0 0.0.0.0:698       0.0.0.0:*                       1371/rpcbind
udp        0      0 :::111            :::*                            1371/rpcbind
#4. Nagios
Nagios open source and powerful monitoring system that enables organizations to identify and resolve IT infrastructure problems before they affect critical business processes.
Using Nagios we can easily monitor host systems, local or remote services, network peripherals etc. It also provides a high level notification system via email, sms etc.
Read the Tutorial: Install Nagios and NagiosQL on CentOS, RHEL System
#5 vnStat
vnStat is a console-based network traffic monitor for Linux based system.It counts bandwidth ( transmit and received ) on network interface and stored in own database. vnStat also provides a PHP based web interface to show network statics in well formed graphs.
- Show Statistics for a day
# vnstat -d

 eth0  /  daily

         day         rx      |     tx      |    total    |   avg. rate
     ------------------------+-------------+-------------+---------------
      05/07/13    213.12 MiB |  837.71 MiB |    1.03 GiB |  120.06 kbit/s
     ------------------------+-------------+-------------+---------------
     estimated       256 MiB |    0.98 GiB |    1.23 GiB |
- Show Statistics for a Month
# vnstat -m
- Show Statistics for a Hour
# vnstat -h
- Show Statistics in Real Time
# vnstat -l
Read More: Install vnStat and vnStat PHP on CentOS, RHEL Linux
#6 vmstat
vmstat command displays information about Processes, Memory, Paging, Block IO, Traps, and CPU Activity.
# vmstat

procs -----------memory---------- ---swap-- -----io---- --system-- -----cpu-----
 r  b   swpd   free   buff  cache   si   so    bi    bo   in   cs us sy id wa st
 0  0      0 1392620 108972 436948    0    0    15     4   17   20  0  0 99  0  0
You can also specify to show vmstat output on regular interval. Following example will show output on each 5 seconds.
# vmstat 1

procs -----------memory---------- ---swap-- -----io---- --system-- -----cpu-----
 r  b   swpd   free   buff  cache   si   so    bi    bo   in   cs us sy id wa st
 0  0      0 1392612 108980 436948    0    0    15     4   17   20  0  0 99  0  0
 0  0      0 1392604 108988 436944    0    0     0    12   22   24  0  0 100  0  0
 0  0      0 1392604 108988 436948    0    0     0     0   12   15  0  0 100  0  0
 0  0      0 1392604 108988 436948    0    0     0     0   18   24  0  0 100  0  0
<
h4 class=”heading1″>#7 Munin
<
h4>
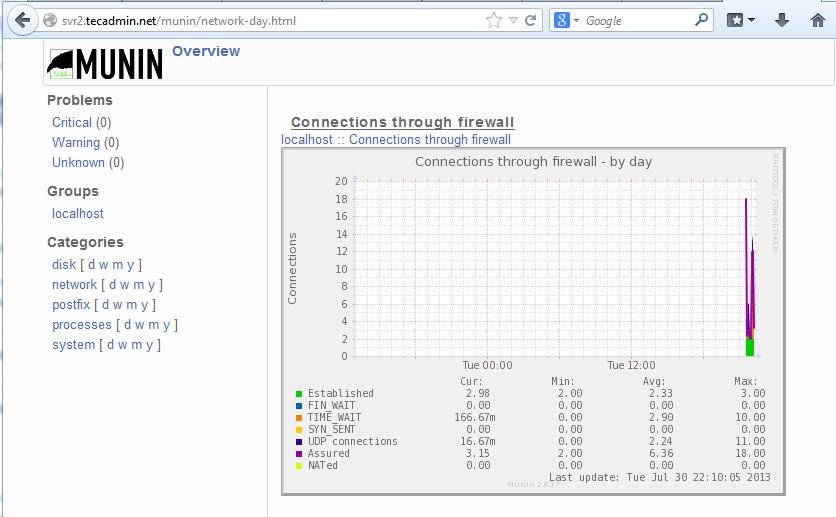
Munin is a networked resource monitoring tool that can help analyze resource trends. Munin the monitoring tool surveys all your computers and remembers what it saw. It presents all the information in graphs through a web interface.
Read More: Installing Munin Network Monitoring in CentOS RHEL and Fedora
#8. Iostat
The iostat command is used for monitoring system input/output device loading by observing the time the devices are active in relation to their average transfer rates.
Check below output of simple iostat command, Its showing cpu details and attached disk statistics.
# iostat

Linux 2.6.32-220.el6.i686 (tecadmin.net)        10/07/2013      _i686_  (1 CPU)

avg-cpu:  %user   %nice %system %iowait  %steal   %idle
           0.07    0.00    0.29    0.17    0.00   99.47

Device:            tps   Blk_read/s   Blk_wrtn/s   Blk_read   Blk_wrtn
scd0              0.00         0.01         0.00        392          0
sda               0.79        28.94         8.12    1178216     330444
dm-0              1.97        28.71         8.12    1168554     330376
dm-1              0.01         0.06         0.00       2576          0
Check statics of specific disk in system.
# iostat -d /dev/sda -m
Linux 2.6.32-220.el6.i686 (tecadmin.net)        10/07/2013      _i686_  (1 CPU)

Device:            tps    MB_read/s    MB_wrtn/s    MB_read    MB_wrtn
sda               0.78         0.01         0.00        575        161
-m : is used for show results in megabytes per second.
#9. Cacti
Cacti is an open-source, web-based network monitoring and graphing tool designed to harness the power of RRDTool’s data storage and graphing functionality.
Cacti also provides a “data input” mechanism which allows users to define custom scripts that can be used to gather data.
Read More: Install Cacti ( Network Graphing Tool ) on CentOS and RHEL System
#10. Htop
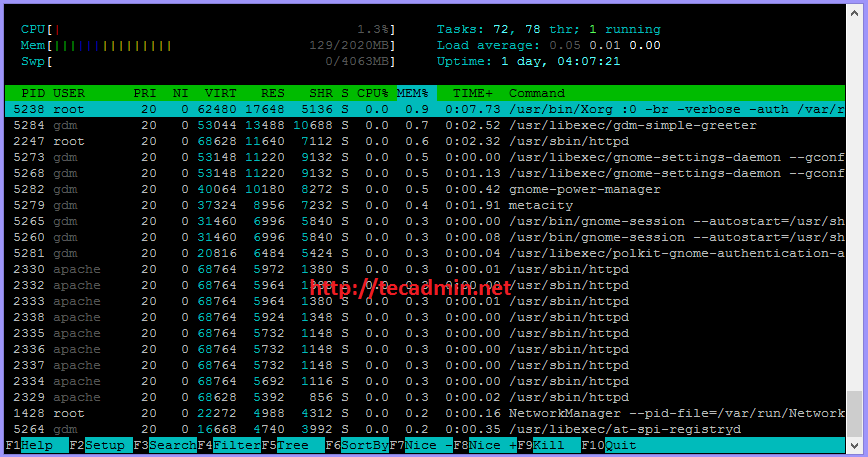
Htop is an alternative of top command but it provides interactive system-monitor process-viewer and more user friendly output than top.
htop also provides a better way to navigate to any process using keyboard Up/Down keys as well as we can also operate it using mouse. To use simply type htop command on terminal
# htop
#11. iotop
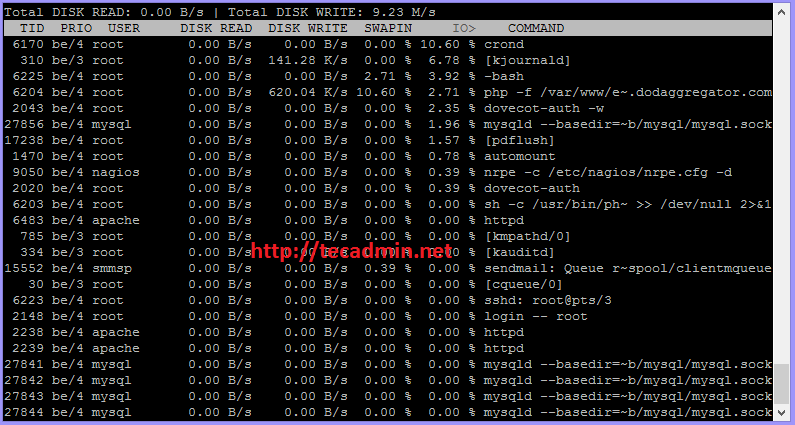
iotop is useful command to find out which processes are increasing load on hard disks. iotop is a Python program with a top like UI used to show of behalf of which process is the I/O going on. It requires Python ≥ 2.7 and a Linux kernel ≥ 2.6.20.
# iotop
<
h4 class=”heading1″>#12. uptime
uptime command tells how long the system has been running along with some additional information
# uptime

21:15:44 up 1 day,  6:56,  4 users,  load average: 0.17, 0.43, 0.48
Additionally it shows how many users are currently logged on, and the system load averages for the past 1, 5, and 15 minutes.
#13. Strace
strace is an useful command for system administrators for solving problems with programs mainly with binary files ( for which the source is not available ).
For example we use ‘ls’ command to list files and directories but we can not edit source code of this command. In case this command not worked properly we have no option to modify its code but we can trace the but we can system calls and signals generated by this command.
# strace ls
execve("/bin/ls", ["ls"], [/* 26 vars */]) = 0
brk(0)                                  = 0x9558000
mmap2(NULL, 4096, PROT_READ|PROT_WRITE, MAP_PRIVATE|MAP_ANONYMOUS, -1, 0) = 0xb7871000
access("/etc/ld.so.preload", R_OK)      = -1 ENOENT (No such file or directory)
open("/etc/ld.so.cache", O_RDONLY)      = 3
fstat64(3, {st_mode=S_IFREG|0644, st_size=57422, ...}) = 0
mmap2(NULL, 57422, PROT_READ, MAP_PRIVATE, 3, 0) = 0xb7862000
close(3)                                = 0
...
...
To view only read system calls use -e option
# strace -e read ls
read(3, "\177ELF\1\1\1\0\0\0\0\0\3\0\3\0\1\0\0\0\220\303A\0004\0\0\0"..., 512) = 512
read(3, "\177ELF\1\1\1\0\0\0\0\0\3\0\3\0\1\0\0\0\200\3300\0004\0\0\0"..., 512) = 512
read(3, "\177ELF\1\1\1\0\0\0\0\0\3\0\3\0\1\0\0\0\340lp\0004\0\0\0"..., 512) = 512
read(3, "\177ELF\1\1\1\0\0\0\0\0\3\0\3\0\1\0\0\0p\366\320\0064\0\0\0"..., 512) = 512
read(3, "\177ELF\1\1\1\3\0\0\0\0\3\0\3\0\1\0\0\0@\236\23\0004\0\0\0"..., 512) = 512
read(3, "\177ELF\1\1\1\0\0\0\0\0\3\0\3\0\1\0\0\0`\312+\0004\0\0\0"..., 512) = 512
read(3, "\177ELF\1\1\1\0\0\0\0\0\3\0\3\0\1\0\0\0\260|,\0004\0\0\0"..., 512) = 512
read(3, "\177ELF\1\1\1\0\0\0\0\0\3\0\3\0\1\0\0\0Pn\337\0004\0\0\0"..., 512) = 512
read(3, "nodev\tsysfs\nnodev\trootfs\nnodev\tb"..., 1024) = 368
read(3, "", 1024)
<
h4 class=”heading1″>#14. sar
sar command is useful for collect, report, or save system activity information.
Default sar command shows activity of CPU like below.
# sar

Linux 2.6.32-220.el6.i686 (tecadmin.net)        10/08/2013      _i686_  (1 CPU)

12:00:01 AM     CPU     %user     %nice   %system   %iowait    %steal     %idle
12:10:01 AM     all      0.01      0.00      0.09      0.01      0.00     99.89
12:20:01 AM     all      0.02      0.00      0.08      0.02      0.00     99.88
Average:        all      0.01      0.00      0.09      0.01      0.00     99.89
To view activity of Ethernet cards use following command.
# sar -n DEV

Linux 2.6.32-220.el6.i686 (tecadmin.net)        10/08/2013      _i686_  (1 CPU)

12:00:01 AM     IFACE   rxpck/s   txpck/s    rxkB/s    txkB/s   rxcmp/s   txcmp/s  rxmcst/s
12:10:01 AM        lo      0.00      0.00      0.00      0.00      0.00      0.00      0.00
12:10:01 AM      eth0      1.76      0.00      0.18      0.00      0.00      0.00      0.00
12:20:01 AM        lo      0.00      0.00      0.00      0.00      0.00      0.00      0.00
12:20:01 AM      eth0      1.83      0.02      0.19      0.00      0.00      0.00      0.00
Average:           lo      0.00      0.00      0.00      0.00      0.00      0.00      0.00
Average:         eth0      1.79      0.01      0.19      0.00      0.00      0.00      0.00
#15. zabbix
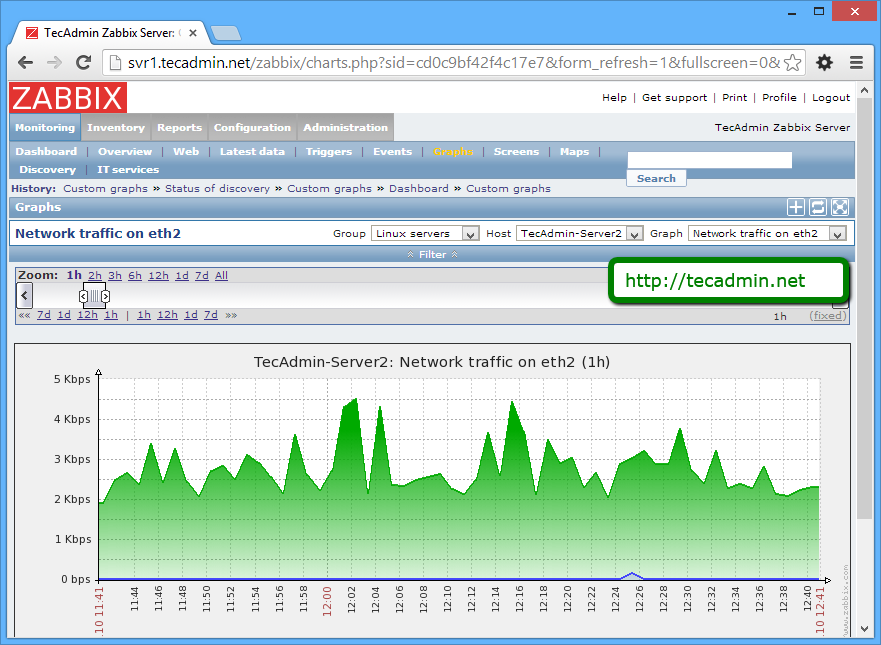
Zabbix is an Open Source software for Performance monitoring for your network. It provides agents for all platforms. Zabbix has great capability of collection of data, creating graphs and network maps.
Zabbix provides many other important features useful for monitoring. Read more about zabbix feature.
Reference: http://tecadmin.net/linux-system-and-performance-monitoring-tools/




 999
999

 被折叠的 条评论
为什么被折叠?


