


1.clf
clf deletes from the current figure all graphics objects whose handles are not hidden (i.e., their HandleVisibility property is set to on).
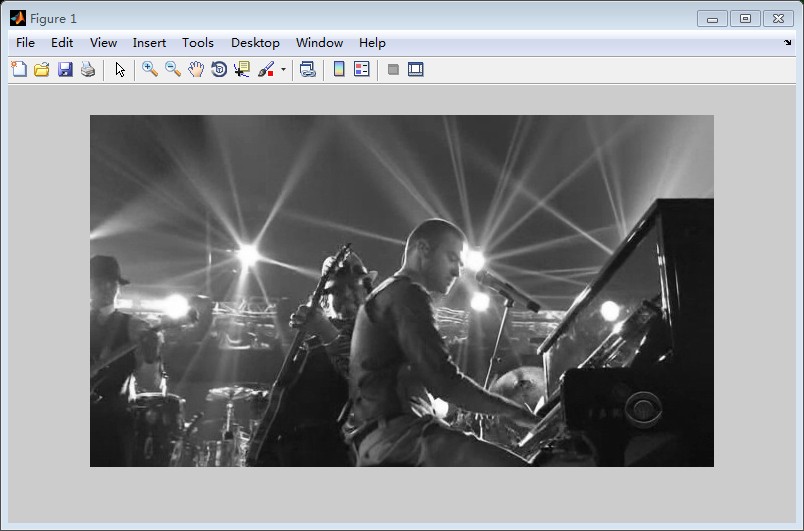
就是删除当前figure的图像。下面给个例子:
原始图像:
经过clf;命令之后的图像:
2.colormap
通过doc colormap;命令可以看到详细的解释。在Matlab中每个figure有且仅有一个colormap, 翻译过来即是颜色映射。A colormap is an 64-by-3 matrix of real numbers between 0.0 and 1.0. Each row is an RGB vector that defines one color. The kth row of the colormap defines the kth color, where map(k,:) = [r(k) g(k) b(k)]) specifies the intensity of red, green, and blue. 在Matlab命令窗口直接输入colormap回车就可看到一个64*3的数组。
Matlab中支持的colormap类型有:
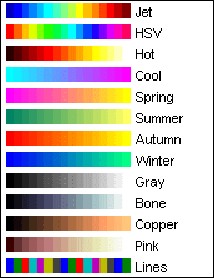
默认为'jet',一般使用'gray'。命令格式:
colormap('gray');
colormap gray;
colormap(gray);
网上有篇关于colormap的博文写得不错,可以参考一下:http://blog.sina.com.cn/s/blog_618af1950100eyp4.html
3.axes
The basic purpose of an axes object is to provide a coordinate system for plotted data, axes properties provide considerable control over the way MATLAB displays data. The current axes is the target for functions that draw image, line, patch, rectangle, surface, and text graphics objects.
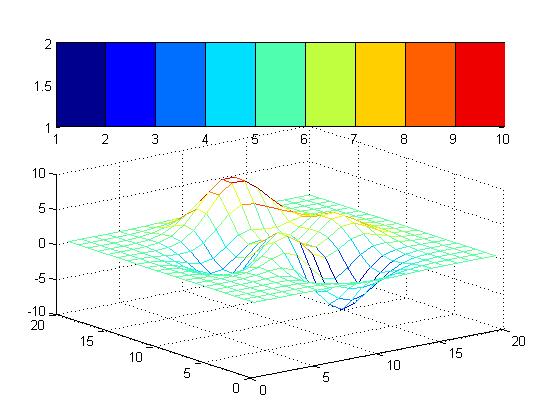
用于figure中,指定作图区域。常用的axes的属性为'position',命令格式为:
axes('position',[left bottom width height]);%注意这里的left,bottom,width,height取值范围为[0,1]
例:
axes('position',[.1 .1 .8 .6])
mesh(peaks(20));
axes('position',[.1 .7 .8 .2])
pcolor([1:10;1:10]);
4.imagesc
The imagesc function scales image data to the full range of the current colormap and displays the image. 所以imagesc一般配合colormap和axes一起使用。
imagesc(C,clims) normalizes the values in C to the range specified by clims and displays C as an image. clims is a two-element vector that limits the range of data values in C. These values map to the full range of values in the current colormap.
实际在使用imagesc函数时,一定要先声明colormap,因为imagesc是在colormap中展开的。如果不声明, 由于colormap默认值是'jet',所以得到的图像颜色很奇怪。imagesc(C)可以直接在colormap上显示图像C,由于支持映射,C可以是[0,1]之间的double数组(比如有的灰度图/256之后将像素值范围压缩到了[0,1]),这时应采用imagesc(C,[0,1]). 当然如果要在指定区域内显示图像,可以加上命令axes。
经典流程:
clf;
colormap gray;
axes('position',[a,b,c,d]);
imagesc(frame,[x,y]);
下面补充两个经常配合这些作图函数使用的命令:
1.axis equal tight off;
在使用axes命令时会显示坐标系刻度,如果想去掉的话可以在画完图之后使用该语句。
2.set函数
set('MenuBar','none');%去掉当前figure窗口的菜单栏。当然set函数的功能非常强大,可以参考doc set。


 1445
1445

 被折叠的 条评论
为什么被折叠?
被折叠的 条评论
为什么被折叠?
 到【灌水乐园】发言


