


面积图(Area Chart)又称区域图,面积图强调数据随基线数据而变化的程度,也可用于引起人们对总值趋势的注意。例如,表示随时间而变化的利润的数据可以绘制在面积图中以强调总利润。在QChart中使用QAreaSeries来实现面积图的绘制。
QAreaSeries
QAreaSeries类实现用面积图的方式显示数据。面积图用于显示定量数据。它根据高低两条边界线来确定面积区域。两条边界线之间的区域将被填充。
QAreaSeries常用函数:
- setBorderColor(self, color):设置边界线条颜色为color。
- setBrush(self, brush):设置填充所用的画刷为brush。
- setColor(self, color):设置用于填充(画刷)的颜色color。
- setPen(self, pen): 设置用于绘制区域轮廓的画笔为pen。
- setPointLabelsClipping(self, enabled): 设置数据点标签的剪裁方式。默认为True。启用裁剪后,将剪切掉绘图区域边缘上的标签。
- setPointLabelsColor(self, color):设置数据点标签的颜色为color,默认情况下,颜色是为主题中的标签定义的画笔的颜色。
- setPointLabelsFont(self, font):设置用于数据点标签的字体为font。
- setPointLabelsFormat(self, format):设置用于显示带有序列点的标签的格式为format。 QAreaSeries支持以下的标签格式为'@xPont'( 数据点的x值)和'@yPont'( 数据点的y值) 。如:
series. setPointLabelsFormat('(@xPoint, @yPoint)')- setPointLabelsVisible(self, visible):设置数据点标签是否可见。
- setPointsVisible(self, visible):设置数据点是否visible, 并确定是否在线上绘制这些点。
- setLowerSeries(self, series):设置下边界线。
- setUpperSeries(self, series):设置上边界线。
QAreaSeries常用信号:
- borderColorChanged(self, color):当线条(画笔)颜色变为color时,发出此信号。
- clicked(self, point):当用户在面积图中单击以触发按下点时,将发出此信号。
- colorChanged(self, color):当填充(画刷)颜色变为color时,发出此信号。
- doubleClicked(self, point):当用户通过双击point触发面积图中的第一次按下时,将发出此信号。
- hovered(self, point, state):当用户将鼠标指针悬停在系列上或将其从系列中移开时,将发出此信号。point显示悬停事件的原点(坐标)。当光标悬停在面积图上时state为True。否则state为False。
- pointLabelsClippingChanged(self, clipping):当数据点标签的剪裁设置clipping发生改变时,将发出此信号。
- pointLabelsColorChanged(self, color):当数据点标签的颜色改变为color时,将发出此信号。
- pointLabelsFontChanged(self, font):当数据点标签的字体改变为font时,将发出此信号。
- pointLabelsFormatChanged(self, format):当数据点标签的格式改变为format时,将发出此信号。
- pointLabelsVisibilityChanged(self, visible):当数据点标签的可见属性改变为visible时,将发出此信号。
- pressed(self, point):当用户按下面积图中由point指定的点时,将发出此信号。
- released(self, point):当用户释放在面积图中某个point上释放按下状态时,将发出此信号。
面积图示例
示例代码显示了如何创建简单的面积图,并使用渐变方式填充整个区域。完整代码如下:
import sys
from PyQt5.QtCore import Qt, QPointF
from PyQt5.QtGui import QPainter, QPen, QLinearGradient, QColor
from PyQt5.QtWidgets import QApplication, QMainWindow
from  PyQt5.QtChart import QChartView, QChart, QLineSeries, QAreaSeries

class DemoChartArea(QMainWindow):
    def __init__(self, parent=None):
        super(DemoChartArea, self).__init__(parent)

         # 设置窗口标题
        self.setWindowTitle('实战 Qt for Python: QChart面积图演示')
        # 设置窗口大小
        self.resize(480, 360)

        self.createChart()

    def createChart(self):

        #面积图的上下两条曲线
        #注意line0和line1的生存周期!!!!!
        self.line0 = QLineSeries()
        self.line1 = QLineSeries()

        self.line0 << QPointF(1, 5) << QPointF(3, 7) << QPointF(7, 6) << QPointF(9, 7) << QPointF(12, 6) << QPointF(16, 7) << QPointF(18, 5)
        self.line1 << QPointF(1, 3) << QPointF(3, 4) << QPointF(7, 3) << QPointF(8, 2) << QPointF(12, 3) << QPointF(16, 4) << QPointF(18, 3)

        #面积图
        areaSeries = QAreaSeries(self.line0, self.line1)
        areaSeries.setName('蝙蝠侠') #Batman

        pen = QPen(QColor(0x059605))
        pen.setWidth(3)
        areaSeries.setPen(pen)

        #渐变设置
        gradient = QLinearGradient(QPointF(0,0), QPointF(0, 1))
        gradient.setColorAt(0.0, QColor(0x3cc63c))
        gradient.setColorAt(1.0, QColor(0x26f626))
        gradient.setCoordinateMode(QLinearGradient.ObjectBoundingMode)
        areaSeries.setBrush(gradient)

        #创建图表
        chart = QChart()
        chart.addSeries(areaSeries)
        chart.setTitle('简单面积图示例')
        chart.createDefaultAxes()
        chart.axes(Qt.Horizontal)[0].setRange(0, 20) #横坐标数值范围
        chart.axes(Qt.Vertical)[0].setRange(0, 10) #纵坐标数值范围

        #图表视图
        chartView = QChartView(chart)
        chartView.setRenderHint(QPainter.Antialiasing)

        self.setCentralWidget(chartView)


if __name__ == '__main__':
    app = QApplication(sys.argv)
    window = DemoChartArea()
    window.show()
    sys.exit(app.exec())
运行结果如下图:
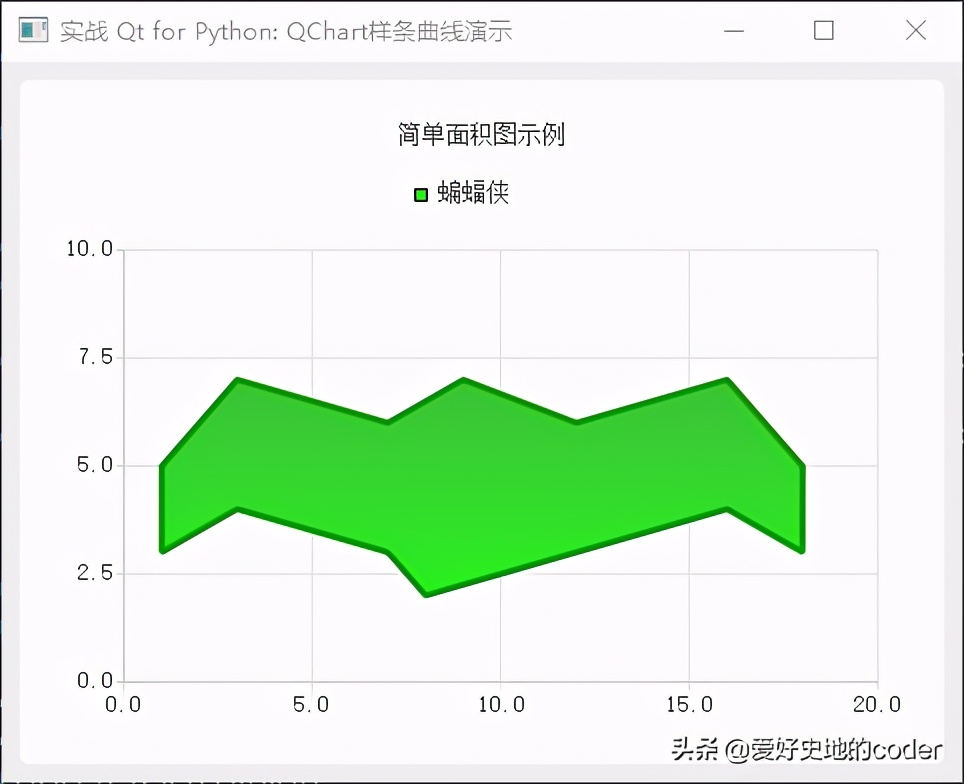
QChart面积图演示
本文知识点
- 面积图强调数据随基线数据而变化的程度。
- 使用QAreaSeries绘制面积图。
- 面积图并不拥有它的上下基线的控制权,因此要上下基线对象的生存周期。


 被折叠的 条评论
为什么被折叠?
被折叠的 条评论
为什么被折叠?
 到【灌水乐园】发言


