


在真机上运行程序,debuger navigator除了CPU、FTP之外,其他的都没有显示
于是我只能另辟蹊径,自己把内存打出来看下,iOS 获取 当前设备可用内存 及 当前应用所占内存,然并卵,因为打印出来的内存好像不是程序运行所占内存,只能通过数值判断趋势。
我也尝试着在模拟器上运行程序,但是发现内存还是没有显示,当然其他的可以显示啦。不清楚具体原因是什么,而且就只发生在我这个工程上面,十分换衣是否是因为BaiduMap SDK干扰了。如果有知道的童鞋,真机调试,在运行了一段时间之后,会出现
Lost connection to iPad
Restore the connection to “iPad 2” and run “APPNAME” again, or if “APPNAME” is still running, you can attach to it by selecting Debug > Attach to Process > APPNAME.在stackoverflow上找到了Lost connection to “iPad 2”,具体原因呢,里面是这么说的:
This happens when you have 2 projects open in XCode you want to debug at same time.
什么鬼,难道是因为我工程里面有cocoaPod得缘故?这点有点弄不明白,有待继续追踪。于是我就照着里面的方法启动APP。
To avoid the problem:
Launch the main process straight from the device
Go to the dependency project and select Debug -> attach to process -> process launched at 1.然而,我的attach to process子菜单是灰色空白的!于是赶紧查了一下attach to process是个什么鬼。Attach debugger to IOS app after launch里面说,应该这么来处理
With your device connected to your Mac, select Product -> Attach to Process -> By Process Identifier (PID) or Name… in Xcode. In the dialog sheet, enter the name of your app as it appears in the Debug navigator when started via Xcode.
也就是如下两步
第一步,先select Product -> Attach to Process -> By Process Identifier (PID) or Name,输入你的程序名称
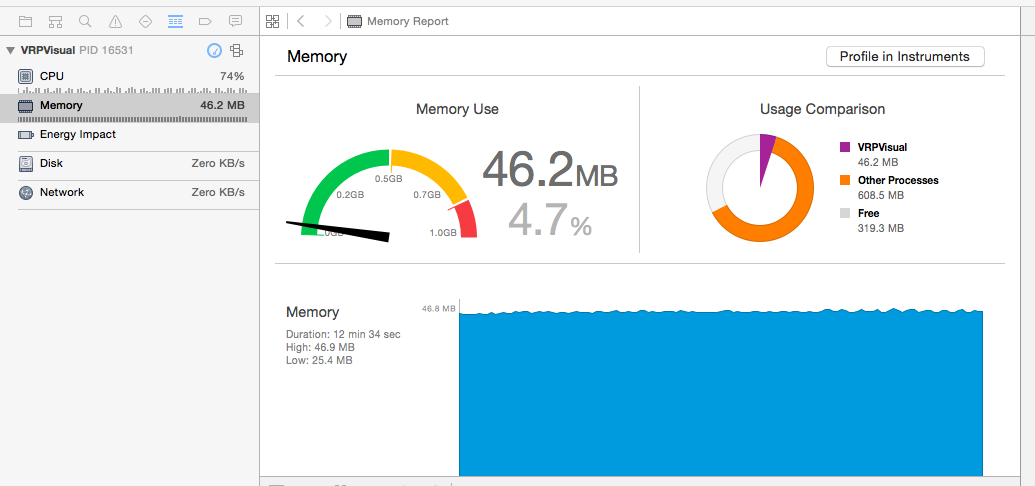
第二步,在真机上点击运行你的app就是这么简单,然而我会说其实是我自己摸索出来的么?作者表意不明呀。但最最重要的是,程序又开始自动运行了,而且我的debuger navigator终于正常显示了!
百度地图开发中遇到的坑
最新推荐文章于 2021-03-22 13:24:38 发布


 2095
2095

 被折叠的 条评论
为什么被折叠?
被折叠的 条评论
为什么被折叠?
 到【灌水乐园】发言


