


 这篇博客详细介绍了`numpy.histogram`函数的使用,包括参数`bins`和`range`的作用。`bins`可以指定直方图的间隔数或范围,不保证等宽,并且当为范围时,不包括最大值。`range`参数定义了统计数据的有效区间,排除超出范围的数据。示例代码展示了如何根据给定参数绘制直方图。
直接上代码:
numpy.histogram(a, bins=10, range=None, normed=None, weights=None, density=None)
a:数组
bins;如果是整型的值,比如bins=9,那就在横轴有9个等宽的间距;如果是一个范围,比如(0,9),那将就只有8个间距,但是并不保证是等宽的,就是不一定是等宽的,看数据,而且不包括最大值5,就是范围取值为:[0,5),左闭右开。
range:表示统计的最小值和最大值,超出的就不统计,是 [min, max],左闭和右闭, 若:range为元组(tuple)或None。剔除较大和较小的离群值,给出全局范围。如果为None,则默认为(x.min(), x.max())。如果bins取值为序列,则range无效,python会基于bins的取值画图。
import numpy as np
import matplotlib.pyplot as plt
cal = np.histogram([1,2,3,4,5,6,7,8,8,3,4,5,6,9],bins=np.arange(0,9),range=(0,8))
# 中bins表示的是范围,即直方图横坐标最大值,(0,9)表示只统计[0-8]不包括0,range表示统计数据中最小值和最大值
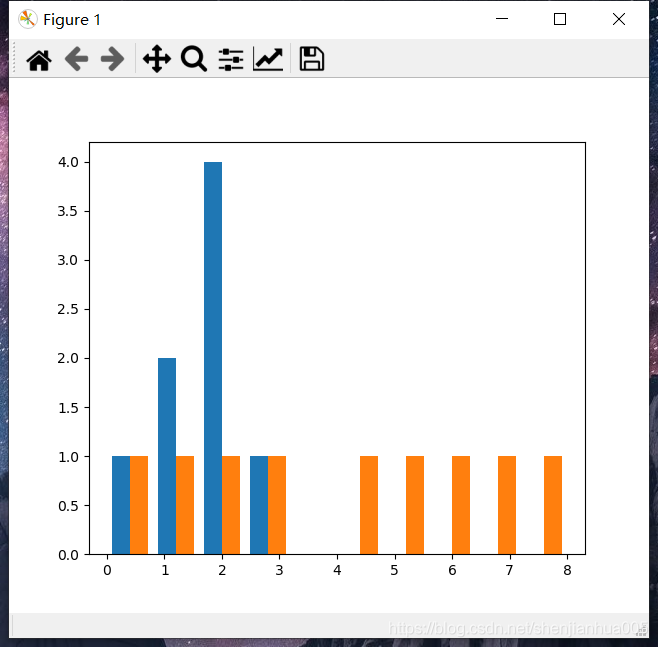
plt.hist(cal)
plt.show()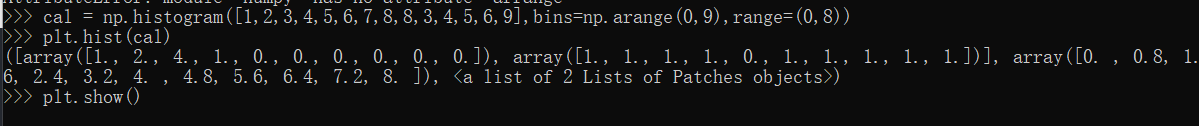
cal = np.histogram([1,2,3,4,5,6,7,8,8,3,4,5,6,10,10,10],bins=np.arange(0,9),range=(0,15))
plt.hist(cal)
plt.show()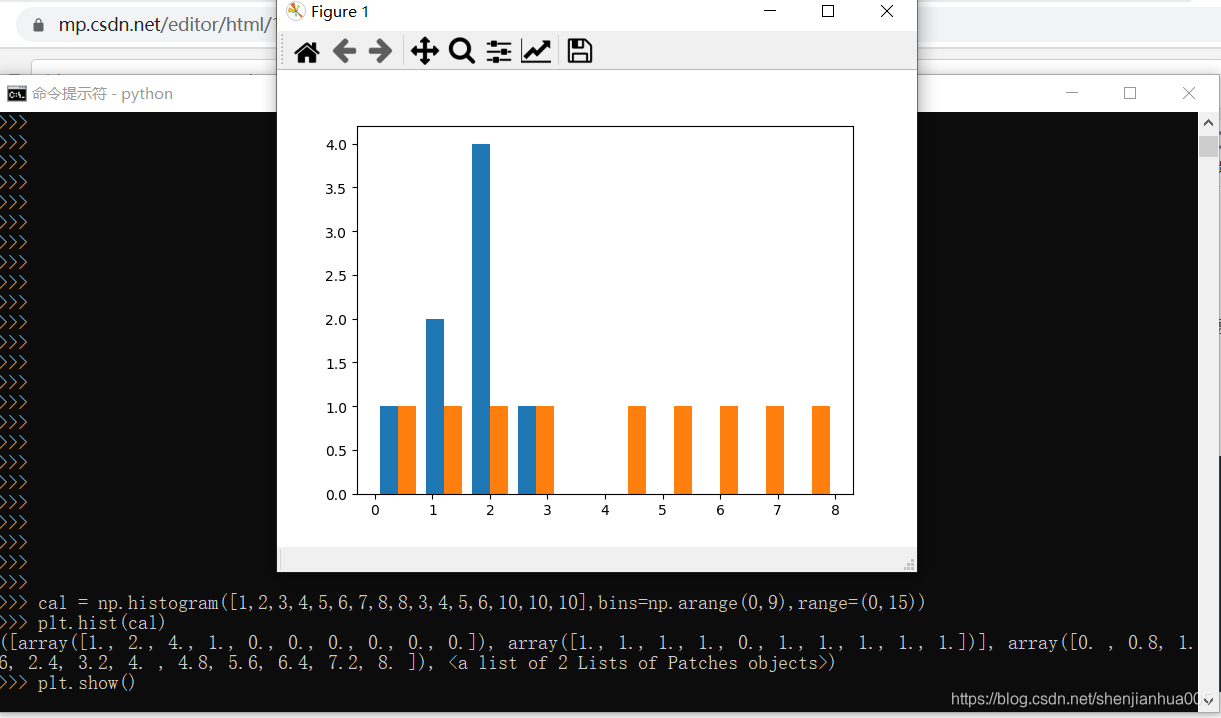
https://numpy.org/doc/stable/reference/generated/numpy.histogram.html


 1059
1059

 被折叠的 条评论
为什么被折叠?
被折叠的 条评论
为什么被折叠?
 到【灌水乐园】发言


