


说明
本文主要介绍使用命令和工具来查看对内存的使用情况,进而分析程序的运行情况
code
public class JmapTest {
    public static void main(String[] args) throws Exception {
        System.out.println("1......");
        Thread.sleep(30000);
        byte[] arr = new byte[1024 * 1024 * 10];//10Mb
        System.out.println("2......");
        Thread.sleep(30000);
        arr = null;
        System.gc();
        System.out.println("3......");
        Thread.sleep(300000);

    }
}
jps 查看当前的java进程
java0904@weigongdeMacBook-Pro ~ % jps
62038 JmapTest
62040 Jps
61823
jmap
我的这里是mac,直接使用jmap报错,所以需要使用sudo jhsdb jmap --heap --pid 62038,正常使用jmap -heap pid即可
以下是程序输出1时执行
java0904@weigongdeMacBook-Pro ~ % sudo jhsdb jmap --heap --pid 62038
Password:
Attaching to process ID 62038, please wait...
Debugger attached successfully.
Server compiler detected.
JVM version is 11.0.12+0

using thread-local object allocation.
Garbage-First (G1) GC with 8 thread(s)

Heap Configuration:
   MinHeapFreeRatio         = 40
   MaxHeapFreeRatio         = 70
   MaxHeapSize              = 4294967296 (4096.0MB)
   NewSize                  = 1363144 (1.2999954223632812MB)
   MaxNewSize               = 2576351232 (2457.0MB)
   OldSize                  = 5452592 (5.1999969482421875MB)
   NewRatio                 = 2
   SurvivorRatio            = 8
   MetaspaceSize            = 21807104 (20.796875MB)
   CompressedClassSpaceSize = 1073741824 (1024.0MB)
   MaxMetaspaceSize         = 17592186044415 MB
   G1HeapRegionSize         = 1048576 (1.0MB)

Heap Usage:
G1 Heap:
   regions  = 4096
   capacity = 4294967296 (4096.0MB)
   used     = 3145728 (3.0MB)
   free     = 4291821568 (4093.0MB)
   0.0732421875% used
G1 Young Generation:
Eden Space:
   regions  = 3
   capacity = 27262976 (26.0MB)
   used     = 3145728 (3.0MB)
   free     = 24117248 (23.0MB)
   11.538461538461538% used
Survivor Space:
   regions  = 0
   capacity = 0 (0.0MB)
   used     = 0 (0.0MB)
   free     = 0 (0.0MB)
   0.0% used
G1 Old Generation:
   regions  = 0
   capacity = 241172480 (230.0MB)
   used     = 0 (0.0MB)
   free     = 241172480 (230.0MB)
   0.0% used
以下是程序输出2时执行
java0904@weigongdeMacBook-Pro ~ % sudo jhsdb jmap --heap --pid 62038
Attaching to process ID 62038, please wait...
Debugger attached successfully.
Server compiler detected.
JVM version is 11.0.12+0

using thread-local object allocation.
Garbage-First (G1) GC with 8 thread(s)

Heap Configuration:
   MinHeapFreeRatio         = 40
   MaxHeapFreeRatio         = 70
   MaxHeapSize              = 4294967296 (4096.0MB)
   NewSize                  = 1363144 (1.2999954223632812MB)
   MaxNewSize               = 2576351232 (2457.0MB)
   OldSize                  = 5452592 (5.1999969482421875MB)
   NewRatio                 = 2
   SurvivorRatio            = 8
   MetaspaceSize            = 21807104 (20.796875MB)
   CompressedClassSpaceSize = 1073741824 (1024.0MB)
   MaxMetaspaceSize         = 17592186044415 MB
   G1HeapRegionSize         = 1048576 (1.0MB)

Heap Usage:
G1 Heap:
   regions  = 4096
   capacity = 4294967296 (4096.0MB)
   used     = 14680064 (14.0MB)
   free     = 4280287232 (4082.0MB)
   0.341796875% used
G1 Young Generation:
Eden Space:
   regions  = 4
   capacity = 27262976 (26.0MB)
   used     = 4194304 (4.0MB)
   free     = 23068672 (22.0MB)
   15.384615384615385% used
Survivor Space:
   regions  = 0
   capacity = 0 (0.0MB)
   used     = 0 (0.0MB)
   free     = 0 (0.0MB)
   0.0% used
G1 Old Generation:
   regions  = 11
   capacity = 241172480 (230.0MB)
   used     = 10485760 (10.0MB)
   free     = 230686720 (220.0MB)
   4.3478260869565215% used
以下是程序输出3时执行
java0904@weigongdeMacBook-Pro ~ % sudo jhsdb jmap --heap --pid 62038
Attaching to process ID 62038, please wait...
Debugger attached successfully.
Server compiler detected.
JVM version is 11.0.12+0

using thread-local object allocation.
Garbage-First (G1) GC with 8 thread(s)

Heap Configuration:
   MinHeapFreeRatio         = 40
   MaxHeapFreeRatio         = 70
   MaxHeapSize              = 4294967296 (4096.0MB)
   NewSize                  = 1363144 (1.2999954223632812MB)
   MaxNewSize               = 2576351232 (2457.0MB)
   OldSize                  = 5452592 (5.1999969482421875MB)
   NewRatio                 = 2
   SurvivorRatio            = 8
   MetaspaceSize            = 21807104 (20.796875MB)
   CompressedClassSpaceSize = 1073741824 (1024.0MB)
   MaxMetaspaceSize         = 17592186044415 MB
   G1HeapRegionSize         = 1048576 (1.0MB)

Heap Usage:
G1 Heap:
   regions  = 4096
   capacity = 4294967296 (4096.0MB)
   used     = 1256176 (1.1979827880859375MB)
   free     = 4293711120 (4094.802017211914MB)
   0.029247626662254333% used
G1 Young Generation:
Eden Space:
   regions  = 0
   capacity = 5242880 (5.0MB)
   used     = 0 (0.0MB)
   free     = 5242880 (5.0MB)
   0.0% used
Survivor Space:
   regions  = 0
   capacity = 0 (0.0MB)
   used     = 0 (0.0MB)
   free     = 0 (0.0MB)
   0.0% used
G1 Old Generation:
   regions  = 4
   capacity = 9437184 (9.0MB)
   used     = 1256176 (1.1979827880859375MB)
   free     = 8181008 (7.8020172119140625MB)
   13.310919867621529% used

java0904@weigongdeMacBook-Pro ~ %
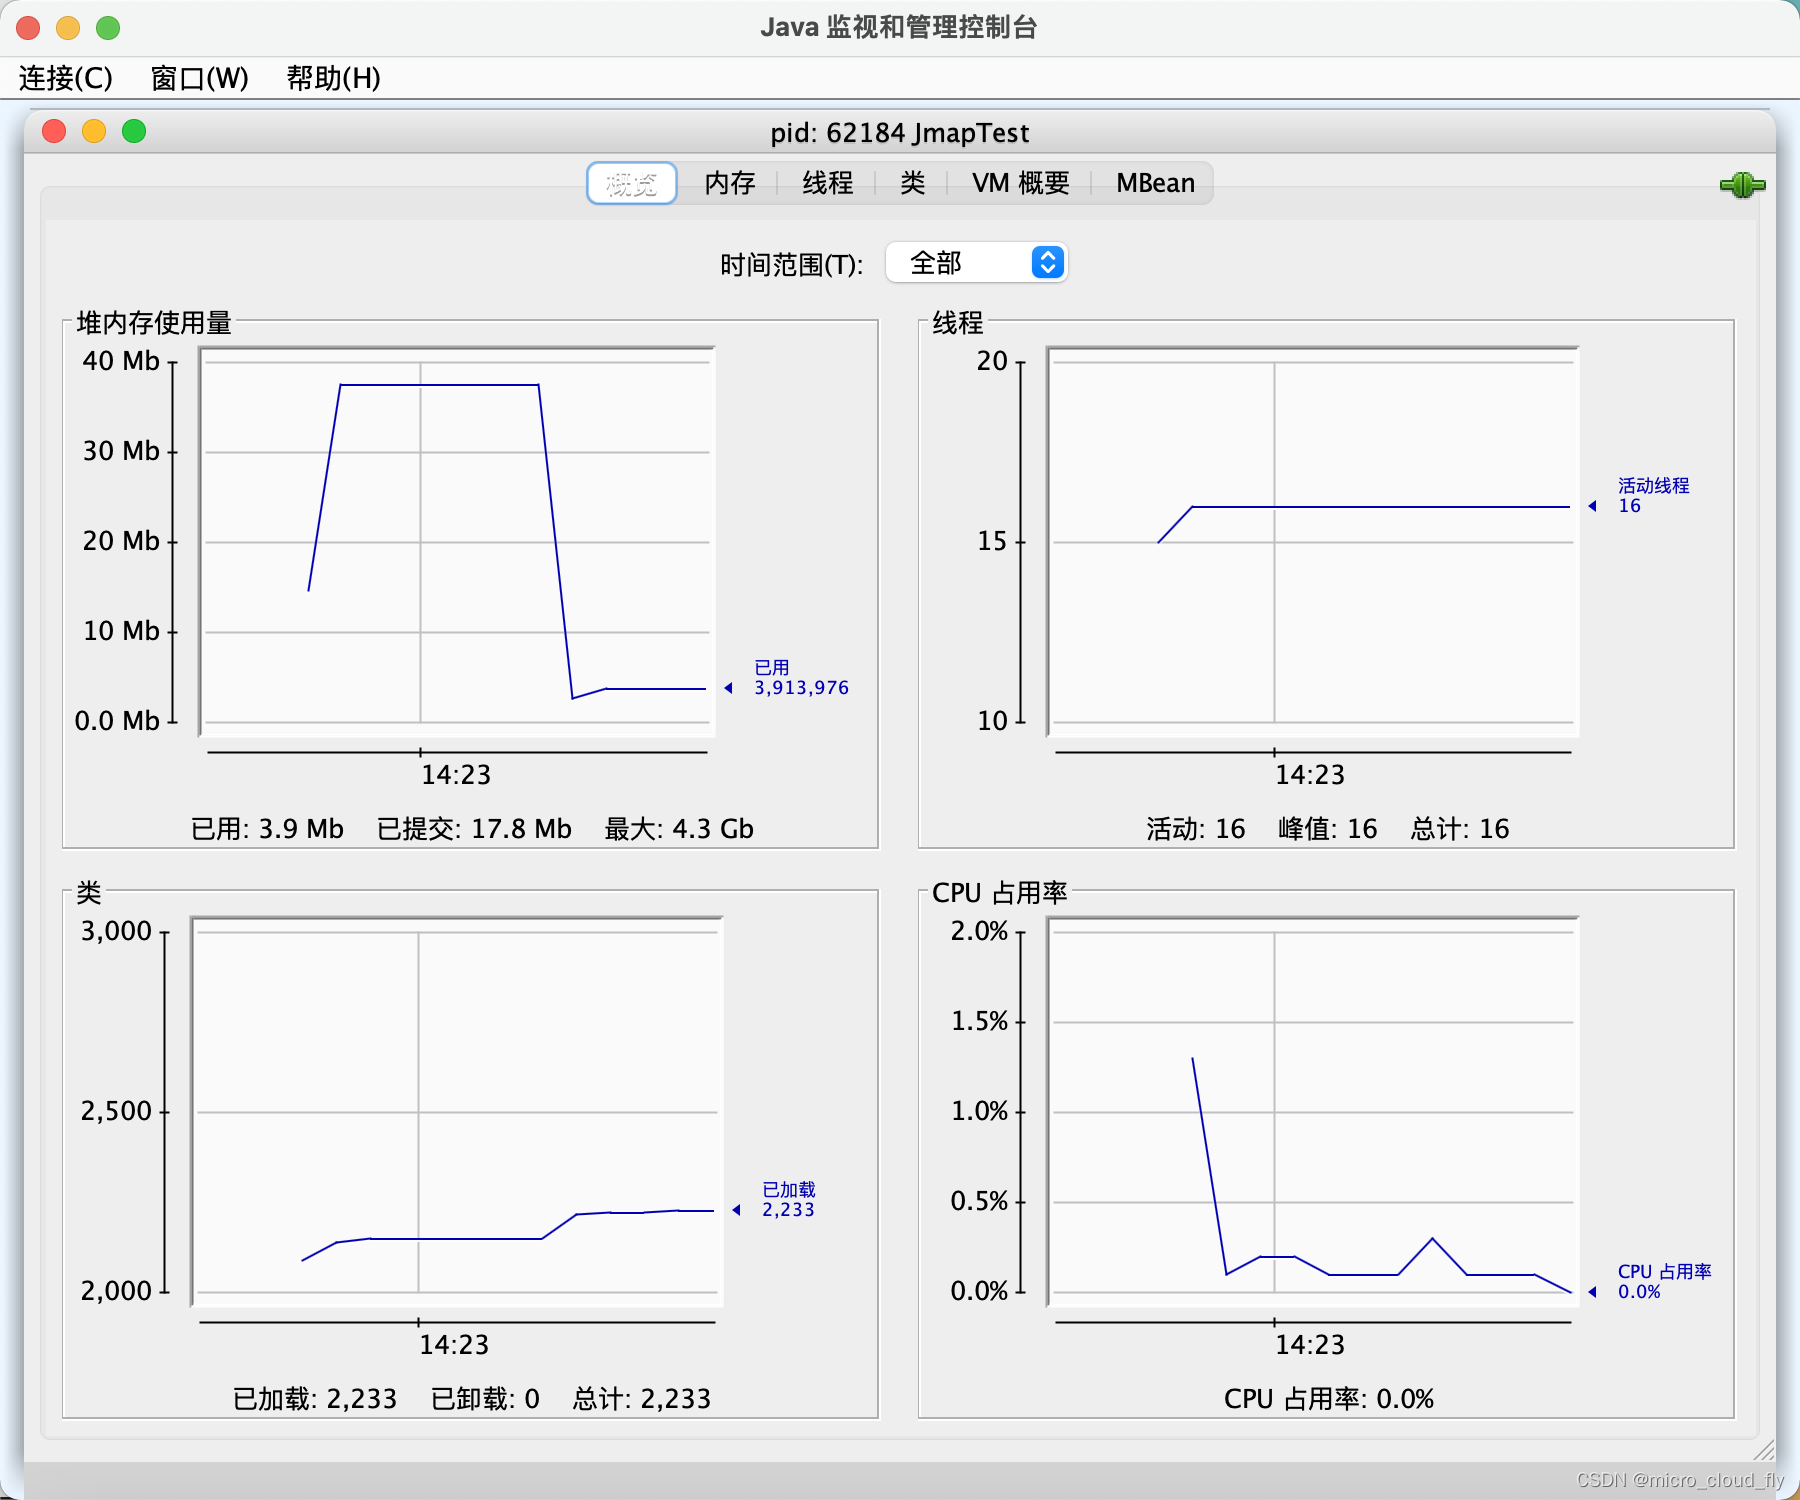
jconsole
运行程序后,直接在命令行输入jconsole命令,会输出如下图形化界面,等待一段时间,就能看到对内存的使用情况了,随着123的输出,对内存的变化一目了然
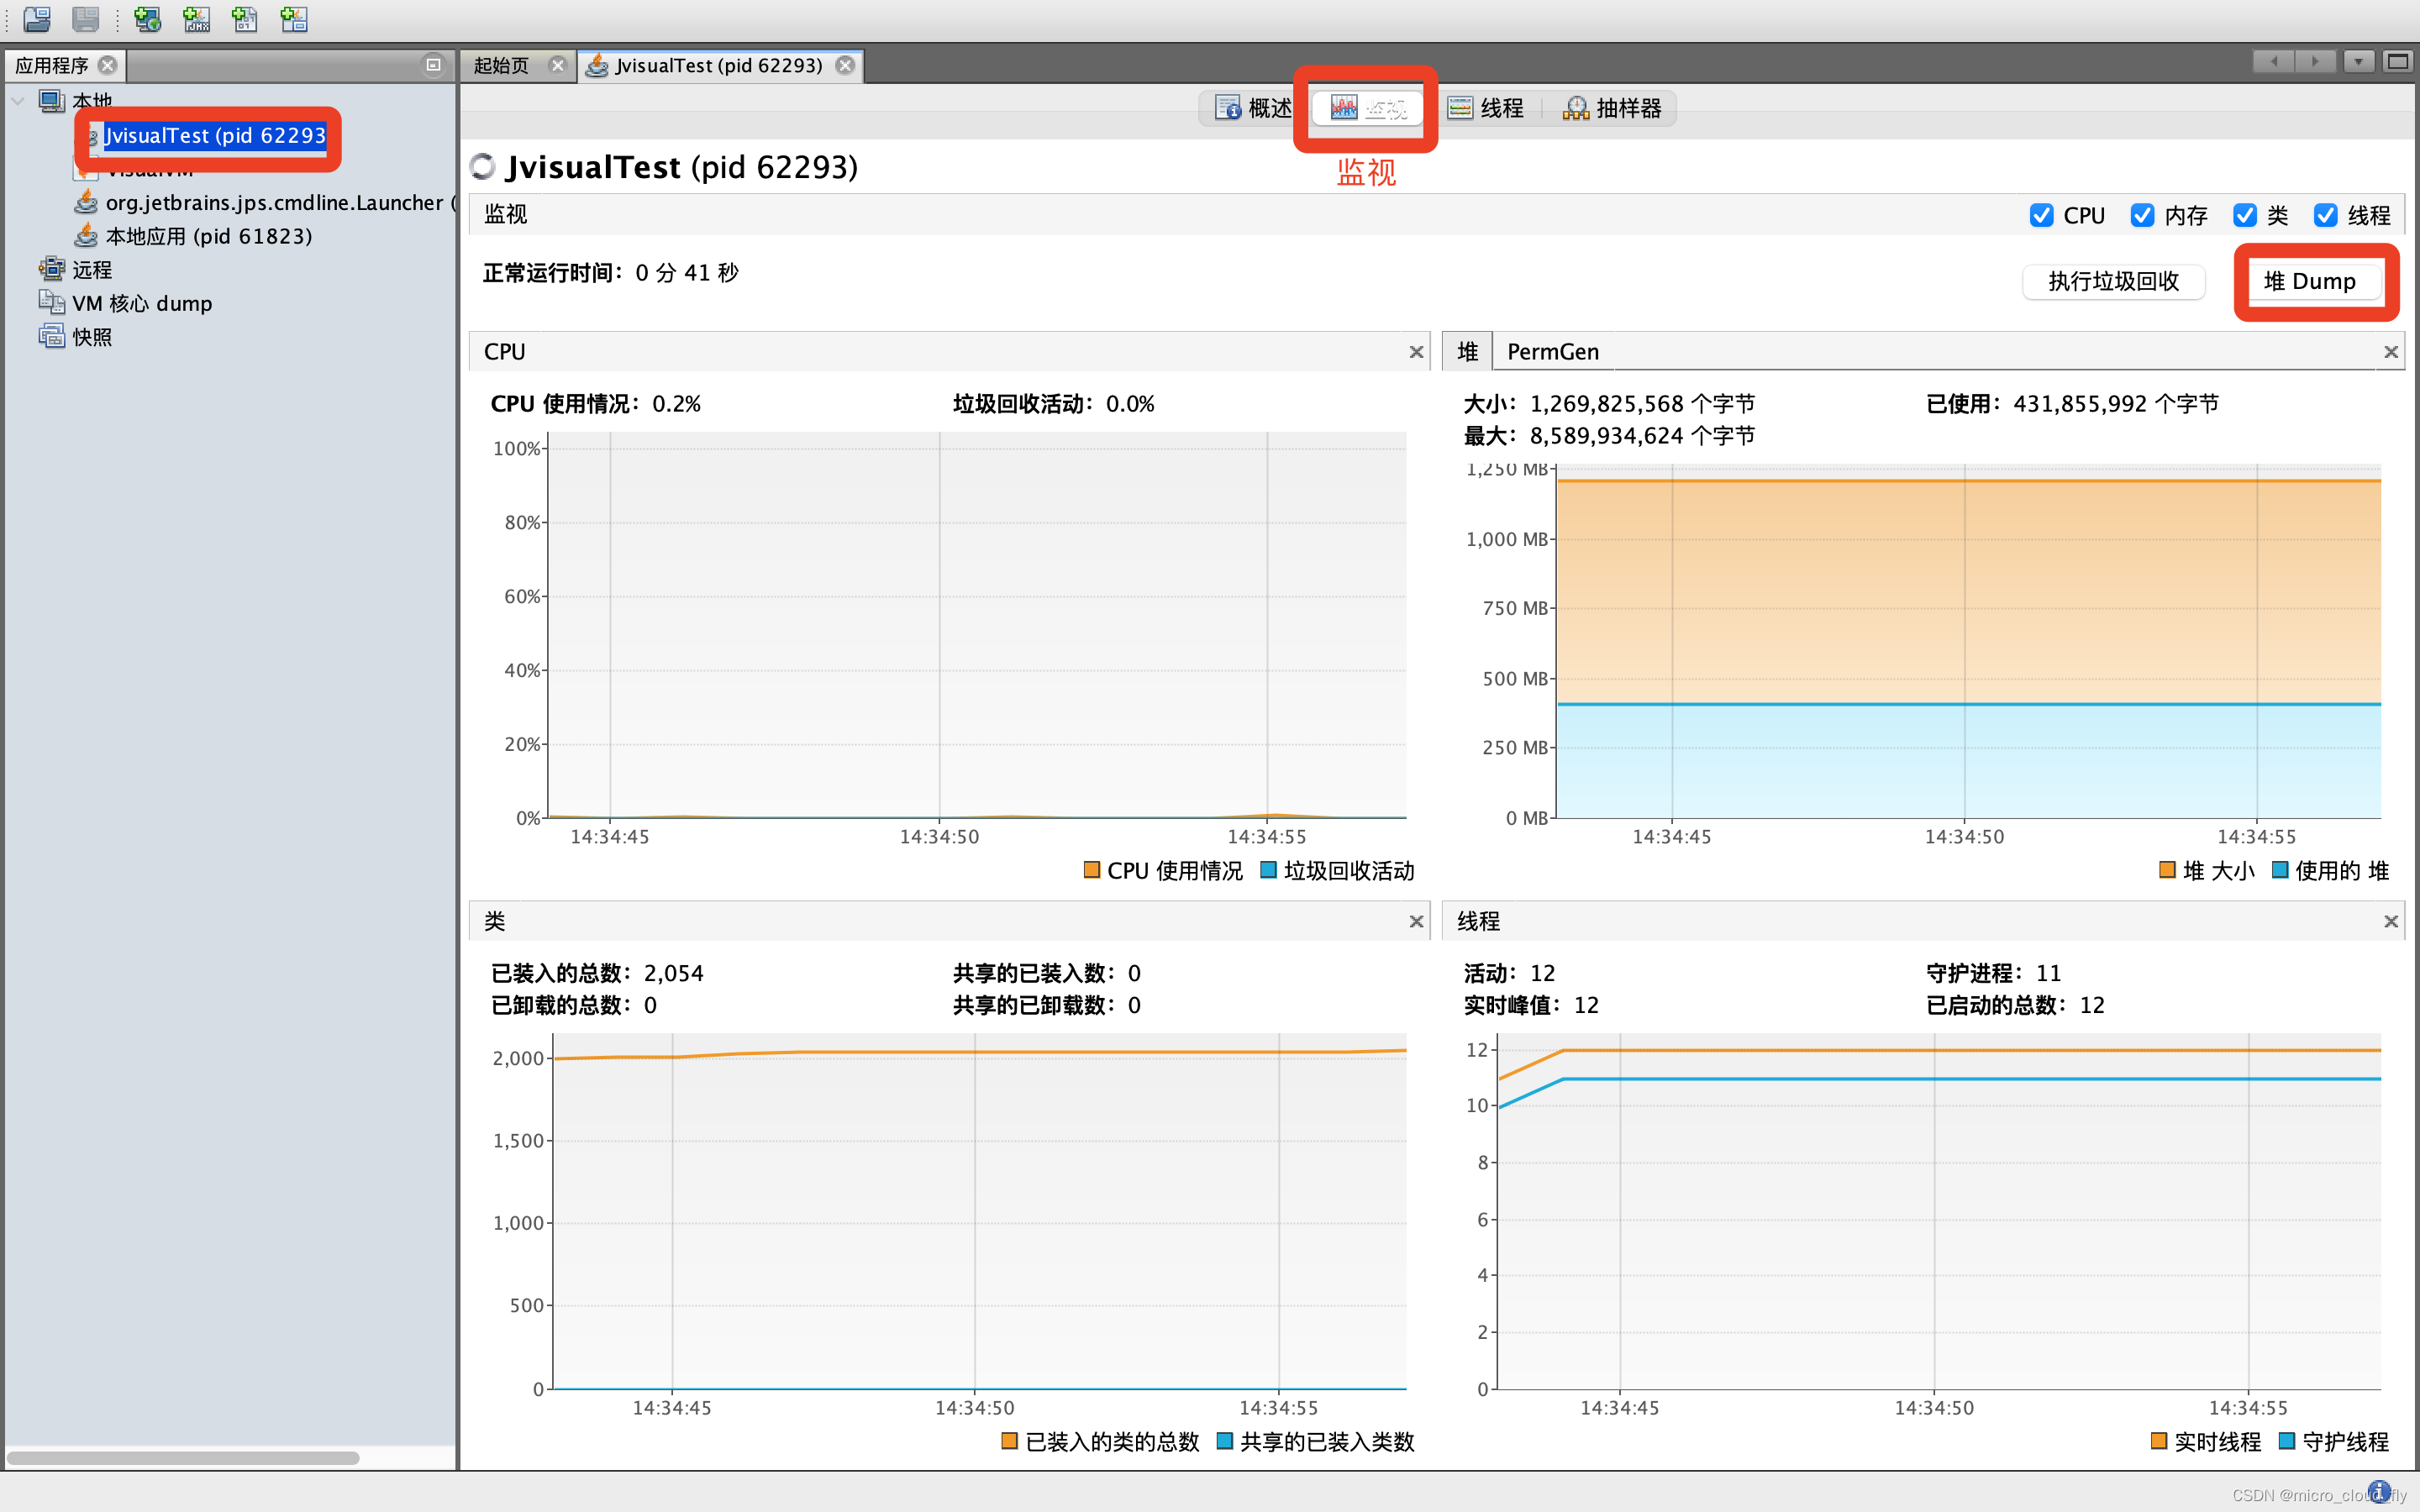
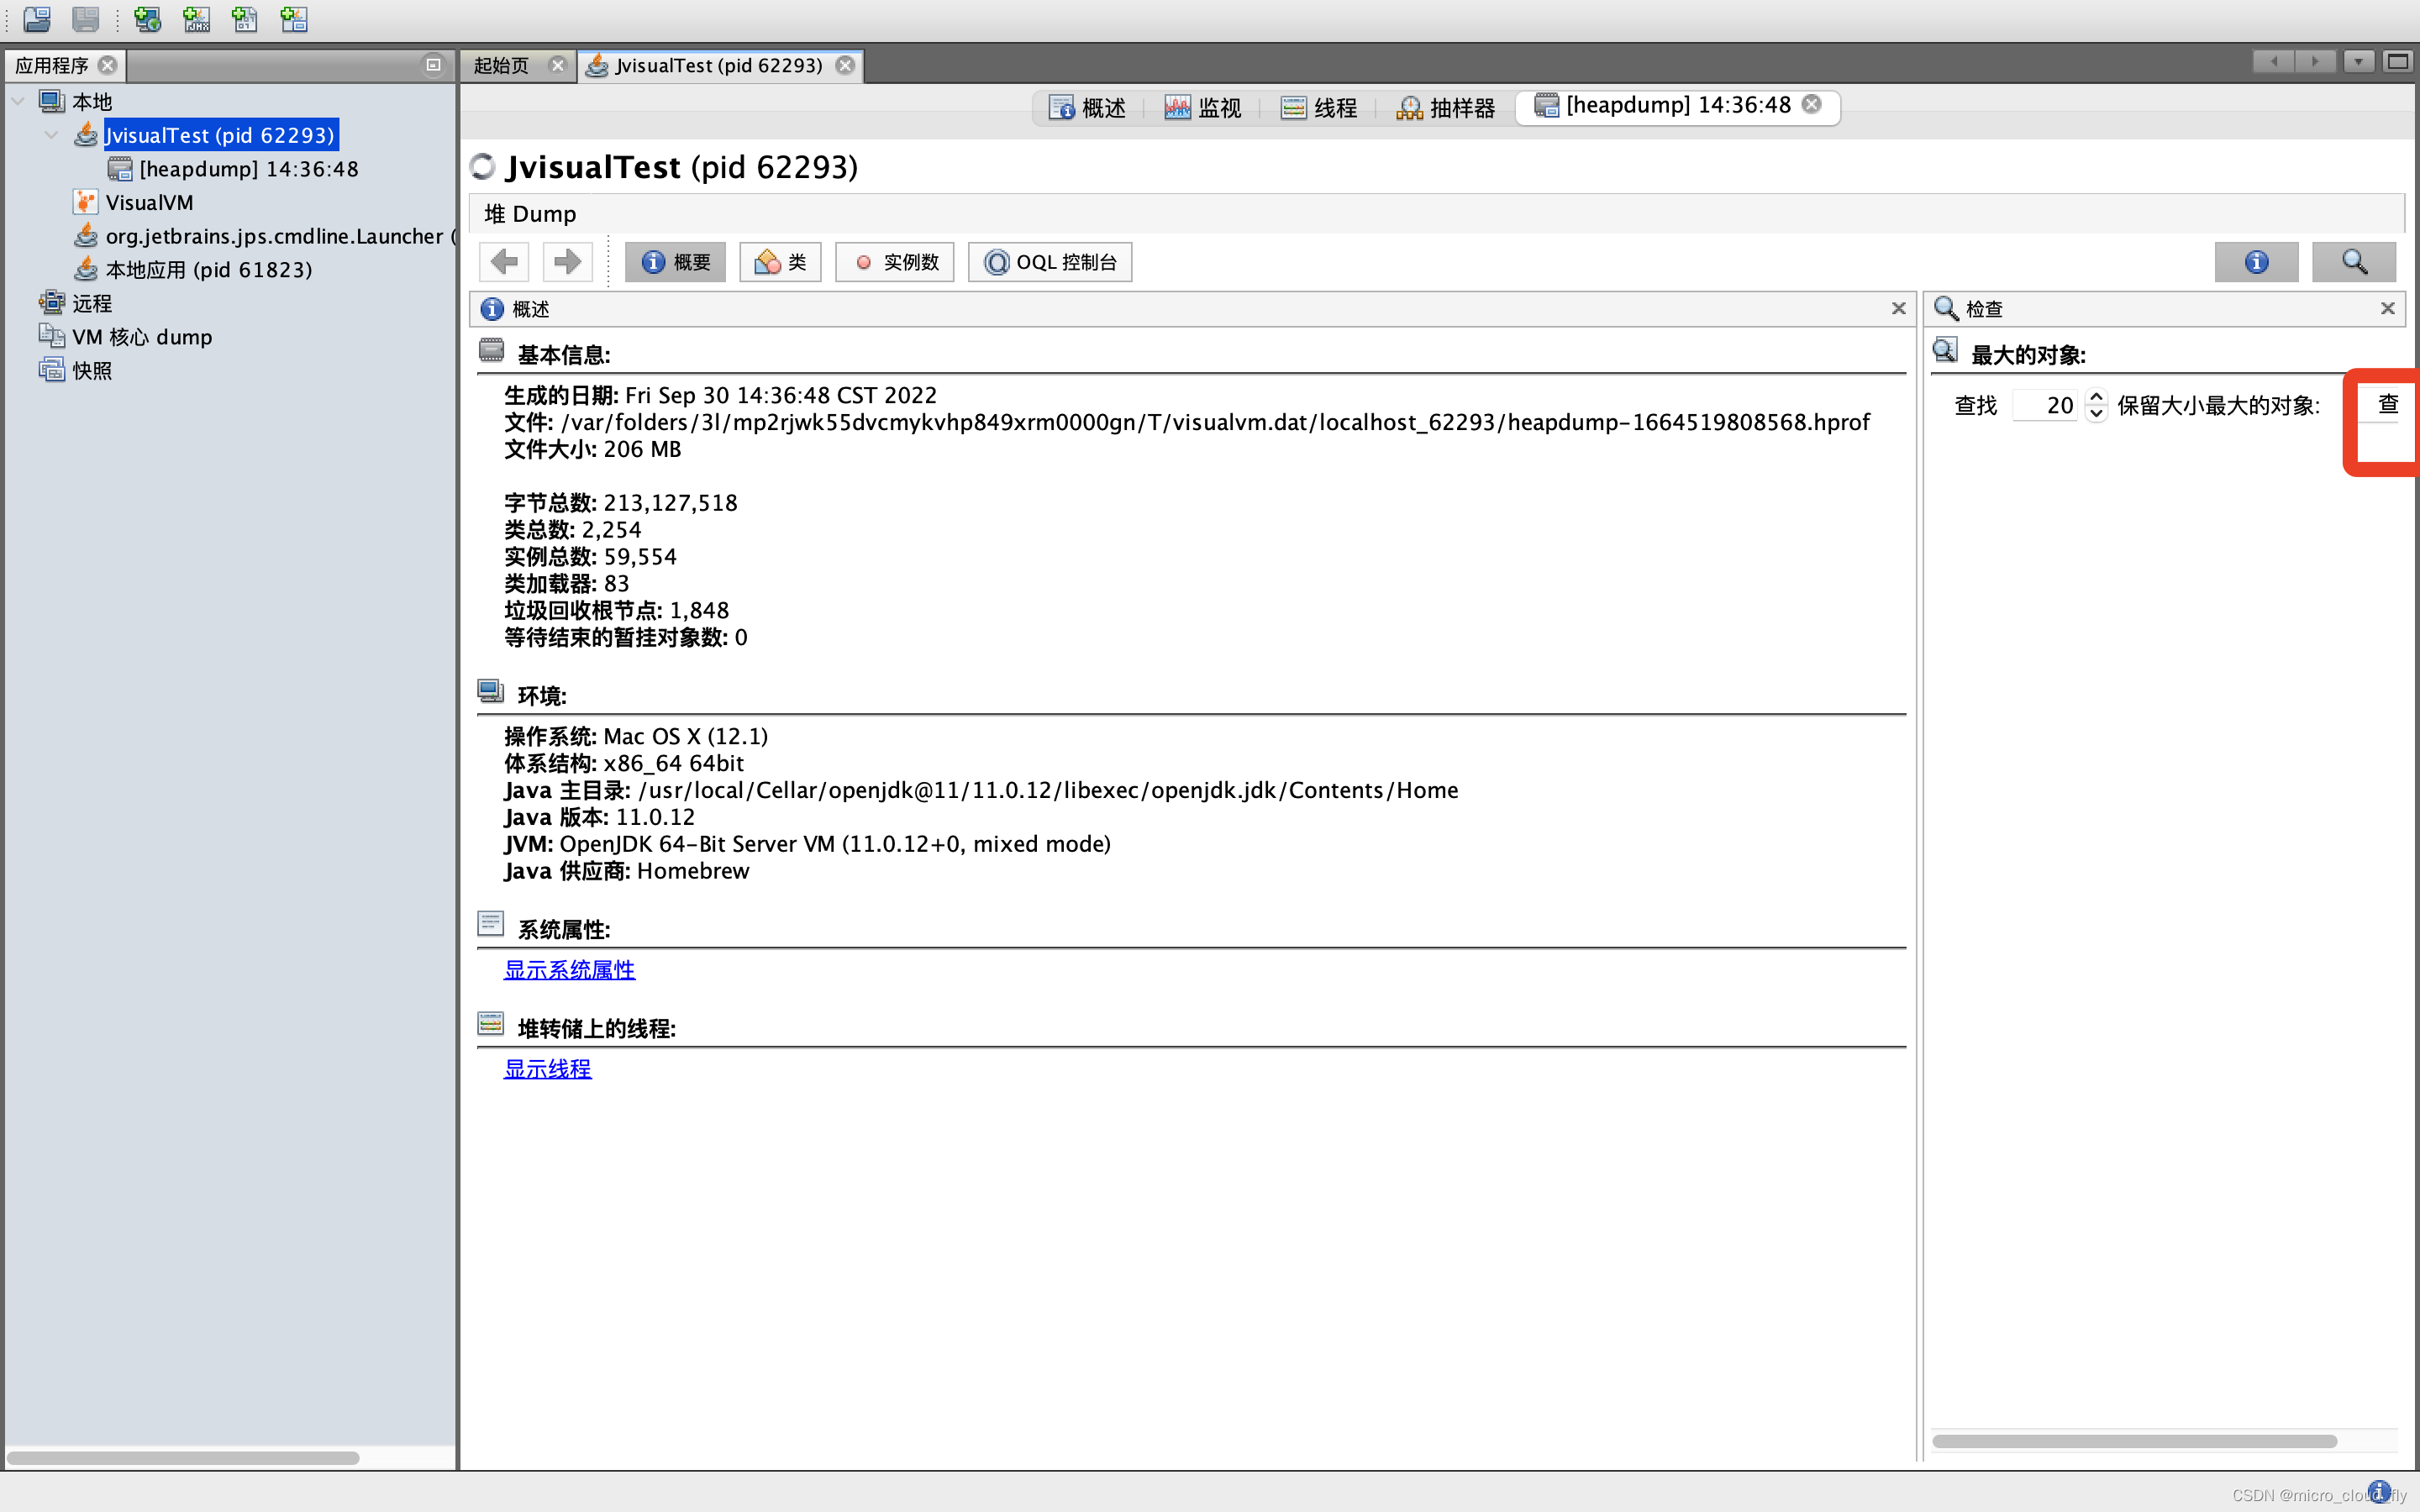
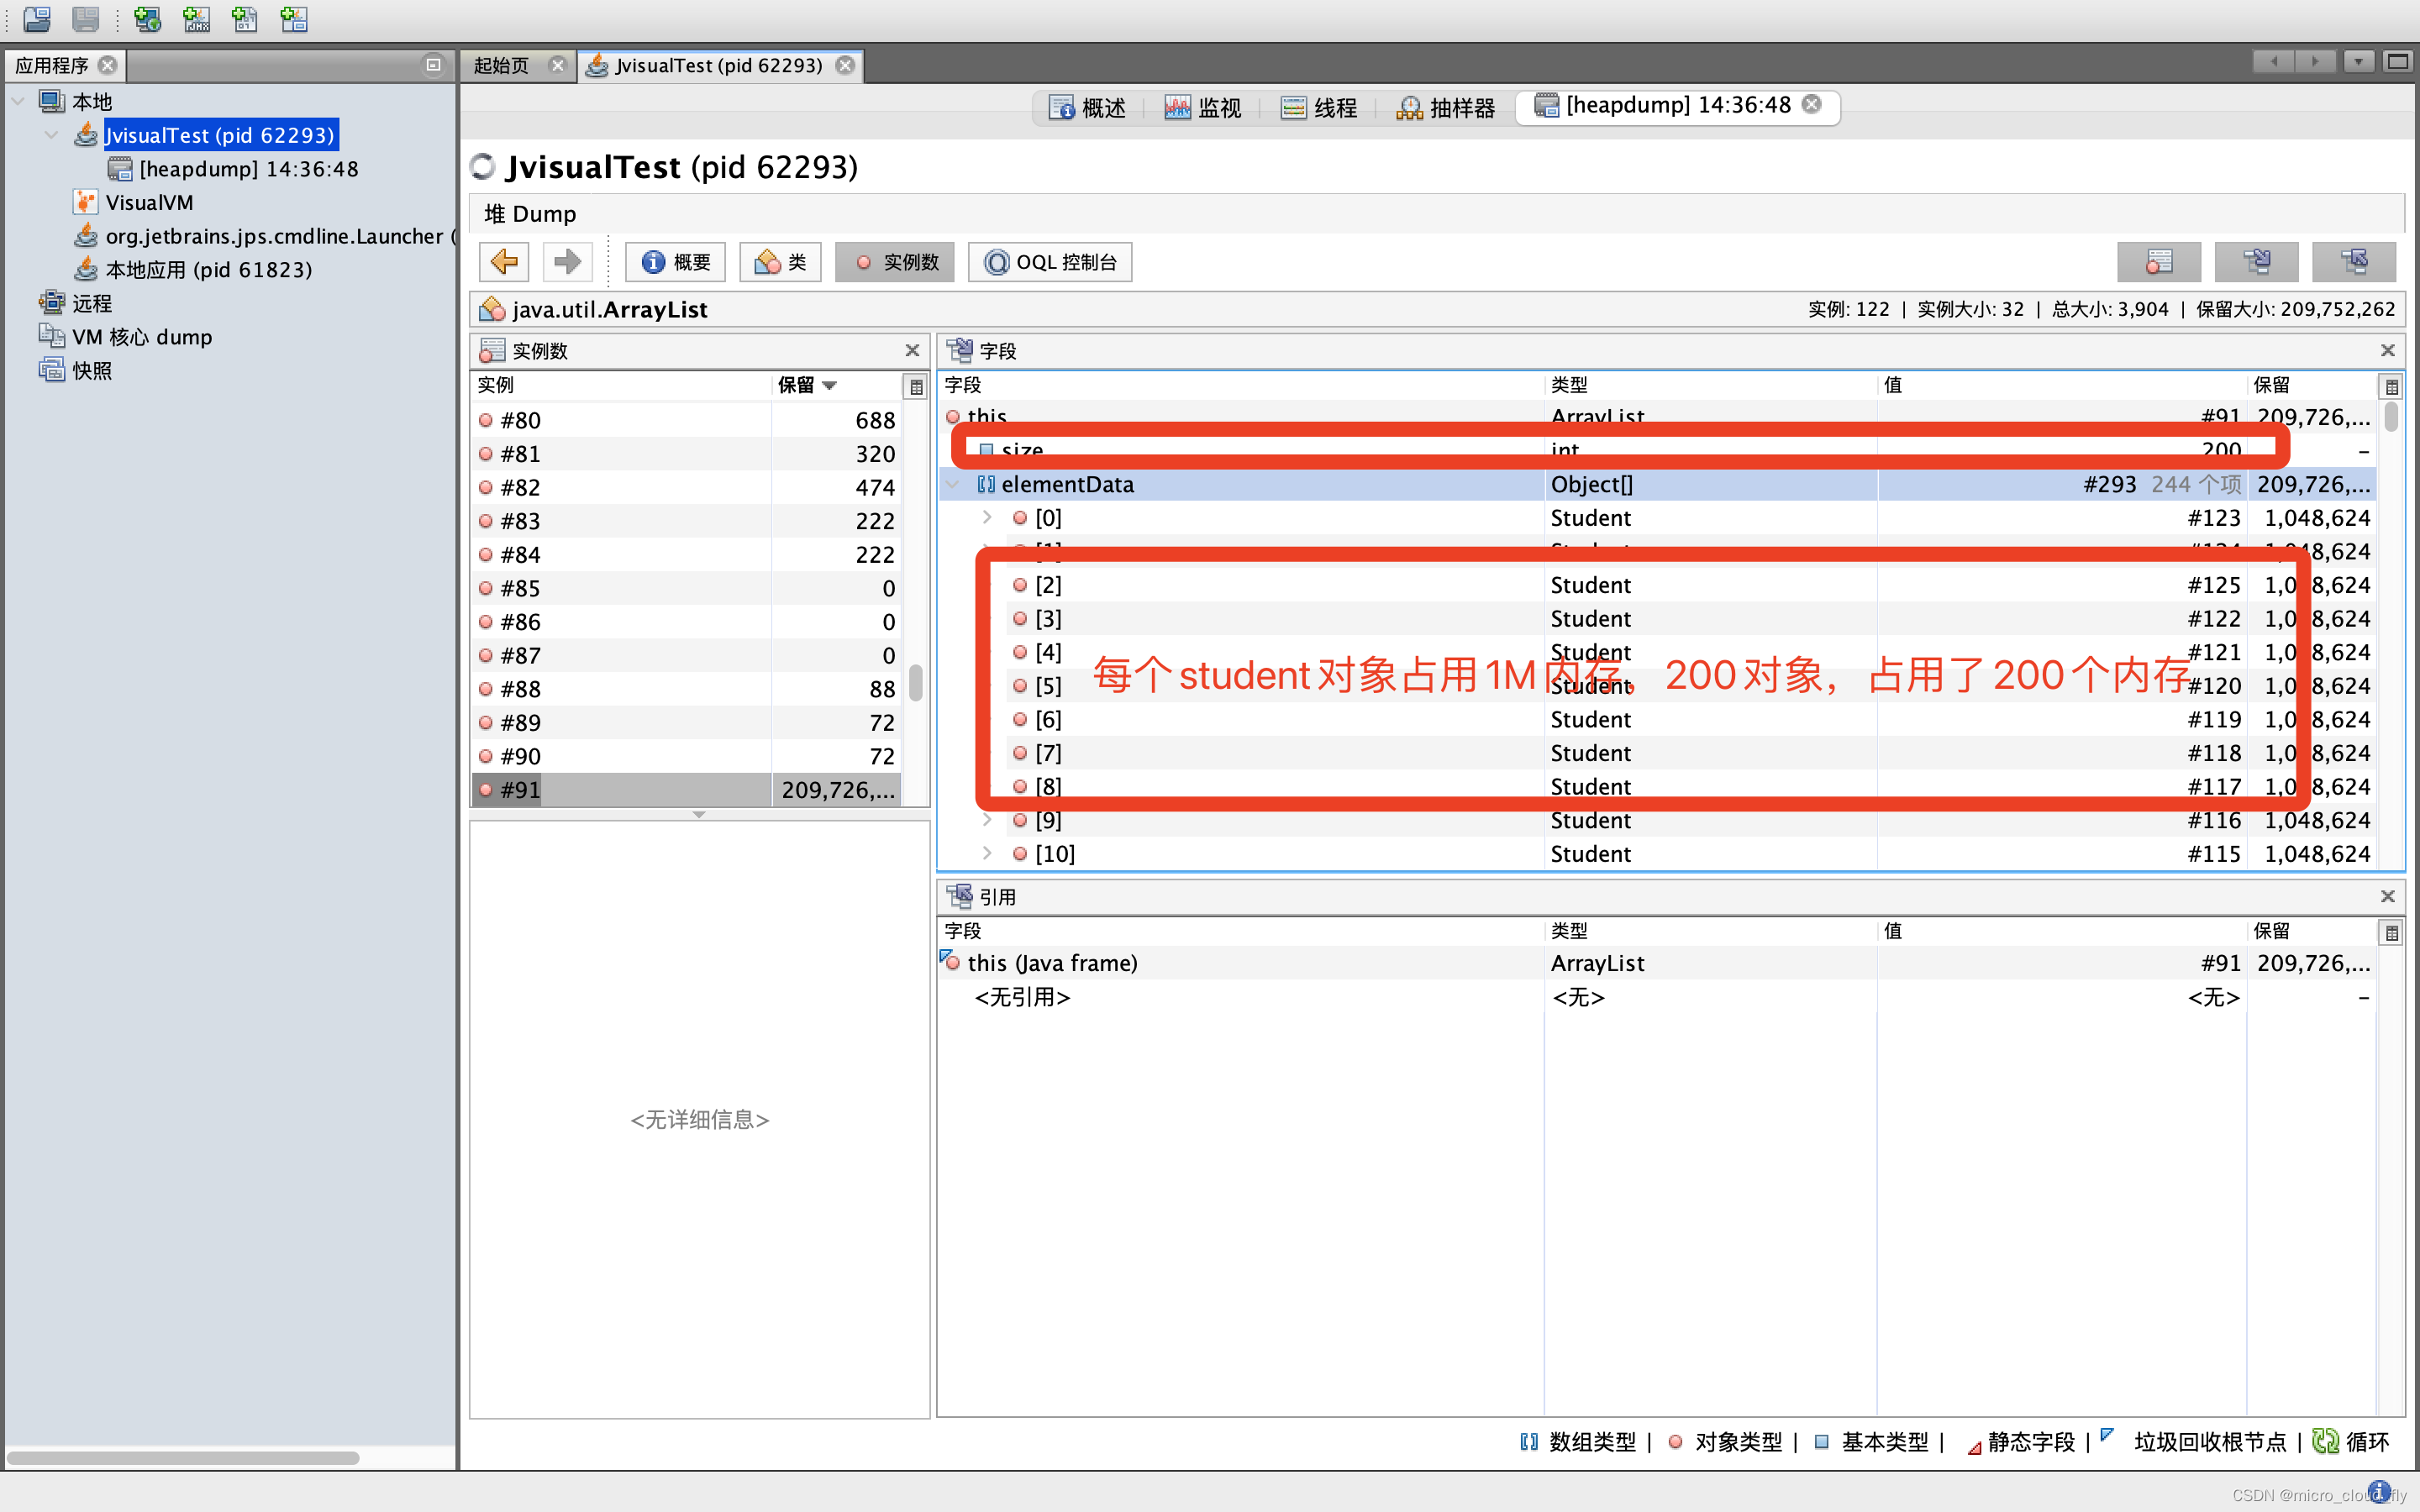
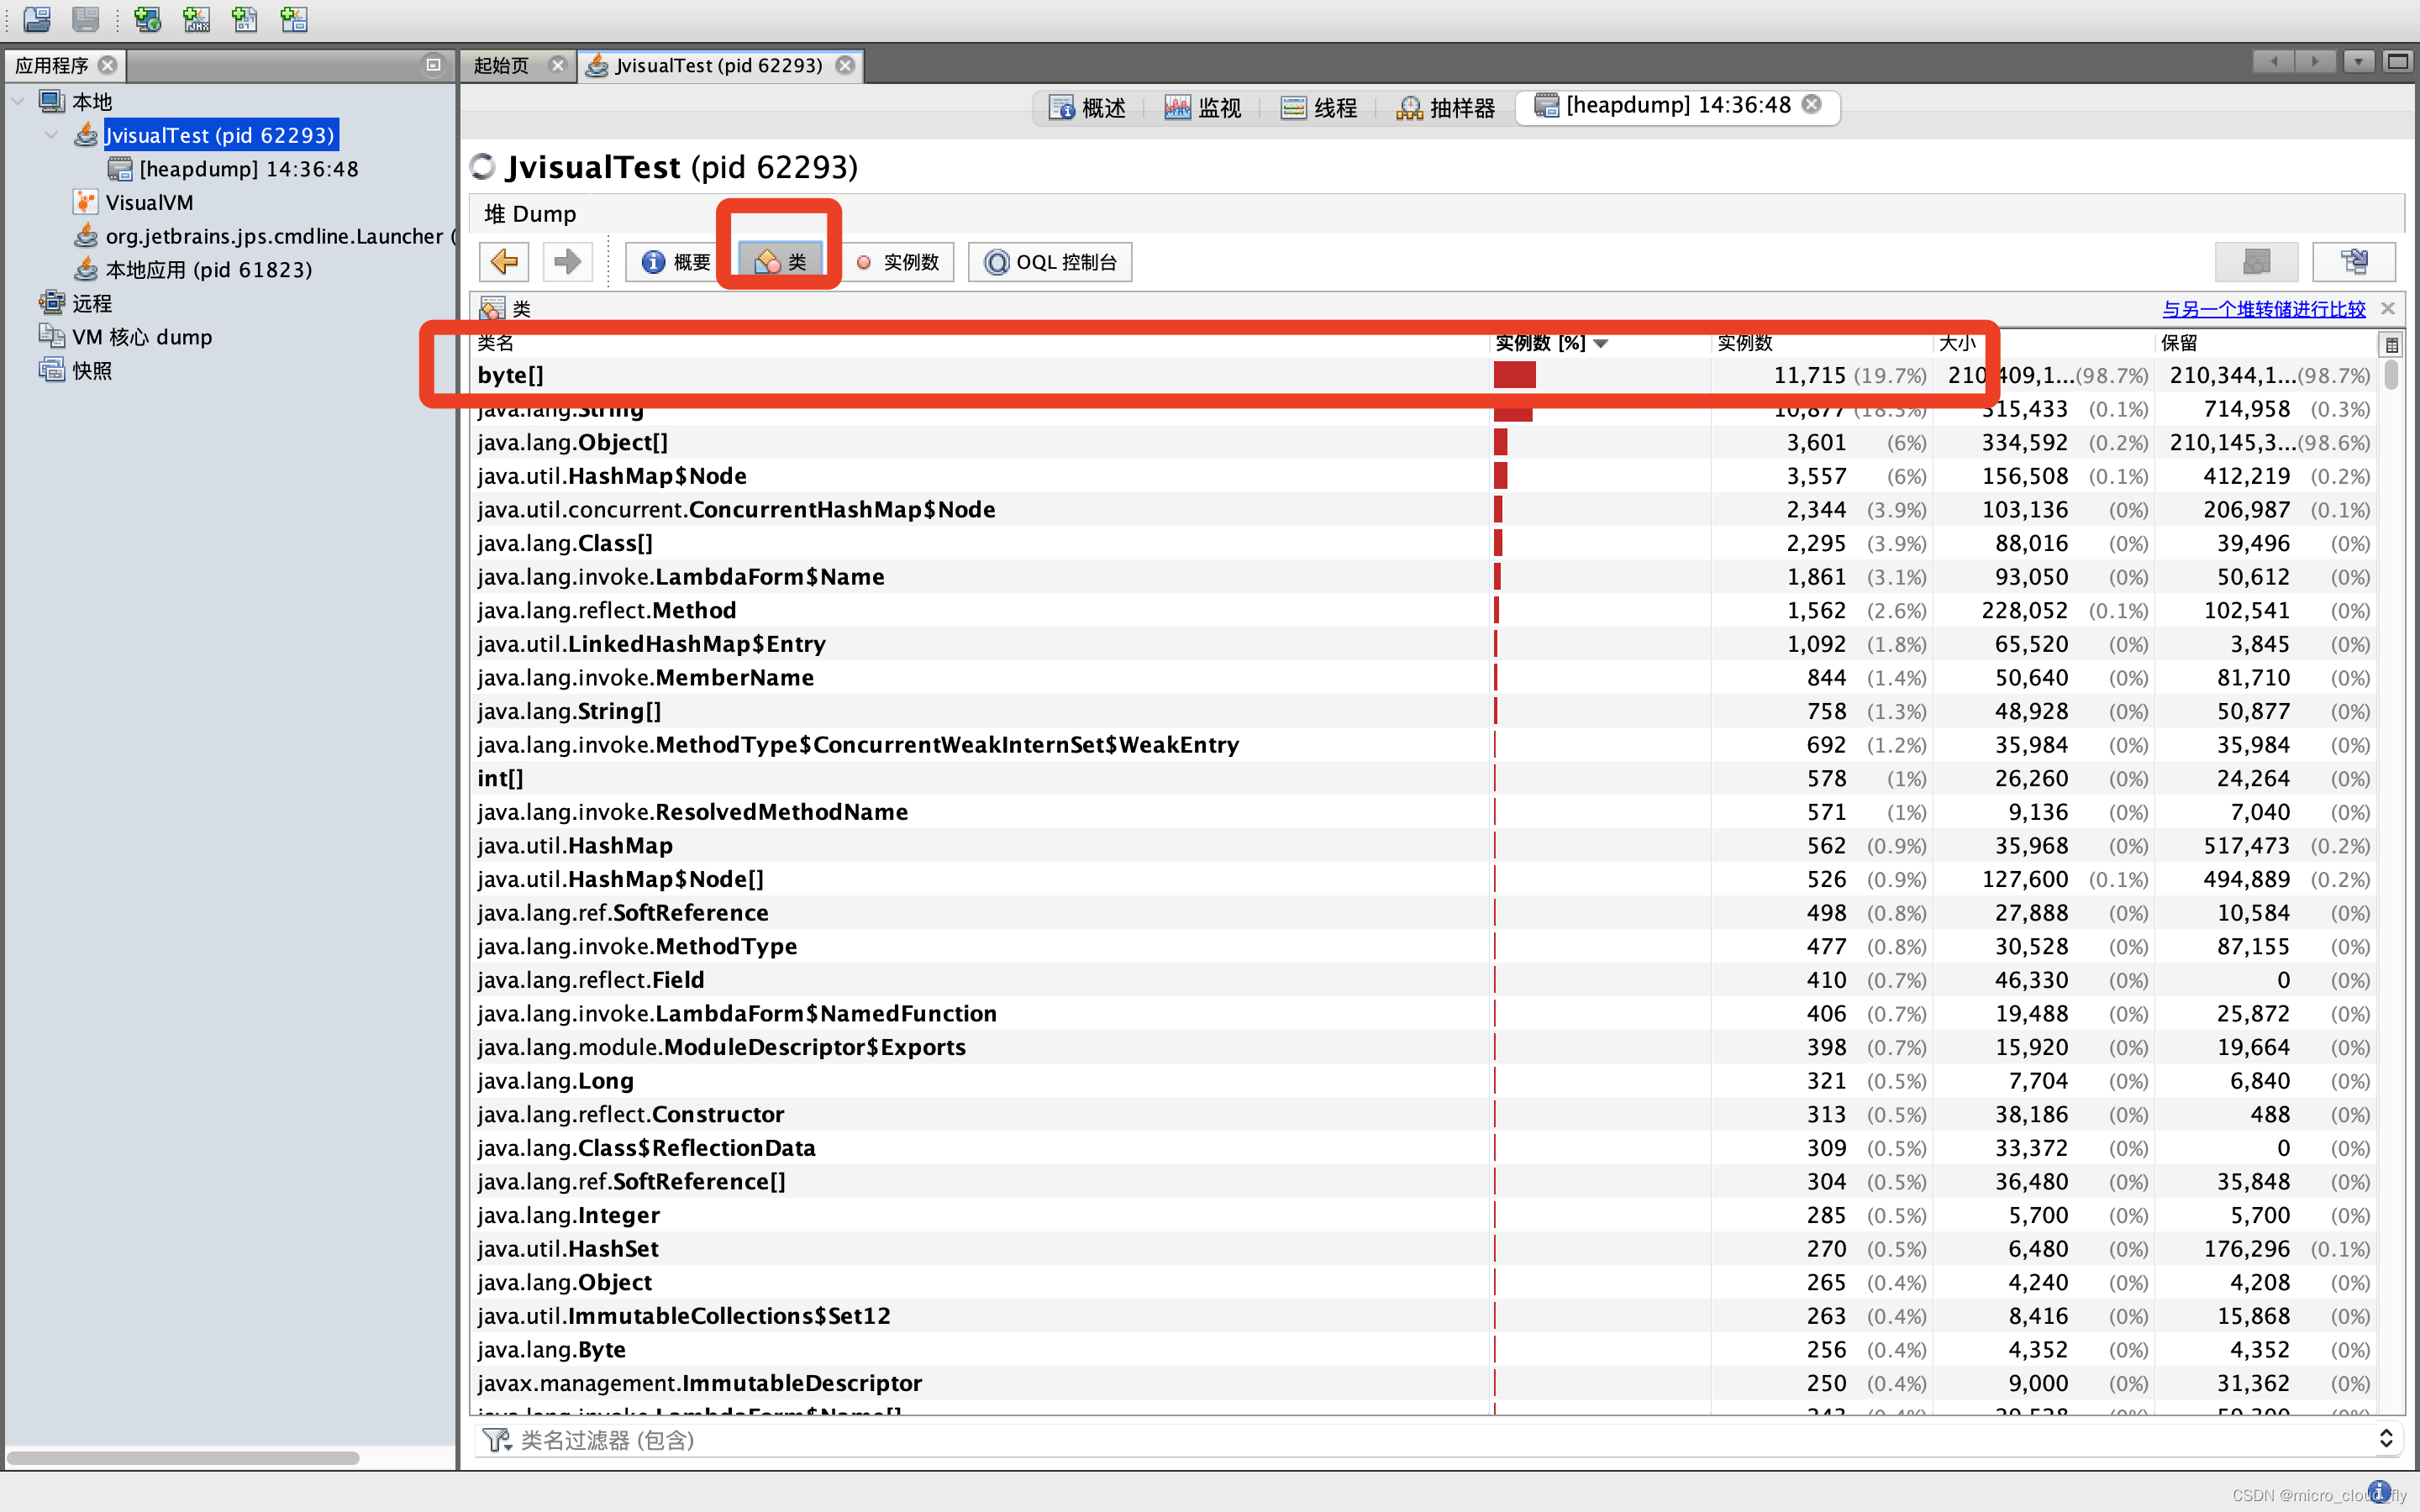
jvisualvm
运行以下代码后,直接在命令行输入jvisualvm命令,得到一下效果
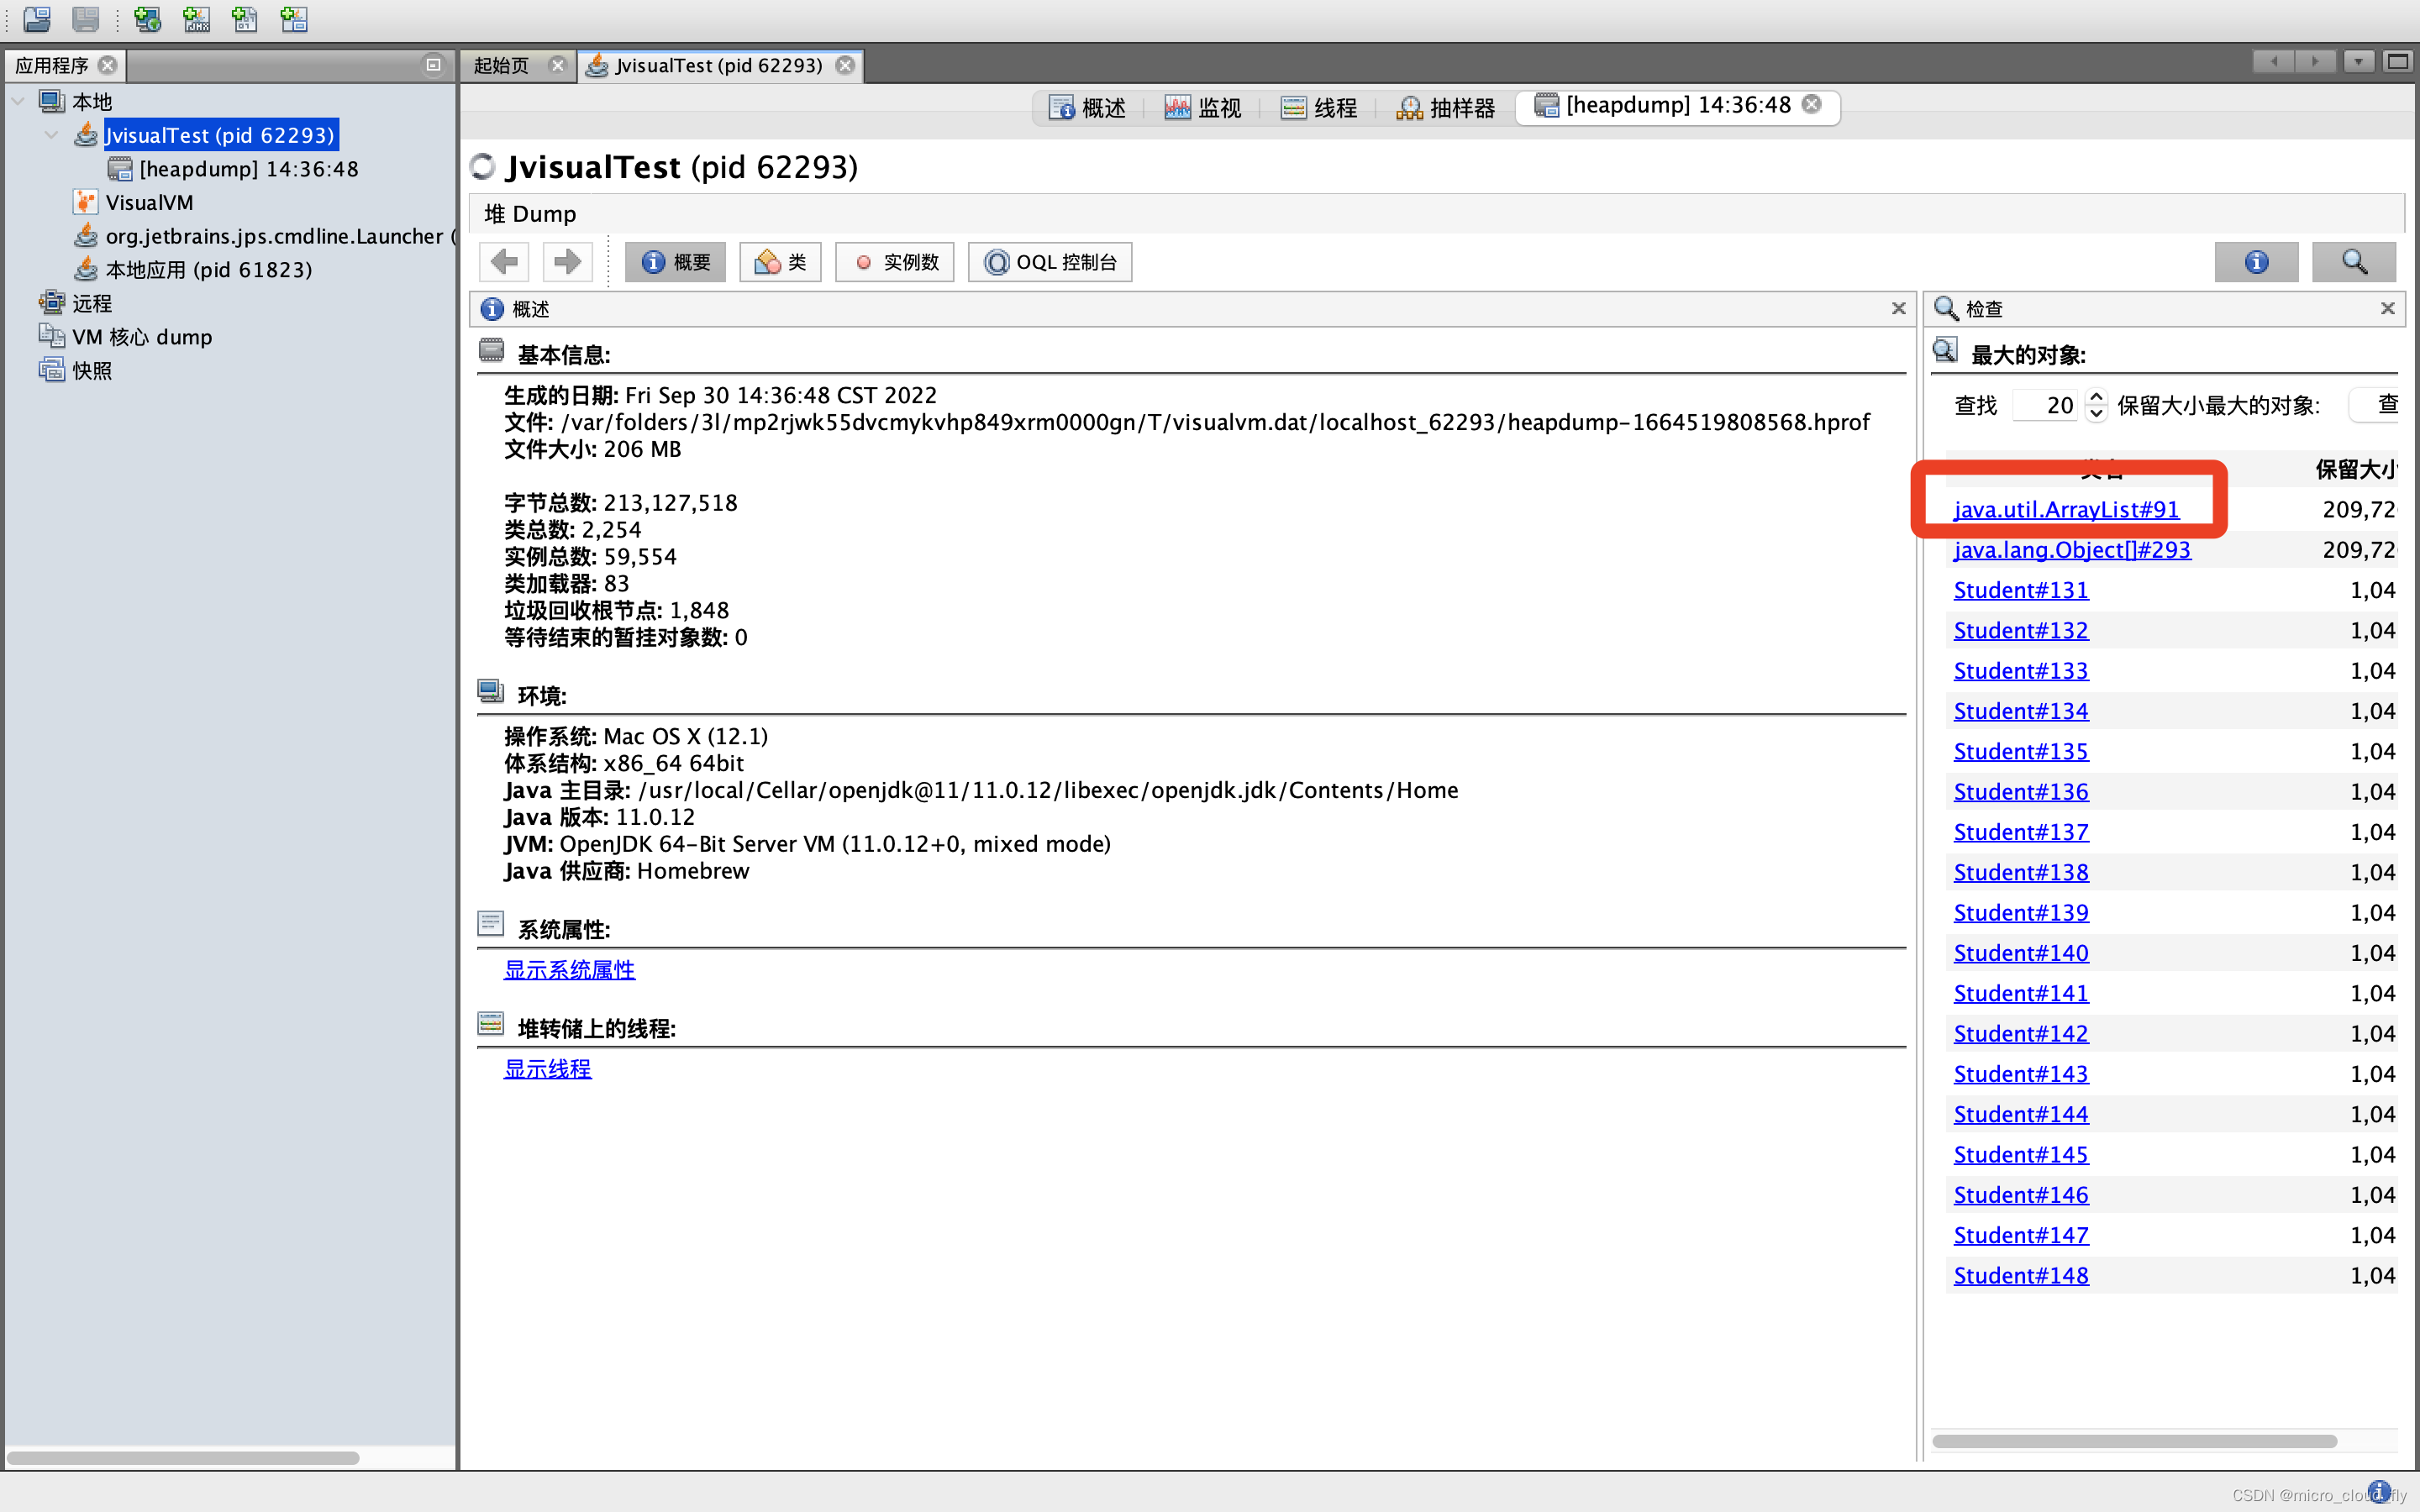
public class JvisualTest {
    public static void main(String[] args) throws Exception {
        ArrayList<Object> students = new ArrayList<>();
        for (int i = 0; i < 200; i++) {
            students.add(new Student());
        }
        Thread.sleep(10000000000L);
    }
}

class Student {
    private byte[] big = new byte[1024 * 1024];
}
总结
jps# 查看当前运行的java进程
sudo jhsdb jmap --heap --pid 对应的pid # 根据pid查看当前进程的堆内存 mac使用
jmap -heap 对应的pid # 根据pid查看当前进程的堆内存 windows linux使用

jconsonle 图形化界面工具
jvisualvm 图形化界面工具


 2189
2189


 被折叠的 条评论
为什么被折叠?
被折叠的 条评论
为什么被折叠?
 到【灌水乐园】发言


