


真的好久好久不用jfreechart了。因为演示程序需要,花了点时间又重新回顾了一下。
一般时序图是嵌套在当前的窗口中,所以将其定义为JPanel的子类,只需在窗口待显示时序图的jpanel里自定义创建代码即可。
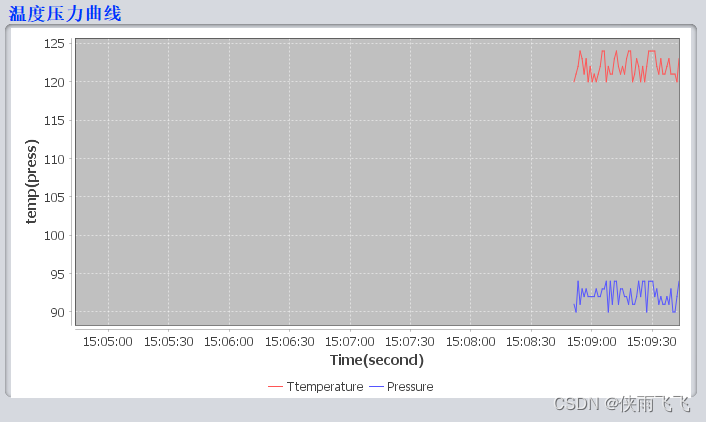
下面的类模拟实现了压力和温度的曲线。
package com.xd;

import java.awt.Dimension;
import java.util.Random;
import java.util.logging.Level;
import java.util.logging.Logger;
import javax.swing.JPanel;

import org.jfree.chart.ChartFactory;
import org.jfree.chart.ChartPanel;
import org.jfree.chart.JFreeChart;
import org.jfree.chart.axis.ValueAxis;
import org.jfree.chart.plot.XYPlot;
import org.jfree.data.time.Millisecond;
import org.jfree.data.time.TimeSeries;
import org.jfree.data.time.TimeSeriesCollection;


public class RealTimeChart extends JPanel
{
    private  TimeSeries timeSeriesTemp;
    private  TimeSeries timeSeriesPress;
    private long value=0;
    private Random tempseed=new Random(10);
    private Random pressseed=new Random(908765);
    ChartPanel chartpanel;
    JFreeChart jfreechart;


    public RealTimeChart(String chartContent,String title,String yaxisName,int width,int height)
    {
        this.setPreferredSize(new Dimension(width, height));
        this.setLayout(null);
        chartpanel=new ChartPanel(createChart(chartContent,title,yaxisName));
        chartpanel.setLocation(10, 25);
        chartpanel.setSize(new Dimension(width -20, height-30));
        chartpanel.setVisible(true);
        this.add(chartpanel);
        this.updateUI();

        init();
    }

    private  JFreeChart createChart(String chartContent,String title,String yaxisName){
        //创建时序图对象
        timeSeriesTemp = new TimeSeries("Ttemperature","Y","long value");
        timeSeriesPress = new TimeSeries("Pressure","Y","long value");
        TimeSeriesCollection timeseriescollection = new TimeSeriesCollection();
         timeseriescollection.addSeries(timeSeriesTemp);
        timeseriescollection.addSeries(timeSeriesPress);
        JFreeChart jfreechart;

         jfreechart = ChartFactory.createTimeSeriesChart(title,"Time(second)",yaxisName,timeseriescollection,true,true,false);

        XYPlot xyplot = jfreechart.getXYPlot();
        //纵坐标设定
        ValueAxis valueaxis = xyplot.getDomainAxis();
        //自动设置数据轴数据范围
        valueaxis.setAutoRange(true);
        //数据轴固定数据范围 300s
        valueaxis.setFixedAutoRange(300000D);

        valueaxis = xyplot.getRangeAxis();
        //valueaxis.setRange(0.0D,200D);

        return jfreechart;
      }


   public void init(){
       Thread t=new Thread(){
           @Override
           public void run(){
               while(true){
                   try {
                       Thread.sleep(1000L);
                       updateGraph();
                   } catch (InterruptedException ex) {
                       Logger.getLogger(RealTimeChart.class.getName()).log(Level.SEVERE, null, ex);
                   }

               }

           }
       };
       t.start();

   }


    public void updateGraph() {

        timeSeriesTemp.add(new Millisecond(), 120 + Math.abs(tempseed.nextInt())%5);
        timeSeriesPress.add(new Millisecond().next(), 90 + Math.abs(pressseed.nextInt())%5);
        System.out.println(120 + tempseed.nextInt()%10);

    }

}
因为是在jpanel中又添加了一个ChartPanel(也继承了JPanel类),显示的时候,稍微有点位置错误,就稍微通过位置修复了一下。


 2834
2834


 被折叠的 条评论
为什么被折叠?
被折叠的 条评论
为什么被折叠?
 到【灌水乐园】发言


