


opencv和matplotlib是比较常用的图像分析模块。在Ipython里面,opencv不能直接显示出来,所以有些时候会借助matplotlib来显示。
%matplotlib inline
.
1、matplotlib的读入与显示
import matplotlib.pyplot as plt
import numpy as np
from PIL import Image

img = Image.open('lena.png') # 读取的图像显示的<matplotlib.image.AxesImage object at 0x7f9f0c60f7f0>
img.show()
img.format

region = img.transpose(Image.ROTATE_180) #翻转
out = img.resize((128, 128)) # 改变大小
out1 = img.rotate(45) #旋转
plt.imshow(img) # 显示

mean=np.array([104., 117., 124.]) #均值
np.shape(img)
img1 -= mean
plt.imshow(img1)
Image.open之后,是以<matplotlib.image.AxesImage object格式保存。
.
2、Image.open格式<—>矩阵
image.open转矩阵
img = Image.open('lena.png')
img1 = np.array(img)
矩阵转 image.open
img = Image.open('lena.png')
img1 = np.array(img)
Image.fromarray(img1 )
3、字节bytes<—>image.open格式以及矩阵格式
有的图片读入方式以.read(),读入之后为Bytes类型。
def get_file_content(filePath):
    with open(filePath, 'rb') as fp:
        return fp.read()
这是要转换为图像格式以及array格式该怎么操作(BytesIO字节读入函数):
	# 转image.open格式——常规
from PIL import Image, ImageDraw, ImageFont
from io import BytesIO
import numpy as np
Image.open(BytesIO(get_file_content(pic_path)))
	# 转成array格式——常规
np.array(Image.open(BytesIO(get_file_content(pic_path))))
BytesIO返回的格式为:<_io.BytesIO at 0x137c4f6f68>
3.1 从url读入并保存
一般情况下请求url的图像内容,使用的是:
from skimage import io
io.imread(url)
但是因为反扒策略,会出现报错:
RemoteDisconnected: Remote end closed connection without response
那么可以就可以使用:
import urllib.request
headers = {'User-Agent': 'User-Agent:Mozilla/5.0 (Macintosh; Intel Mac OS X 10_12_3) AppleWebKit/537.36 (KHTML, like Gecko) Chrome/56.0.2924.87 Safari/537.36'}
req = request.Request(img_l, headers=headers)
pic_infos = request.urlopen(req).read()  # bytes格式读入

# 两种保存
misc.imsave(savepath, np.array(Image.open(BytesIO(pic_infos)))  )
Image.open(BytesIO(pic_infos)).save(savepath)
4 base64编码
图片路径 -> base64编码
def get_file_content_base64(filePath):
    #with open(filePath, 'rb') as fp:
    #    return fp.read()
    with open(filePath,"rb") as f:
    # b64encode是编码,b64decode是解码
        base64_data = base64.b64encode(f.read())
        return base64_data.decode('utf-8')
图片解码-> 显示
Image.open(BytesIO(base64.b64decode(body_result['image'])))
.
5、PIL格式保存
img = Image.open('lena.png')
img .save(savepath)
.
6、在ipython中显示图片
im=Image.open('/home/Picture/test.jpg')
im.show()
有些时候,show()出来,还没有出来,这时候需要加上:
%matplotlib inline
.
7、图像裁剪、旋转、改变
im=Image.open('/home/Picture/test.jpg')
box=(100,100,500,500)
# box=(x,y,x+w,y+h)
region=im.crop(box) #此时,region是一个新的图像对象。
img = Image.open('lena.png') # 读取的图像显示的
region = img.transpose(Image.ROTATE_180) #翻转
out = img.resize((128, 128)) # 改变大小
out1 = img.rotate(45) #旋转
plt.imshow(img) # 显示
.
8、opencv打开的图像用plt显示与保存
显示可以直接imshow
import matplotlib.pyplot as plt
import cv2
img = cv2.imread('01.jpg',cv2.IMREAD_COLOR)

%matplotlib inline
plt.subplot(111)
plt.imshow(img)
常规plt的保存方式为:
plt.savefig("test.png")
但是该方式,保存下来的结果带坐标系的内容,所以仅供观赏。
除了用cv2.imwrite保存cv2读的内容,保存可以用misc (不太对) :
cv2.imwrite('img.jpg',img, [int(cv2.IMWRITE_JPEG_QUALITY), 100] )
from scipy import misc
# numpy直接保存出来
misc.imsave('img.jpg', img)
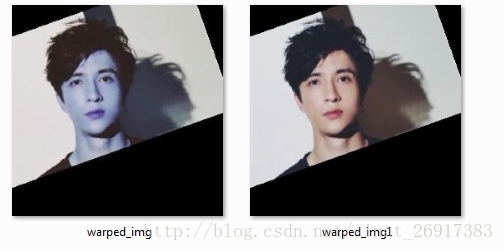
当然会出现通道错误,比如(左图是misc保存的,右图是cv2.imwrite保存的):
延伸一:更精致的画框(带中文)
code起初来源于项目:allanzelener/YAD2K
主要有两个函数:get_colors_for_classes(num_classes)
draw_boxes(image, boxes, box_classes, class_names, scores=None,fnt ="msyh.ttc" )。
其中:get_colors_for_classes(num_classes),输入个数,就会返回相应的颜色,RGB值:
get_colors_for_classes(2)
>>> [(0, 255, 255), (255, 0, 0)]
那么draw_boxes函数各个参数的意思为:
- image:矩阵(width, height, 3)
- boxes:np.array,
(y_min, x_min, y_max, x_max),比如:array([[120, 516, 221, 714], [306, 753, 363, 847], [148, 14, 222, 78]]) - box_classes = [1,2,6],这里是下面的class_names索引,代表本次标注的内容;
- class_names:[‘a’,‘b’,‘c’,‘d’,‘e’,‘f’],这里的class_names指的是全部的标签名称,不代表本次,代表全部;
- scores=None:或者为
np.array(['0.1','0.2','0.3']) - fnt =“msyh.ttc” ,这个为字体,一般要中文输入的话,需要指定中文的字体。
import colorsys
import random

import numpy as np
from PIL import Image, ImageDraw, ImageFont


def get_colors_for_classes(num_classes):
    """Return list of random colors for number of classes given."""
    # Use previously generated colors if num_classes is the same.
    if (hasattr(get_colors_for_classes, "colors") and
            len(get_colors_for_classes.colors) == num_classes):
        return get_colors_for_classes.colors

    hsv_tuples = [(x / num_classes, 1., 1.) for x in range(num_classes)]
    colors = list(map(lambda x: colorsys.hsv_to_rgb(*x), hsv_tuples))
    colors = list(
        map(lambda x: (int(x[0] * 255), int(x[1] * 255), int(x[2] * 255)),
            colors))
    random.seed(10101)  # Fixed seed for consistent colors across runs.
    random.shuffle(colors)  # Shuffle colors to decorrelate adjacent classes.
    random.seed(None)  # Reset seed to default.
    get_colors_for_classes.colors = colors  # Save colors for future calls.
    return colors


def draw_boxes(image, boxes, box_classes, class_names, scores=None,fnt ="msyh.ttc" ):
    """Draw bounding boxes on image.
    Draw bounding boxes with class name and optional box score on image.
    Args:
        image: An `array` of shape (width, height, 3) with values in [0, 1].
        boxes: An `array` of shape (num_boxes, 4) containing box corners as
            (y_min, x_min, y_max, x_max).
        box_classes: A `list` of indicies into `class_names`.
        class_names: A `list` of `string` class names.
        `scores`: A `list` of scores for each box.
    Returns:
        A copy of `image` modified with given bounding boxes.
    """
    #image = Image.fromarray(np.floor(image * 255 + 0.5).astype('uint8'))
	image = Image.fromarray(image)

    font = ImageFont.truetype(
        font=fnt,
        size=np.floor(3e-2 * image.size[1] + 0.5).astype('int32'))
    thickness = (image.size[0] + image.size[1]) // 300

    colors = get_colors_for_classes(len(class_names))

    for i, c in list(enumerate(box_classes)):
        box_class = class_names[c]
        box = boxes[i]
        if isinstance(scores, np.ndarray):
            score = scores[i]
            label = '{} {:.2f}'.format(box_class, score)
        else:
            label = '{}'.format(box_class)

        draw = ImageDraw.Draw(image)
        label_size = draw.textsize(label, font)

        top, left, bottom, right = box
        top = max(0, np.floor(top + 0.5).astype('int32'))
        left = max(0, np.floor(left + 0.5).astype('int32'))
        bottom = min(image.size[1], np.floor(bottom + 0.5).astype('int32'))
        right = min(image.size[0], np.floor(right + 0.5).astype('int32'))
        print(label, (left, top), (right, bottom))

        if top - label_size[1] >= 0:
            text_origin = np.array([left, top - label_size[1]])
        else:
            text_origin = np.array([left, top + 1])

        # My kingdom for a good redistributable image drawing library.
        for i in range(thickness):
            draw.rectangle(
                [left + i, top + i, right - i, bottom - i], outline=colors[c])
        draw.rectangle(
            [tuple(text_origin), tuple(text_origin + label_size)],
            fill=colors[c])
        draw.text(text_origin, label, fill=(0, 0, 0), font=font)
        del draw

    return np.array(image)


 被折叠的 条评论
为什么被折叠?
被折叠的 条评论
为什么被折叠?
 到【灌水乐园】发言


