


一、引言
在Go语言的世界里,并发编程就像是与生俱来的天赋。通过轻量级的goroutine和channel机制,Go让并发编程变得优雅而高效。然而,正如一把双刃剑,强大的并发能力在带来效率提升的同时,也隐藏着各种性能陷阱 —— 协程泄漏、锁竞争、内存分配不合理等问题往往会在系统压力增大时悄然显现。
这些隐蔽的性能问题就像迷宫中的幽灵,单靠直觉和经验难以捕捉。我们需要一个专业的"侦探工具",而Go语言内置的pprof正是这样一位优秀的"性能侦探"。作为官方提供的分析工具,pprof与Go语言深度集成,能够以极低的运行时开销收集程序的各种性能指标,帮助开发者找出性能瓶颈的真凶。
本文旨在为有一定Go开发经验的工程师提供一份pprof实战指南,带你从基础知识到高级应用,全面掌握如何使用pprof分析并优化Go并发程序的性能。无论你是在构建高并发API服务,还是处理大规模数据的后台任务,这份指南都将成为你解决性能问题的有力工具。
二、pprof基础知识
pprof的前世今生
pprof并非Go独创,它源自Google的性能分析工具,后被集成到Go语言中,形成了我们现在使用的版本。你可以把pprof想象成一个精密的"性能显微镜",它能够在程序运行时以极小的干扰代价,收集各种性能数据,并生成直观的分析报告。
核心概念:pprof是一套性能分析工具,而不仅是单个工具,它包括数据收集器和分析器两大部分。
pprof支持的分析维度
就像医生诊断病人需要检查多项指标一样,pprof也提供了多种性能"体检项目":
| 分析类型 | 作用 | 适用场景 |
|---|---|---|
| CPU Profile | 收集程序CPU使用情况 | 定位计算密集型瓶颈 |
| Heap Profile | 分析内存分配情况 | 查找内存泄漏、GC压力大的区域 |
| Goroutine Profile | 分析协程状态和分布 | 发现协程泄漏、阻塞问题 |
| Block Profile | 分析协程阻塞情况 | 发现I/O、通道、同步原语导致的阻塞 |
| Mutex Profile | 分析互斥锁竞争情况 | 发现锁争用热点 |
| Threadcreate Profile | 跟踪操作系统线程创建情况 | 分析是否存在过多线程创建 |
与标准库的集成
Go语言在设计上对性能分析给予了充分重视,将pprof工具通过两个主要包进行了集成:
// 用于命令行程序
import "runtime/pprof"

// 用于HTTP服务,提供了web界面
import "net/http/pprof"
这种深度集成使得在Go程序中添加性能分析能力变得异常简单,几乎不需要修改现有代码结构。
采样原理与数据收集机制
pprof的工作方式就像一个周期性按下"暂停键"的摄影师,通过在特定间隔对程序状态进行快照,累积足够的样本后形成统计结果。
关键技术点:
- CPU profiling:通过信号机制,每隔一定时间(默认100Hz)对所有goroutine的堆栈进行采样
- 内存profiling:在内存分配时记录采样数据,默认每512KB采样一次
- 阻塞/互斥profiling:在阻塞/获取锁事件发生时记录
这种基于采样的方法是pprof能够在生产环境低开销运行的关键,它用统计学的思想,以"牺牲精确度换取低干扰性"的方式工作。
三、搭建分析环境
将pprof集成到你的项目中,就像在战场上部署侦察装备一样重要。根据不同的应用类型,我们有两种主要集成方式。
在命令行程序中集成pprof
对于命令行工具或后台服务,可以使用runtime/pprof包直接将性能数据写入文件:
// profile_cli.go
package main

import (
    "flag"
    "log"
    "os"
    "runtime/pprof"
)

var cpuprofile = flag.String("cpuprofile", "", "写入cpu profile到指定文件")
var memprofile = flag.String("memprofile", "", "写入memory profile到指定文件")

func main() {
    // 解析命令行参数
    flag.Parse()

    // CPU profile
    if *cpuprofile != "" {
        f, err := os.Create(*cpuprofile)
        if err != nil {
            log.Fatal("无法创建CPU profile文件:", err)
        }
        defer f.Close()

        log.Println("开始收集CPU profile...")
        if err := pprof.StartCPUProfile(f); err != nil {
            log.Fatal("无法启动CPU profile:", err)
        }
        defer pprof.StopCPUProfile() // 程序结束前停止profile
    }

    // 这里是你的主程序逻辑
    doSomeIntensiveWork()

    // 内存profile
    if *memprofile != "" {
        f, err := os.Create(*memprofile)
        if err != nil {
            log.Fatal("无法创建memory profile:", err)
        }
        defer f.Close()

        log.Println("收集内存profile...")
        // 先触发GC,获得更准确的内存使用情况
        // runtime.GC()
        if err := pprof.WriteHeapProfile(f); err != nil {
            log.Fatal("无法写入memory profile:", err)
        }
    }
}

func doSomeIntensiveWork() {
    // 模拟CPU密集型工作
    // ...
}
使用方式:
# 收集CPU profile
$ go build -o myapp
$ ./myapp -cpuprofile=cpu.prof

# 分析结果
$ go tool pprof cpu.prof
在HTTP服务中集成pprof
对于Web服务,使用net/http/pprof包可以轻松添加性能分析端点:
// profile_http.go
package main

import (
    "log"
    "net/http"
    _ "net/http/pprof" // 只需导入即可,会自动注册handler
)

func main() {
    // 添加你的正常HTTP路由
    http.HandleFunc("/", func(w http.ResponseWriter, r *http.Request) {
        w.Write([]byte("Hello, World!"))
    })

    // pprof已在导入时自动注册了以下路径:
    // /debug/pprof/
    // /debug/pprof/cmdline
    // /debug/pprof/profile
    // /debug/pprof/symbol
    // /debug/pprof/trace
    // /debug/pprof/heap 等

    log.Println("服务启动在 :8080,pprof可通过 /debug/pprof 访问")
    log.Fatal(http.ListenAndServe(":8080", nil))
}
实战提示:在生产环境中,强烈建议将pprof端点绑定到内部管理端口,或增加访问控制,防止暴露敏感信息。
// 更安全的做法 - 将pprof绑定到单独的内部端口
go func() {
    log.Println("内部pprof服务启动在 :6060")
    log.Println(http.ListenAndServe("localhost:6060", nil))
}()
开发环境vs生产环境
pprof在不同环境下需要考虑不同的因素:
- 开发环境:可以使用更高的采样率获取更精确的数据
- 生产环境:需要平衡采样精度和性能影响,通常应该:
- 降低采样频率
- 限制profile数据大小
- 实现按需触发机制
- 确保数据安全传输
实时分析vs离线分析
pprof支持两种工作模式:
-
实时分析:直接连接到运行中的程序
go tool pprof http://localhost:8080/debug/pprof/heap -
离线分析:先保存profile数据,再进行分析
# 收集30秒的CPU profile
curl -o cpu.prof http://localhost:8080/debug/pprof/profile?seconds=30

# 稍后分析
go tool pprof cpu.prof
离线分析特别适合生产环境,能最小化对服务的影响,同时允许在问题发生后进行深入调查。
四、并发场景性能瓶颈分析实战
让我们通过三个典型案例,展示如何使用pprof解决并发程序中的常见性能问题。
案例1:协程泄漏分析与修复
问题症状
想象一下这样的场景:你的服务运行一段时间后,内存使用持续增长,系统逐渐变慢,但没有明显的内存分配激增。这很可能是协程泄漏的典型表现 —— 协程被创建后无法正常结束,导致资源无法释放。
问题定位
以下是一个简化的协程泄漏示例:
// goroutine_leak.go
package main

import (
    "log"
    "net/http"
    _ "net/http/pprof"
    "time"
)

func main() {
    // 启动pprof
    go func() {
        log.Println(http.ListenAndServe("localhost:6060", nil))
    }()

    // 模拟处理请求
    for i := 0; i < 10000; i++ {
        processRequest(i)
        time.Sleep(time.Millisecond * 100)
    }
}

func processRequest(reqID int) {
    // 为每个请求启动一个工作协程
    go func() {
        // 模拟从通道接收数据,但没有人发送
        ch := make(chan int)
        log.Printf("请求 #%d 处理中...\n", reqID)

        // 致命错误:没有timeout机制,永远阻塞
        val := <-ch
        log.Printf("请求 #%d 完成,结果: %d\n", reqID, val)
    }()
}
运行程序后,我们使用pprof查看goroutine情况:
go tool pprof http://localhost:6060/debug/pprof/goroutine
在交互式界面中输入top和list processRequest,会发现大量协程阻塞在通道接收操作上。
修复方案
修复协程泄漏的关键是确保每个goroutine都有正确的退出机制。常用的模式包括:
- 使用context控制生命周期
- 设置超时机制
- 使用关闭通道作为通知
下面是修复后的代码:
// goroutine_leak_fixed.go
func processRequest(reqID int) {
    // 创建带超时的上下文
    ctx, cancel := context.WithTimeout(context.Background(), 5*time.Second)
    defer cancel() // 确保在函数退出时取消,防止上下文泄漏

    go func() {
        ch := make(chan int)

        // 创建一个发送者(在实际情况中可能是其他协程或服务)
        go func() {
            // 模拟一些处理时间
            time.Sleep(time.Duration(rand.Intn(10)) * time.Second)

            // 尝试发送,但也可能因为超时而无人接收
            select {
            case ch <- 42:
            case <-ctx.Done():
                // 上下文已取消,不需要发送
                return
            }
        }()

        // 接收数据,但有超时保护
        select {
        case val := <-ch:
            log.Printf("请求 #%d 完成,结果: %d\n", reqID, val)
        case <-ctx.Done():
            log.Printf("请求 #%d 超时取消\n", reqID)
            return
        }
    }()
}
最佳实践:定期运行
go tool pprof -http=:8081 http://localhost:6060/debug/pprof/goroutine查看协程情况,特别注意长时间运行的协程数量是否持续增长。
案例2:锁竞争问题诊断
高并发场景下,锁竞争往往是性能杀手。当多个goroutine频繁争用同一把锁时,大部分时间会浪费在等待上。
问题定位
启用mutex profiling需要先设置采样率:
// lock_contention.go
package main

import (
    "log"
    "net/http"
    _ "net/http/pprof"
    "runtime"
    "sync"
)

func init() {
    // 开启mutex profiling,默认关闭
    runtime.SetMutexProfileFraction(1) // 1表示记录所有事件
}

func main() {
    // 启动pprof服务
    go func() {
        log.Println(http.ListenAndServe("localhost:6060", nil))
    }()

    // 共享资源
    counter := 0
    var mu sync.Mutex

    // 创建多个goroutine争用锁
    var wg sync.WaitGroup
    for i := 0; i < 100; i++ {
        wg.Add(1)
        go func() {
            defer wg.Done()

            // 每个goroutine增加计数器1000次
            for j := 0; j < 1000; j++ {
                mu.Lock()
                counter++
                mu.Unlock()
            }
        }()
    }

    wg.Wait()
    log.Printf("最终计数: %d\n", counter)
}
运行程序,然后分析mutex profile:
go tool pprof http://localhost:6060/debug/pprof/mutex
优化策略
锁优化的基本策略是"减少锁的粒度,减少锁的持有时间"。主要方法包括:
- 分段锁:将单一锁拆分为多个锁,每个锁负责部分数据
- 读写锁分离:对于读多写少的场景,使用
sync.RWMutex - 无锁数据结构:使用原子操作或无锁数据结构替代mutex
- 局部计算后批量更新:减少锁内的计算时间
优化示例
// lock_contention_fixed.go
func main() {
    // ...前面部分相同

    // 方案1:使用原子操作替代锁
    var counter int64 = 0

    var wg sync.WaitGroup
    for i := 0; i < 100; i++ {
        wg.Add(1)
        go func() {
            defer wg.Done()

            // 使用原子操作
            for j := 0; j < 1000; j++ {
                atomic.AddInt64(&counter, 1)
            }
        }()
    }

    wg.Wait()
    log.Printf("最终计数: %d\n", counter)

    // 方案2:使用分段锁(适用于更复杂的场景)
    const segments = 16
    var counters [segments]int
    var mutexes [segments]sync.Mutex

    for i := 0; i < 100; i++ {
        wg.Add(1)
        go func(id int) {
            defer wg.Done()

            // 使用协程ID决定使用哪个锁,减少冲突
            segmentID := id % segments
            localMutex := &mutexes[segmentID]
            localCounter := &counters[segmentID]

            for j := 0; j < 1000; j++ {
                localMutex.Lock()
                *localCounter++
                localMutex.Unlock()
            }
        }(i)
    }

    wg.Wait()

    // 计算总和
    total := 0
    for _, v := range counters {
        total += v
    }
    log.Printf("分段锁最终计数: %d\n", total)
}
性能差异可以通过benchmark测量,使用原子操作的版本通常比mutex快5-10倍,而分段锁在高并发下可以接近线性扩展。
案例3:内存分配优化
频繁的内存分配和GC是Go程序常见的性能瓶颈,特别是在高并发场景下。
问题定位
使用heap profile分析内存分配热点:
// memory_alloc.go
package main

import (
    "log"
    "net/http"
    _ "net/http/pprof"
    "strings"
)

func main() {
    // 启动pprof
    go func() {
        log.Println(http.ListenAndServe("localhost:6060", nil))
    }()

    // 模拟内存密集型工作
    for i := 0; i < 1000; i++ {
        processData(1000)
    }
}

func processData(size int) string {
    // 低效方式:频繁创建和连接字符串
    var result string
    for i := 0; i < size; i++ {
        // 每次迭代都创建新的字符串,非常低效
        result = result + "x"
    }
    return result
}
通过pprof分析内存分配情况:
go tool pprof -http=:8081 http://localhost:6060/debug/pprof/heap
在火焰图中,我们会看到processData函数占用了大量内存分配。
优化策略
内存优化的主要策略包括:
- 预分配内存:使用适当容量的slice或map
- 对象复用:使用对象池或缓存重用对象
- 减少内存逃逸:避免不必要的指针传递
- 使用高效的数据操作:如
strings.Builder替代+连接
优化示例
// memory_alloc_fixed.go
func processData(size int) string {
    // 高效方式:使用strings.Builder预分配内存
    var builder strings.Builder

    // 预先设置容量,避免多次扩容
    builder.Grow(size)

    for i := 0; i < size; i++ {
        builder.WriteByte('x')
    }

    return builder.String()
}

// 对于需要重复使用的对象,可以使用sync.Pool
var bufferPool = sync.Pool{
    New: func() interface{} {
        // 创建一个新的Buffer对象
        return new(bytes.Buffer)
    },
}

func processWithPool(data []byte) string {
    // 从对象池获取Buffer
    buf := bufferPool.Get().(*bytes.Buffer)
    // 确保归还到对象池
    defer func() {
        buf.Reset() // 清空但保留底层存储
        bufferPool.Put(buf)
    }()

    // 使用Buffer处理数据
    buf.Write(data)
    // 其他处理...

    return buf.String()
}
优化后,我们可以再次运行pprof,会发现内存分配显著减少,GC压力也随之降低。使用strings.Builder的版本比简单字符串连接快约10-100倍,具体取决于字符串长度。
五、高级pprof使用技巧
掌握了基础知识后,让我们探索一些高级技巧,帮助你更深入地分析性能问题。
火焰图(Flame Graph)解读与分析方法
火焰图是一种直观展示函数调用栈和资源使用情况的可视化方式,在pprof的web界面中已经内置支持。
go tool pprof -http=:8081 profile.pb.gz
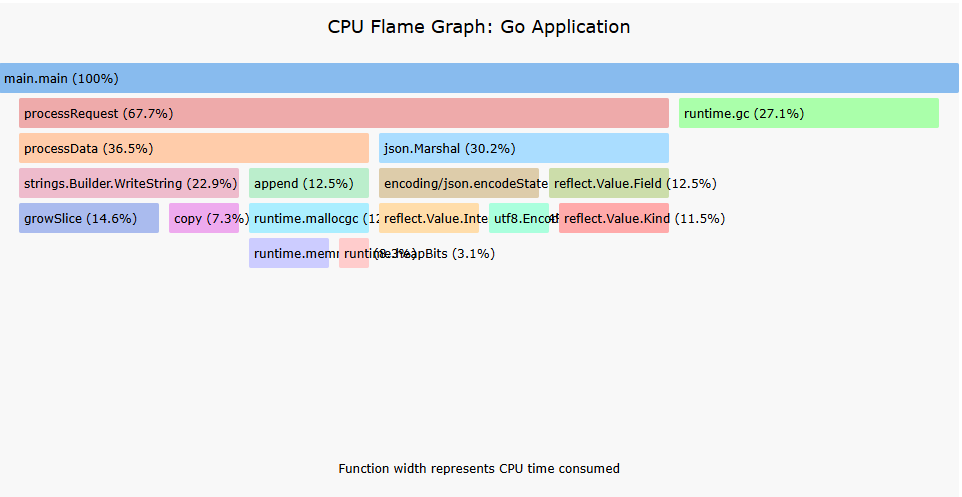
火焰图解读要点:
- 宽度表示耗时或资源占用比例
- 高度表示调用栈深度
- 颜色通常没有特殊含义(在pprof中通常表示函数所属包)
实战技巧:在火焰图中寻找"平顶山"(宽而不高的区块),它们往往是优化的关键点,表示大量时间花在某个单一函数中。
差异化分析:对比优化前后的性能变化
pprof支持对比两个profile文件,帮助你评估优化效果:
# 收集优化前的profile
go tool pprof -http=:8081 http://localhost:6060/debug/pprof/heap

# 进行优化...

# 收集优化后的profile
go tool pprof -http=:8082 http://localhost:6060/debug/pprof/heap

# 比较两个profile
go tool pprof -http=:8083 -base before.pb.gz after.pb.gz
差异图中,红色表示增加的部分,绿色表示减少的部分,帮助你直观地看到优化的效果和潜在的新问题。
自定义profile标签与上下文信息
pprof允许添加自定义标签,增强profile数据的上下文信息:
import "runtime/pprof"

// 使用标签为profile添加上下文
ctx := pprof.WithLabels(context.Background(), pprof.Labels("region", "us-west", "datacenter", "dc1"))
pprof.SetGoroutineLabels(ctx)

// 使用标签执行代码
pprof.Do(ctx, func() {
    // 此处的所有profiling数据都将带有上述标签
    processRequest()
})
这在复杂系统中特别有用,可以按业务逻辑、请求类型等维度分析性能数据。
与trace工具协同使用的策略
pprof和trace工具各有所长:
- pprof:提供长时间的聚合数据,找出热点
- trace:提供短时间的精确事件序列,分析并发行为
结合使用的最佳实践:
- 先用pprof找出热点函数
- 再用trace分析这些函数的并发行为和事件序列
# 收集trace数据
curl -o trace.out http://localhost:6060/debug/pprof/trace?seconds=5

# 分析trace
go tool trace trace.out
trace视图提供了详细的goroutine创建、阻塞和运行情况,以及网络事件、系统调用等信息,对分析短期性能尖峰特别有用。
六、实际项目经验分享
理论终究需要实践检验。以下是我在真实项目中的性能优化经验和教训。
高并发API服务优化经验
在一个处理每秒数千请求的API网关项目中,我们遇到了以下性能瓶颈和解决方案:
问题1:连接池耗尽
使用pprof的goroutine profile发现大量goroutine阻塞在连接获取上:
// 问题代码
func handleRequest(w http.ResponseWriter, r *http.Request) {
    // 每个请求都创建一个新的数据库连接
    db, err := sql.Open("postgres", connStr)
    if err != nil {
        http.Error(w, err.Error(), 500)
        return
    }
    defer db.Close()

    // 查询数据库...
}
解决方案:使用全局连接池,限制最大连接数,并加入超时机制:
// 全局连接池
var dbPool *sql.DB

func init() {
    var err error
    dbPool, err = sql.Open("postgres", connStr)
    if err != nil {
        log.Fatal(err)
    }

    // 设置连接池参数
    dbPool.SetMaxOpenConns(100)
    dbPool.SetMaxIdleConns(20)
    dbPool.SetConnMaxLifetime(30 * time.Minute)
}

func handleRequest(w http.ResponseWriter, r *http.Request) {
    // 使用带超时的上下文
    ctx, cancel := context.WithTimeout(r.Context(), 3*time.Second)
    defer cancel()

    // 使用连接池中的连接
    rows, err := dbPool.QueryContext(ctx, "SELECT * FROM users WHERE id = $1", userID)
    // ...
}
效果:服务稳定性显著提升,P99延迟从800ms降至120ms。
问题2:JSON序列化成为瓶颈
CPU profile显示json.Marshal占用了大量CPU时间:
type User struct {
    ID        int64  `json:"id"`
    Name      string `json:"name"`
    Email     string `json:"email"`
    // 包含数十个其他字段...
}

func handleUserRequest(w http.ResponseWriter, r *http.Request) {
    // 获取用户信息
    user := getUser(r.Context(), userID)

    // 序列化返回
    data, err := json.Marshal(user)
    if err != nil {
        http.Error(w, err.Error(), 500)
        return
    }

    w.Header().Set("Content-Type", "application/json")
    w.Write(data)
}
解决方案:使用更高效的JSON库,并实现字段过滤:
import "github.com/json-iterator/go"

var json = jsoniter.ConfigCompatibleWithStandardLibrary

func handleUserRequest(w http.ResponseWriter, r *http.Request) {
    // 获取用户信息
    user := getUser(r.Context(), userID)

    // 根据请求参数决定返回哪些字段
    fields := r.URL.Query().Get("fields")
    if fields != "" {
        // 只返回请求的字段
        filteredUser := filterUserFields(user, strings.Split(fields, ","))
        data, err := json.Marshal(filteredUser)
        // ...
    } else {
        // 全部返回
        data, err := json.Marshal(user)
        // ...
    }
}
效果:JSON序列化时间减少70%,整体API延迟减少35%。
大数据处理场景的内存优化
在一个批量处理日志数据的项目中,我们面临内存使用过高导致频繁GC的问题:
问题:一次性加载所有数据进内存处理
func processLogs(filePath string) error {
    // 读取整个文件到内存
    data, err := ioutil.ReadFile(filePath)
    if err != nil {
        return err
    }

    // 解析所有日志行
    logs := parseLogLines(data)

    // 处理日志
    results := make([]LogResult, 0, len(logs))
    for _, log := range logs {
        result := processLog(log)
        results = append(results, result)
    }

    // 保存结果
    return saveResults(results)
}
解决方案:使用流式处理,逐行读取和处理:
func processLogs(filePath string) error {
    // 打开文件进行流式读取
    file, err := os.Open(filePath)
    if err != nil {
        return err
    }
    defer file.Close()

    // 创建scanner,缓冲区大小8MB
    scanner := bufio.NewScanner(file)
    buf := make([]byte, 8*1024*1024)
    scanner.Buffer(buf, 8*1024*1024)

    // 创建结果写入器
    resultWriter, err := createResultWriter("results.out")
    if err != nil {
        return err
    }
    defer resultWriter.Close()

    // 逐行处理
    for scanner.Scan() {
        line := scanner.Text()
        log := parseSingleLog(line)
        result := processLog(log)

        // 立即写出结果,不保存在内存中
        if err := resultWriter.Write(result); err != nil {
            return err
        }
    }

    return scanner.Err()
}
效果:内存使用从峰值12GB降至稳定200MB,程序从无法处理大文件变成可以处理任意大小的文件。
踩过的坑与解决方案
坑1:采样数据失真问题
在一个CPU密集型服务中,pprof报告的热点与实际不符。原因:默认的采样率(100Hz)对于快速执行的函数不够精确。
解决方案:调整CPU profile的采样率:
// 增加CPU profile的采样频率
runtime.SetCPUProfileRate(1000) // 1000Hz,默认是100Hz
注意:更高的采样率会增加开销,不建议在生产环境长期使用高采样率。
坑2:生产环境安全采集的问题
在生产环境开启pprof可能导致敏感信息泄露或性能下降。
解决方案:实现按需激活的pprof控制:
package main

import (
    "expvar"
    "log"
    "net/http"
    "net/http/pprof"
    "os"
    "os/signal"
    "runtime"
    "syscall"
    "time"
)

func main() {
    // 默认不启用详细profiling
    runtime.SetBlockProfileRate(0)
    runtime.SetMutexProfileFraction(0)

    // 创建管理专用路由
    mux := http.NewServeMux()

    // 添加控制端点
    expvar.Publish("profiling", expvar.Func(func() interface{} {
        return map[string]interface{}{
            "block_profile_rate":     runtime.SetBlockProfileRate(-1),
            "mutex_profile_fraction": runtime.SetMutexProfileFraction(-1),
        }
    }))

    // 注册pprof端点,但使用自定义控制
    mux.HandleFunc("/debug/pprof/", pprof.Index)
    mux.HandleFunc("/debug/pprof/cmdline", pprof.Cmdline)
    mux.HandleFunc("/debug/pprof/profile", pprof.Profile)
    mux.HandleFunc("/debug/pprof/symbol", pprof.Symbol)
    mux.HandleFunc("/debug/pprof/trace", pprof.Trace)

    // 添加动态启用profiling的端点
    mux.HandleFunc("/debug/pprof/enable", func(w http.ResponseWriter, r *http.Request) {
        // 验证特殊认证头(实际项目中应使用更安全的认证)
        if r.Header.Get("X-Admin-Token") != os.Getenv("ADMIN_TOKEN") {
            http.Error(w, "Unauthorized", http.StatusUnauthorized)
            return
        }

        // 获取参数
        duration := r.URL.Query().Get("duration")
        d, err := time.ParseDuration(duration)
        if err != nil || d <= 0 || d > 5*time.Minute {
            d = 1 * time.Minute // 默认1分钟
        }

        // 启用详细profiling
        runtime.SetBlockProfileRate(1)
        runtime.SetMutexProfileFraction(1)

        // 设置定时器自动关闭
        go func() {
            time.Sleep(d)
            runtime.SetBlockProfileRate(0)
            runtime.SetMutexProfileFraction(0)
            log.Printf("详细profiling已自动关闭")
        }()

        w.Write([]byte("详细profiling已启用,将在 " + d.String() + " 后自动关闭"))
    })

    // 启动管理服务
    go func() {
        log.Println("管理服务启动在 localhost:8081")
        log.Fatal(http.ListenAndServe("localhost:8081", mux))
    }()

    // 主服务逻辑...
}
这种方式可以在需要时临时开启高采样率的profiling,使用完自动关闭,最大限度减少对生产环境的影响。
七、pprof在CI/CD中的应用
将性能分析融入开发流程,可以在问题进入生产环境前就将其拦截。以下是一些在CI/CD流程中集成pprof的最佳实践。
自动化性能基准测试
在CI流程中添加基准测试步骤,自动收集pprof数据:
// benchmark_test.go
package main

import (
    "os"
    "runtime/pprof"
    "testing"
)

func BenchmarkUserService(b *testing.B) {
    // 设置CPU profile
    cpuFile, err := os.Create("cpu.prof")
    if err != nil {
        b.Fatal(err)
    }
    defer cpuFile.Close()

    if err := pprof.StartCPUProfile(cpuFile); err != nil {
        b.Fatal(err)
    }
    defer pprof.StopCPUProfile()

    // 设置内存profile
    memFile, err := os.Create("mem.prof")
    if err != nil {
        b.Fatal(err)
    }
    defer memFile.Close()

    // 实际基准测试
    b.ResetTimer()
    for i := 0; i < b.N; i++ {
        // 调用被测试的函数
        processUserRequest()
    }

    // 写入内存profile
    if err := pprof.WriteHeapProfile(memFile); err != nil {
        b.Fatal(err)
    }
}
在CI配置中:
# .github/workflows/benchmark.yml
name: Performance Benchmark

on:
  push:
    branches: [ main ]
  pull_request:
    branches: [ main ]

jobs:
  benchmark:
    runs-on: ubuntu-latest
    steps:
    - uses: actions/checkout@v2

    - name: Set up Go
      uses: actions/setup-go@v2
      with:
        go-version: 1.19

    - name: Run benchmarks
      run: go test -bench=. -benchmem -run=^$ ./... -timeout 30m

    - name: Collect profiles
      run: |
        go test -bench=UserService -benchmem -cpuprofile=cpu.prof -memprofile=mem.prof ./...

    - name: Archive performance artifacts
      uses: actions/upload-artifact@v2
      with:
        name: performance-profiles
        path: |
          *.prof
性能回归检测
比较新代码与基线代码的性能差异,自动标记性能下降:
// 使用benchstat比较结果
// 安装benchstat: go install golang.org/x/perf/cmd/benchstat@latest

# 在CI脚本中
git checkout main
go test -bench=. -count=5 -run=^$ ./... > old.txt
git checkout $PR_BRANCH
go test -bench=. -count=5 -run=^$ ./... > new.txt
benchstat old.txt new.txt

# 检查结果,如果性能下降超过阈值,测试失败
if [[ $(benchstat old.txt new.txt | grep -c "+") -gt 0 ]]; then
    echo "Performance regression detected!"
    exit 1
fi
团队协作中的性能文化建设
建立性能意识文化的关键实践:
- 性能预算:为关键路径设定性能指标上限
- 性能检查点:在代码审查流程中加入性能检查
- 性能展示板:实时展示关键性能指标
- 性能回顾会:定期分析性能数据,讨论改进
性能数据可视化与报告生成
使用pprof数据自动生成性能报告:
#!/bin/bash
# generate_perf_report.sh
# 生成CPU profile报告
echo "## CPU Profile" > perf_report.md
echo '```' >> perf_report.md
go tool pprof -top cpu.prof >> perf_report.md
echo '```' >> perf_report.md
# 生成内存profile报告
echo "## Memory Profile" >> perf_report.md
echo '```' >> perf_report.md
go tool pprof -top mem.prof >> perf_report.md
echo '```' >> perf_report.md
# 生成火焰图
go tool pprof -svg cpu.prof > cpu_flame.svg
go tool pprof -svg mem.prof > mem_flame.svg
echo "## CPU Flame Graph" >> perf_report.md
echo "" >> perf_report.md
echo "## Memory Flame Graph" >> perf_report.md
echo "" >> perf_report.md
# 添加基准测试结果
echo "## Benchmark Results" >> perf_report.md
echo '```' >> perf_report.md
cat benchmark_results.txt >> perf_report.md
echo '```' >> perf_report.md
# 加入性能变化对比
echo "## Performance Changes" >> perf_report.md
echo '```' >> perf_report.md
benchstat old.txt new.txt >> perf_report.md
echo '```' >> perf_report.md
这样的报告可以作为Pull Request的一部分,帮助团队成员了解代码变更对性能的影响。
八、总结与展望
通过本文的探索,我们深入了解了如何使用pprof分析和优化Go并发程序的性能瓶颈。
关键技术点回顾
- pprof工具链:提供了CPU、内存、goroutine、互斥锁等多维度分析能力
- 数据收集方式:既可以通过HTTP接口收集,也可以写入文件离线分析
- 分析方法:从火焰图定位热点,到优化具体代码实现
- 常见优化模式:
- 协程管理:正确使用context控制生命周期
- 锁竞争:降低粒度,缩短持有时间
- 内存分配:预分配,对象复用,减少GC压力
pprof的局限性与替代工具
虽然pprof功能强大,但也有一些局限性:
- 采样机制导致的精度问题:很快完成的函数可能被低估
- 缺乏分布式场景的原生支持
- 无法直观展示时间序列上的事件关系
一些值得关注的补充工具:
- go-torch:提供更丰富的火焰图功能
- golang/perf:更强大的性能分析包
- Jaeger/Zipkin:分布式追踪,适合微服务架构
- Prometheus:实时监控,可与pprof数据结合分析
持续学习性能优化的资源
要成为性能优化专家,可以关注这些资源:
- 官方文档:pprof文档
- 演讲视频:GopherCon的性能相关演讲
- 书籍:《Go性能编程》、《Systems Performance》
- 博客:Dave Cheney的性能文章、Go官方博客
未来Go性能分析工具的发展趋势
Go性能工具正在几个方向上发展:
- 持续监控:将pprof数据与监控系统集成
- 机器学习辅助:自动发现异常模式和优化机会
- 更精细的上下文:捕获更多调用信息和业务上下文
- 低开销追踪:减少生产环境观测的性能影响
最重要的是,性能优化不仅仅是工具的使用,更是一种工程思维。它需要我们建立基准、度量影响、验证假设、迭代优化。通过这种方法论,结合pprof这样强大的工具,我们能够构建出既高效又可靠的Go并发程序。
附录:实用资源与工具推荐
pprof学习资料
辅助分析工具
- go-torch:https://github.com/uber/go-torch
- go-perfbook:https://github.com/dgryski/go-perfbook
- benchstat:golang.org/x/perf/cmd/benchstat
- hey:https://github.com/rakyll/hey (HTTP负载测试)
社区讨论与文章
上述资源涵盖了从入门到精通的各个层次,可以根据自己的水平选择适合的内容深入学习。结合本文的实战经验,相信你已经具备了在实际项目中应用pprof分析并优化Go并发程序性能的能力。
记住,性能优化是一场永无止境的旅程,持续学习和实践是成为专家的唯一途径。祝你在Go并发性能优化的道路上取得更大的成就!


 1287
1287

 被折叠的 条评论
为什么被折叠?
被折叠的 条评论
为什么被折叠?
 到【灌水乐园】发言


