Seaborn使用说明

python作图已成为数据分析中不可或缺的手段,常使用的包为matplotlib,它被很多其它包所依赖,例如pandas中具有的绘图功能就是对matplotlib的API的二次封装使用,今天要说明的seaborn包则提供了一种新的绘图功能,其简单易行的封装功能带来更为强大和美观的绘图效果,现简要说明该包[功能],主要分为三大类:(http://web.stanford.edu/~mwaskom/software/seaborn/tutorial.html)

风格管理

该部分提供的是关于绘图板风格及调色板颜色的设置,用户可以自行控制绘图界面。

  • Controlling figure aesthetics(界面风格)

Styling figures with axes_style() and set_style()
Removing spines with despine()
Temporarily setting figure style
Overriding elements of the seaborn styles
Scaling plot elements with plotting_context() and set_context()

  • Choosing color palettes(调色板)

Building color palettes with color_palette()
Qualitative color palettes
Sequential color palettes
Diverging color palettes
Changing default palettes with set_palette()

绘图函数

该部分主要提供三种方向使用的功能函数,分别是用于做分布图,线性图及分类图的,其中分类图中提供了小提琴等新颖的可视化方法。

  • Visualizing the distribution of a dataset

Plotting univariate distributions
Plotting bivariate distributions
Visualizing pairwise relationships in a dataset

  • Visualizing linear relationships

Functions to draw linear regression models
Fitting different kinds of models
Conditioning on other variables
Controlling the size and shape of the plot
Plotting a regression in other contexts

  • Plotting with categorical data

Distributions of observations within categories
Statistical estimation within categories
Drawing multi-panel categorical plots

其中在对DataFrame支持的散点作图中,提供了pariplot()方法,直接实现两两变量间的散点分布图,也可利用g=PairGrid(data)实现对该种网格的定制化输出。

网格绘图

该部分实质上跟前面部分有重合,但其中有个FacetGrid的绘图方法,其余PairGrid有类似之处。

  • Plotting on data-aware grids

Subsetting data with FacetGrid
Plotting pairwise relationships with PairGrid and pairplot()

import numpy as np
import pandas as pd
import seaborn as sns
from scipy import stats
import matplotlib as mpl
import matplotlib.pyplot as plt
tips = sns.load_dataset("tips")
g = sns.FacetGrid(tips, col="sex", hue="smoker")
g.map(plt.scatter, "total_bill", "tip", alpha=.7)
g.add_legend();

这里写图片描述

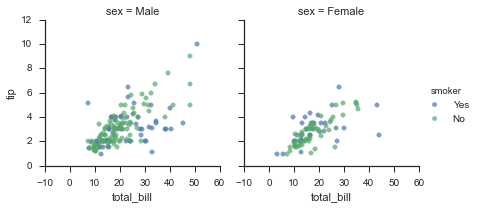
ps:还有kdeplot(),heatmap(),clustermap(),jointplot()等函数高效实现绘图功能等

  • 0
    点赞
  • 1
    收藏
    觉得还不错? 一键收藏
  • 0
    评论
1. 目录 1. 目录 2 2. 绘图函数Plotting functions 4 2.1. 可视化的统计关系Visualizing statistical relationships 4 2.1.1. 用散点图联系变量Relating variables with scatter plots 4 2.1.2. 强调线条图的连续性Emphasizing continuity with line plots 10 2.1.3. 显示与切面的多个关系Showing multiple relationships with facets 21 2.2. 分类数据绘图Plotting with categorical data 24 2.2.1. 分类散点图Categorical scatterplots 26 2.2.2. 分类观测值分布Distributions of observations within categories 31 2.2.3. 分类统计估计Statistical estimation within categories 37 2.2.4. 对“wide-form”数据作图Plotting “wide-form” data 41 2.2.5. 显示与facet的多个关系Showing multiple relationships with facets 43 2.3. 可视化数据集的分布Visualizing the distribution of a dataset 44 2.3.1. 绘制单变量分布Plotting univariate distributions 45 2.3.2. 绘制二元分布Plotting bivariate distributions 51 2.3.3. 在数据集中可视化成对关系Visualizing pairwise relationships in a dataset 55 2.4. 可视化线性关系Visualizing linear relationships 57 2.4.1. 函数绘制线性模型Functions to draw linear regression models 58 2.4.2. 拟合不同种类的模型Fitting different kinds of models 61 2.4.3. 在其他变量上的情况Conditioning on other variables 68 2.4.4. 控制图表的大小和形状Controlling the size and shape of the plot 71 2.4.5. 在其他上下文中绘制回归图Plotting a regression in other contexts 73 3. 多图网格Multi-plot grids 76 3.1. 构建结构化的多图网格Building structured multi-plot grids 76 3.2. 有条件的小倍数Conditional small multiples 77 3.3. 使用定制函数Using custom functions 86 3.4. 绘制成对的数据关系Plotting pairwise data relationships 90 4. 绘图美学Plot aesthetics 99 4.1. 控制图表美学Controlling figure aesthetics 99 4.1.1. Seaborn图表风格Seaborn figure styles 101 4.1.2. 删除轴上的小凸起Removing axes spines 104 4.1.3. 临时设置图表样式Temporarily setting figure style 105 4.1.4. 覆盖Seaborn样式的元素Overriding elements of the seaborn styles 106 4.1.5. 缩放图表元素Scaling plot elements 108 4.2. 选择调色板Choosing color palettes 111 4.2.1. 创建颜色调色板Building color palettes 111 4.2.2. 定性调色板Qualitative color palettes 112 4.2.3. 连续调色板Sequential color palettes 116 4.2.4. 不同颜色的调色板Diverging color palettes 122 4.2.5. 设置默认调色板Setting the default color palette 124 5. 教程中的数据集 125

“相关推荐”对你有帮助么?

  • 非常没帮助
  • 没帮助
  • 一般
  • 有帮助
  • 非常有帮助
提交
评论
添加红包

请填写红包祝福语或标题

红包个数最小为10个

红包金额最低5元

当前余额3.43前往充值 >
需支付:10.00
成就一亿技术人!
领取后你会自动成为博主和红包主的粉丝 规则
hope_wisdom
发出的红包
实付
使用余额支付
点击重新获取
扫码支付
钱包余额 0

抵扣说明:

1.余额是钱包充值的虚拟货币,按照1:1的比例进行支付金额的抵扣。
2.余额无法直接购买下载,可以购买VIP、付费专栏及课程。

余额充值