


 本文详述了一次应用跑批job卡住的排查过程,问题根源在于存储过程中的函数逻辑设计不当,遇到空值时导致死循环。通过分析SQL执行情况、使用dbms_profiler等工具,最终定位到函数内的loop循环因未处理null值而无限循环,修复方案是修改代码逻辑,增加对空值的判断处理。
前言:
近期处理了一起应用每日跑批job突然卡住的问题,与之前处理过的job跑批变慢不同,此次的job卡住不是性能问题,而是job的存储过程代码逻辑设计不合理所导致。
问题:
应用每日跑批job突然卡住。
原因:
job所调用的存储过程代码逻辑设计不合理,没有对空值进行处理,导致遇到空值null数据,进入loop死循环。
问题修复:
应用修改代码逻辑,对空值进行处理,修复问题。
分析过程:
首先,接到应用反馈job执行卡住问题之后,我们需要定位到具体的SQL语句,由于应用自己也不知道具体的卡住SQL语句,我们只能从数据库层面里面去确认问题时间段的高消耗SQL。
通过获取job执行时间段awr里面的高消耗SQL,我们将问题sql定位到了一条insert ...select 语句,平均的执行1663秒以上。
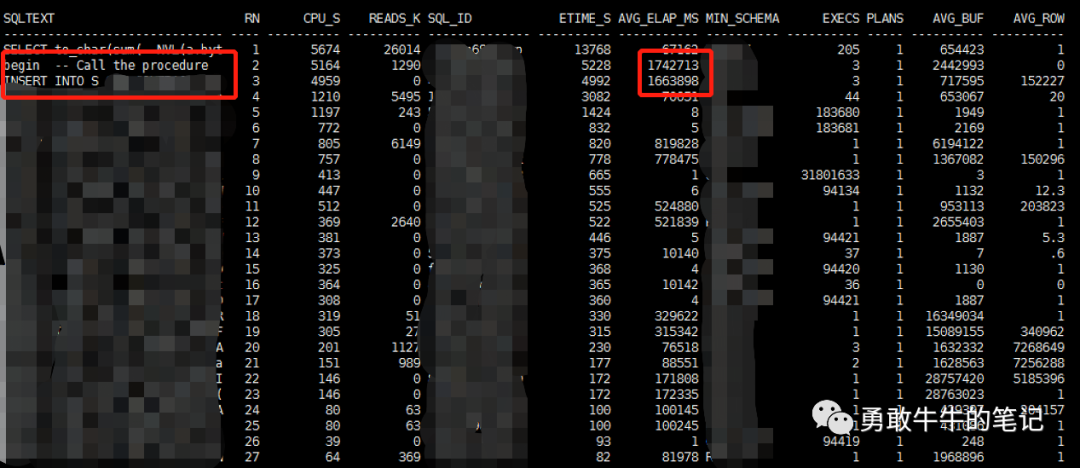
之后,我们将捕获到的SQL发给应用,进行确认是不是job里面的SQL,得到应用的进一步确认之后,我们锁定了具体的SQL语句sql_id:393a80x2yuajd。
注:本文的SQL都是脱敏后的测试SQL或者伪代码,只为了演示,不涉及真实的生产信息。
SQL为insert into ...select * from ....插入语句,并且调用了函数test.pack_test.reture_irr(object_id,DATA_OBJECT_ID)
sql_id:393a80x2yuajd
sql_text:insert into test.pack_test_total select test.pack_test.reture_irr(object_id,DATA_OBJECT_ID) from test.input_tab where created='';
语句执行计划:
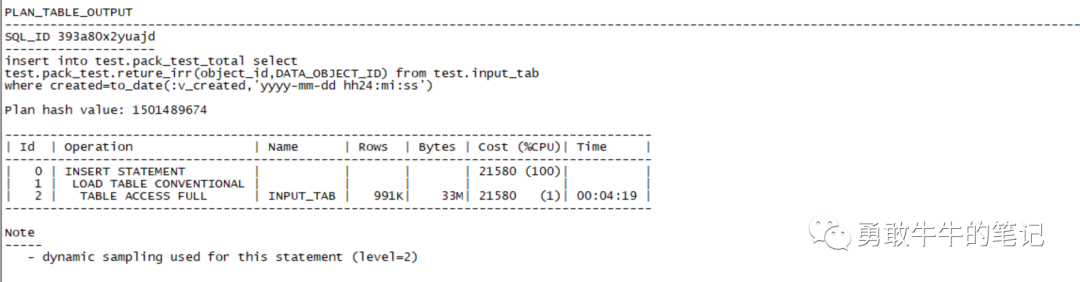
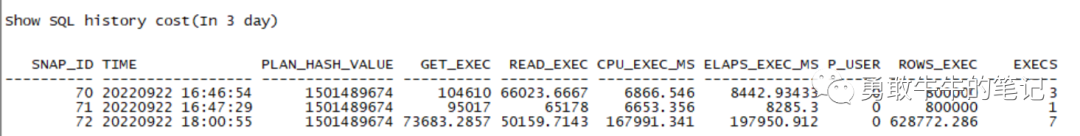
查看语句的执行历史,可以发现语句的执行计划没有发生变化PLAN_HASH_VALUE都是1501489674,逻辑读(GET_EXEC),物理读(READ_EXEC),执行行数(ROWS_EXEC)也没有发生明显的变化,但平均的执行时间(ELAPS_EXEC_MS)发生了明显的增长,正常的完成时间平均在8秒,而最近的平均执行时间为167秒(167991ms),并且这个执行时间还是job还没有跑批完成的时间。
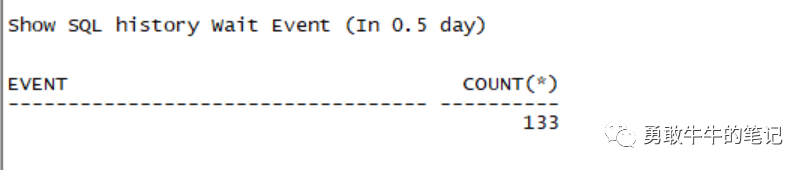
查看语句的历史等待事件event,并没有出现被锁堵塞的情况。
通过上述的信息,我们可以确认job卡住不是性能问题导致,而是可能调用的函数函数test.pack_test.reture_irr里面出现了问题导致。
接下来,我们尝试通过10046去跟踪sql的执行情况,看能不能发现具体的问题点。
oradebug setmypid
oradebug unlimit;
oradebug event 10046 trace name context forever, level 12;
variable v_created varchar2(50);
exec :v_created :='2022-09-22 00:00:00';
insert into test.pack_test_total select test.pack_test.reture_irr(object_id,DATA_OBJECT_ID) from test.input_tab where created=to_date(:v_created,'yyyy-mm-dd hh24:mi:ss');
oradebug event 10046 trace name context off;
oradebug tracefile_name
格式化生成的10046的trc文件。
tkprof dbocs1_ora_26032.trc tkprof_26032.trc sys=no sort=prsela,exeela,fchela从10046的trc文件,我们并没有发现具体卡住的SQL代码,从这信息我们也可以排除函数里面的SQL出现问题的可能,应该是函数代码的逻辑问题导致。
TKPROF: Release 11.2.0.4.0 - Development on Thu Sep 22 22:24:29 2022

Copyright (c) 1982, 2011, Oracle and/or its affiliates.  All rights reserved.

Trace file: dbocs1_ora_26032.trc
Sort options: prsela  exeela  fchela
********************************************************************************
count    = number of times OCI procedure was executed
cpu      = cpu time in seconds executing
elapsed  = elapsed time in seconds executing
disk     = number of physical reads of buffers from disk
query    = number of buffers gotten for consistent read
current  = number of buffers gotten in current mode (usually for update)
rows     = number of rows processed by the fetch or execute call


********************************************************************************

OVERALL TOTALS FOR ALL NON-RECURSIVE STATEMENTS

call     count       cpu    elapsed       disk      query    current        rows
------- ------  -------- ---------- ---------- ---------- ----------  ----------
Parse        2      0.00       0.00          0          0          0           0
Execute      2    129.74     141.23      50992      68698      11949      699677
Fetch        0      0.00       0.00          0          0          0           0
------- ------  -------- ---------- ---------- ---------- ----------  ----------
total        4    129.74     141.23      50992      68698      11949      699677

Misses in library cache during parse: 0

Elapsed times include waiting on following events:
  Event waited on                             Times   Max. Wait  Total Waited
  ----------------------------------------   Waited  ----------  ------------
  SQL*Net message to client                       3        0.00          0.00
  SQL*Net message from client                     3       22.32         22.33
  Disk file operations I/O                        4        0.00          0.00
  db file sequential read                        69        0.00          0.03
  db file scattered read                        455        0.00          0.52
  resmgr:cpu quantum                              4        0.01          0.02
  SQL*Net break/reset to client                   1        0.00          0.00


OVERALL TOTALS FOR ALL RECURSIVE STATEMENTS

call     count       cpu    elapsed       disk      query    current        rows
------- ------  -------- ---------- ---------- ---------- ----------  ----------
Parse        0      0.00       0.00          0          0          0           0
Execute      0      0.00       0.00          0          0          0           0
Fetch        0      0.00       0.00          0          0          0           0
------- ------  -------- ---------- ---------- ---------- ----------  ----------
total        0      0.00       0.00          0          0          0           0

Misses in library cache during parse: 0

    2  user  SQL statements in session.
    0  internal SQL statements in session.
    2  SQL statements in session.
********************************************************************************
Trace file: dbocs1_ora_26032.trc
Trace file compatibility: 11.1.0.7
Sort options: prsela  exeela  fchela
       1  session in tracefile.
       2  user  SQL statements in trace file.
       0  internal SQL statements in trace file.
       2  SQL statements in trace file.
       2  unique SQL statements in trace file.
     800  lines in trace file.
     141  elapsed seconds in trace file.
接下来,我们使用dbms_profiler来跟踪函数的执行情况。
注:dbms_profiler是Oracle专门用于分析存储过程中的各段代码的时间开销情况,从而快速找到性能瓶颈的工具。
set serveroutput on
declare
err number;
rcomment varchar2(100);
begin

    rcomment := to_char(sysdate,'YYYY-MM-DD hh24:mi:ss');
    err := dbms_profiler.start_profiler(rcomment);
    execute immediate 'insert into test.pack_test_total select test.pack_test.reture_irr(object_id,DATA_OBJECT_ID) from test.input_tab where created=to_date(:1,''yyyy-mm-dd hh24:mi:ss'')' using '2022-09-22 00:00:00';
    err := dbms_profiler.stop_profiler;
    dbms_output.put_line(rcomment);
  end;
/
---执行一定时间后,手动取消执行
---再执行结束分析
declare
err number;
rcomment varchar2(100);
begin
err := dbms_profiler.stop_profiler;
dbms_output.put_line(rcomment);
end;
/
查看dbms_profiler的分析内容
SELECT d.line#,
              s.text,
              d.total_time,
              d.total_occur,
              d.min_time,
              d.max_time
         FROM
       PLSQL_PROFILER_RUNS A,
       plsql_profiler_data d,
      sys.all_source s,
      plsql_profiler_units u
        WHERE  u.unit_name = 'PACK_TEST'
        AND A.RUN_COMMENT > '2022-09-22 20:00:00'
          AND A.RUNID = u.RUNID
      AND A.RUNID = d.RUNID
      AND u.runid = d.runid
          AND d.unit_number = u.unit_number
          AND d.total_occur <> 0
          AND s.TYPE(+) = u.unit_type
          AND s.owner(+) = u.unit_owner
          AND s.name(+) = u.unit_name
          AND d.line# = NVL(s.line, d.line#)
      ORDER BY TOTAL_OCCUR, TOTAL_TIME;
在函数代码的第10,11行出现了访问的热点,出现loop的关键字样,很有可能是出现了死循环问题。
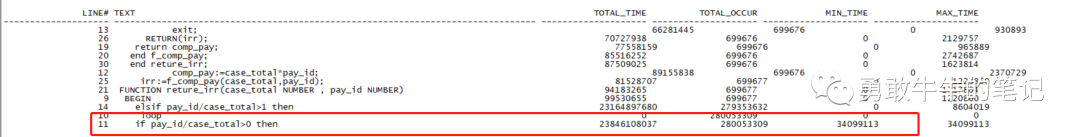
查看函数的伪代码,可以发现在第10,11行有一个loop循环,退出循环的条件为pay_id/case_total>0 或者pay_id/case_total>1
CREATE OR REPLACE PACKAGE BODY test.pack_test AS
 PROCEDURE error_log(insert_date date, v_code NUMBER,v_msg varchar2) IS
   BEGIN
      insert  into test.pack_log  values(insert_date,v_code,v_msg);
    commit;
   END error_log;
 FUNCTION f_comp_pay(case_total NUMBER , pay_id NUMBER)
    RETURN NUMBER IS comp_pay NUMBER;
  BEGIN
     loop  ----访问热点
   if pay_id/case_total>0 then  ----访问热点
    comp_pay:=case_total*pay_id;
    exit;
   elsif pay_id/case_total>1 then
    comp_pay:=1;
    exit;
   end if;
   end loop;
   return comp_pay;
   end f_comp_pay;
 FUNCTION reture_irr(case_total NUMBER , pay_id NUMBER)
    RETURN NUMBER IS irr NUMBER;
  check_pay number;
  BEGIN
    irr:=f_comp_pay(case_total,pay_id);
      RETURN(irr);
   exception
    when others then
    null;
   end reture_irr;
END;
/
接下来,我们查看pay_id的数值分布,可以发现pay_id里面包含了87416个null值
select DATA_OBJECT_ID as pay_id,count(*) from test.input_tab group by DATA_OBJECT_ID order by 1 desc nulls last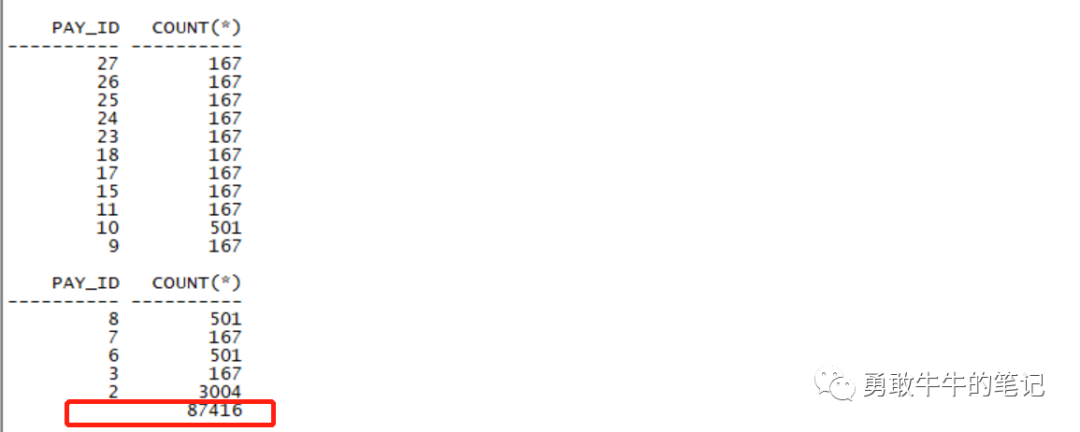
而pay_id这些null值,其实是不满足条件pay_id/case_total>0 或者pay_id/case_total>1 ,所以会导致调用函数时无法退出loop循环,导致出现死循环的问题。
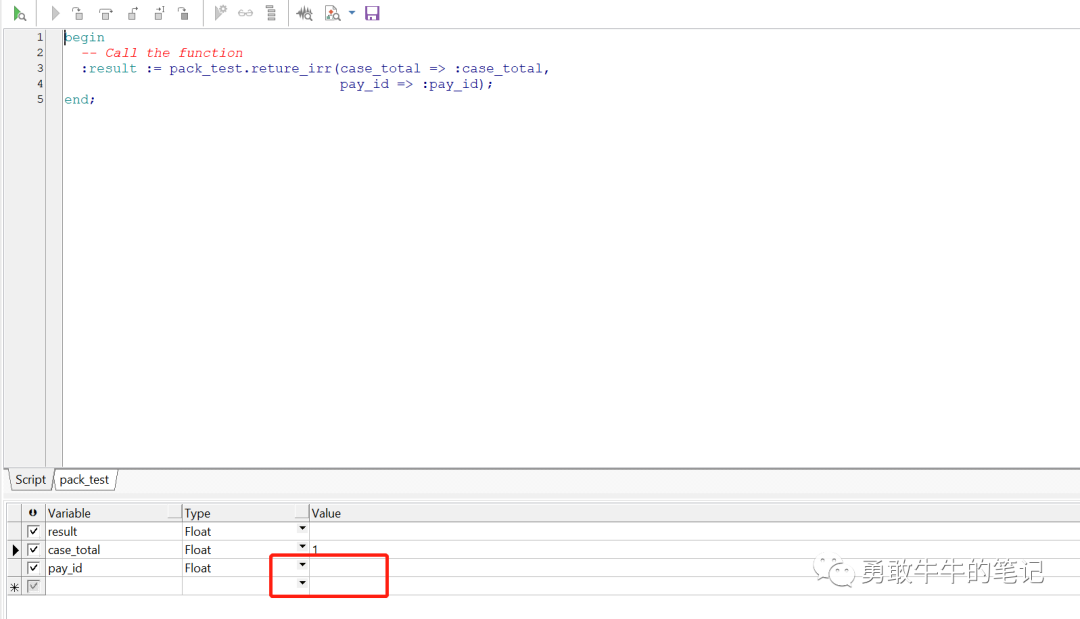
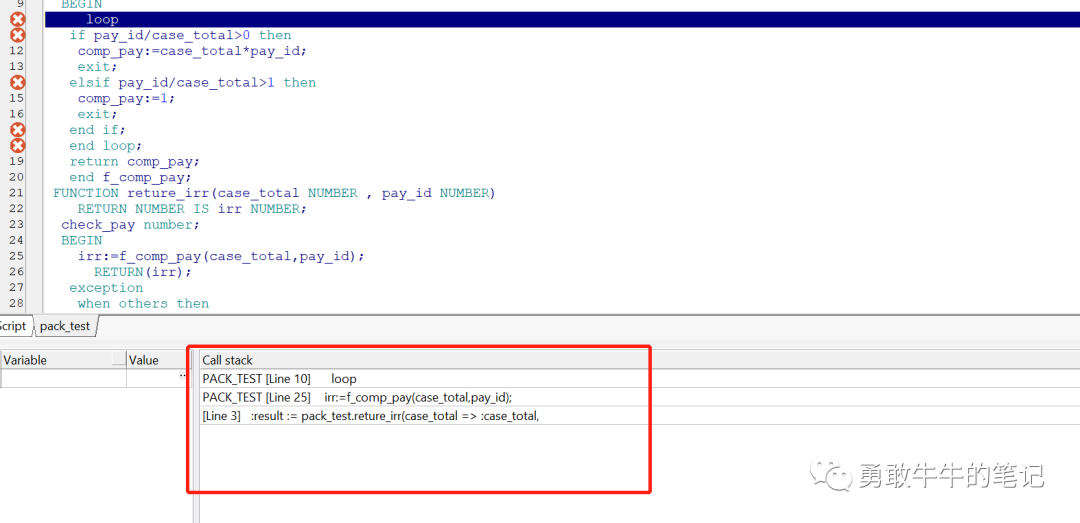
为了进一步验证我们的猜想,我们通过PL/SQL Developer对行数进行debug测试
在函数loop 位置打断点。
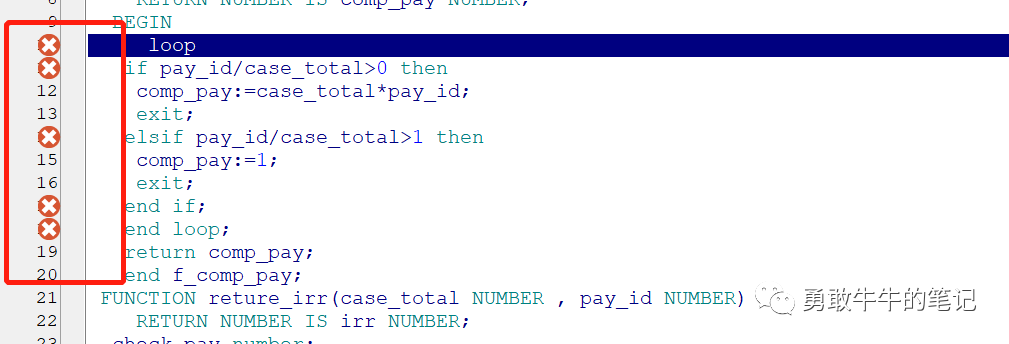
输入pay_id为空值null参数进行验证。
可以看到,代码在进入到LOOP循环之后,由于没有满足条件退出循环,出现了死循环的问题。
总结:
由于函数的SQL代码逻辑问题,没有对pay_id的空值null进行判断处理,导致程序出现了死循环的问题,后续让应用修改了代码逻辑,对空值进行处理,修复了该问题。


 被折叠的 条评论
为什么被折叠?
被折叠的 条评论
为什么被折叠?
 到【灌水乐园】发言


