


1 matplotlib绘制3D图形
matplotlib可以绘制3D图形,有的版本中不具备该模块,可以进入python环境,输入from mpl_toolkits.mplot3d import Axes3D进行测试,如果导入成功则可以,否则需要安装matplotlib其他版本,这里我用的是2.0.2版本。
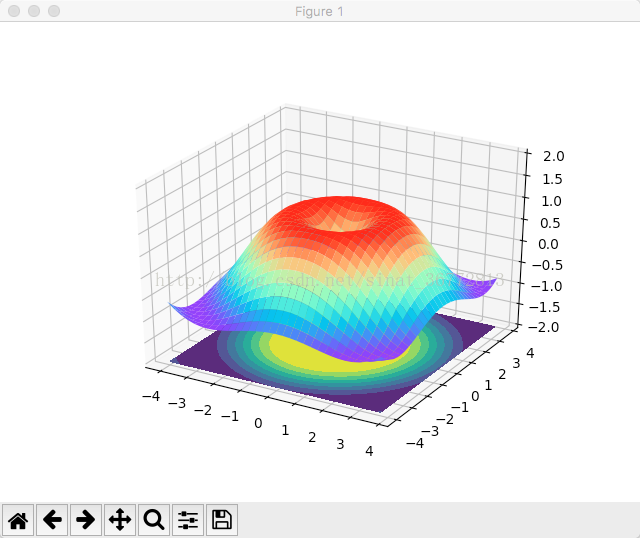
2 绘制3D画面图
2.1 源码
import numpy as np
import matplotlib.pyplot as plt
from mpl_toolkits.mplot3d import Axes3D
fig = plt.figure()
# 创建3d图形的两种方式
# ax = Axes3D(fig)
ax = fig.add_subplot(111, projection='3d')
# X, Y value
X = np.arange(-4, 4, 0.25)
Y = np.arange(-4, 4, 0.25)
X, Y = np.meshgrid(X, Y)    # x-y 平面的网格
R = np.sqrt(X ** 2 + Y ** 2)
# height value
Z = np.sin(R)
# rstride:行之间的跨度  cstride:列之间的跨度
# rcount:设置间隔个数,默认50个,ccount:列的间隔个数  不能与上面两个参数同时出现
#vmax和vmin  颜色的最大值和最小值
ax.plot_surface(X, Y, Z, rstride=1, cstride=1, cmap=plt.get_cmap('rainbow'))
# zdir : 'z' | 'x' | 'y' 表示把等高线图投射到哪个面
# offset : 表示等高线图投射到指定页面的某个刻度
ax.contourf(X,Y,Z,zdir='z',offset=-2)
# 设置图像z轴的显示范围,x、y轴设置方式相同
ax.set_zlim(-2,2)
plt.show()
2.2 效果图
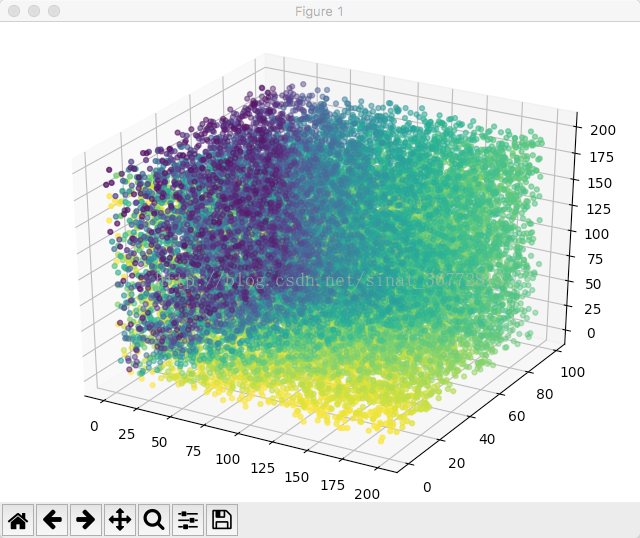
3 绘制散点图
3.1 源码
import numpy as np
import matplotlib.pyplot as plt
from mpl_toolkits.mplot3d import Axes3D
fig = plt.figure()
ax = Axes3D(fig)

x = np.arange(0, 200)
y = np.arange(0, 100)
x, y = np.meshgrid(x, y)
z = np.random.randint(0, 200, size=(100, 200))
y3 = np.arctan2(x,y)
ax.scatter(x, y, z, c=y3, marker='.', s=50, label='')
plt.show()
3.2 效果图
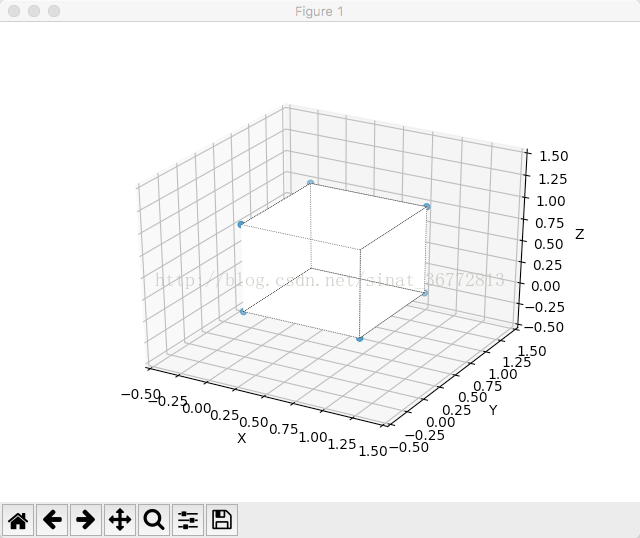
4 绘制多边形
4.1 源码
from mpl_toolkits.mplot3d import Axes3D
from mpl_toolkits.mplot3d.art3d import Poly3DCollection,Line3DCollection
fig = plt.figure()
ax = fig.gca(projection='3d')

# 正文体顶点和面
verts = [(0, 0, 0), (0, 1, 0), (1, 1, 0), (1, 0, 0), (0, 0, 1), (0, 1, 1), (1, 1, 1), (1, 0, 1)]
faces = [[0, 1, 2, 3], [4, 5, 6, 7], [0, 1, 5, 4], [1, 2, 6, 5], [2, 3, 7, 6], [0, 3, 7, 4]]
# 四面体顶点和面
# verts = [(0, 0, 0), (1, 0, 0), (1, 1, 0), (1, 0, 1)]
# faces = [[0, 1, 2], [0, 1, 3], [0, 2, 3], [1, 2, 3]]
# 获得每个面的顶点
poly3d = [[verts[vert_id] for vert_id in face] for face in faces]
# print(poly3d)

# 绘制顶点
x, y, z = zip(*verts)
ax.scatter(x, y, z)
# 绘制多边形面
ax.add_collection3d(Poly3DCollection(poly3d, facecolors='w', linewidths=1, alpha=0.3))
# 绘制对变形的边
ax.add_collection3d(Line3DCollection(poly3d, colors='k', linewidths=0.5, linestyles=':'))

 # 设置图形坐标范围
ax.set_xlabel('X')
ax.set_xlim3d(-0.5, 1.5)
ax.set_ylabel('Y')
ax.set_ylim3d(-0.5, 1.5)
ax.set_zlabel('Z')
ax.set_zlim3d(-0.5, 1.5)
plt.show()
4.2 效果图
5 三个方向有等高线的3D图
5.1 源码
from mpl_toolkits.mplot3d import Axes3D
from matplotlib import cm
from mpl_toolkits.mplot3d import axes3d
fig = plt.figure()
ax = fig.gca(projection='3d')
X, Y, Z = axes3d.get_test_data(0.05)
ax.plot_surface(X, Y, Z, rstride=8, cstride=8, alpha=0.5,color='b')
cset = ax.contour(X, Y, Z, zdir='z', offset=-100, cmap=cm.coolwarm)
cset = ax.contour(X, Y, Z, zdir='x', offset=-40, cmap=cm.coolwarm)
cset = ax.contour(X, Y, Z, zdir='y', offset=40, cmap=cm.coolwarm)

ax.set_xlabel('X')
ax.set_xlim(-40, 40)
ax.set_ylabel('Y')
ax.set_ylim(-40, 40)
ax.set_zlabel('Z')
ax.set_zlim(-100, 100)
plt.show()
5.2 效果图

6 三维柱状图
6.1 源码
import random
import matplotlib as mpl
import matplotlib.dates as mdates
from mpl_toolkits.mplot3d import Axes3D
mpl.rcParams['font.size'] = 10
fig = plt.figure()
ax = fig.add_subplot(111, projection='3d')
for z in [2011, 2012, 2013, 2014]:
    xs = range(1,13)
    ys = 1000 * np.random.rand(12)
    color = plt.cm.Set2(random.choice(range(plt.cm.Set2.N)))
    ax.bar(xs, ys, zs=z, zdir='y', color=color, alpha=0.8)

ax.xaxis.set_major_locator(mpl.ticker.FixedLocator(xs))
ax.yaxis.set_major_locator(mpl.ticker.FixedLocator(ys))
ax.set_xlabel('Month')
ax.set_ylabel('Year')
ax.set_zlabel('Sales Net [usd]')
plt.show()
6.2 效果图

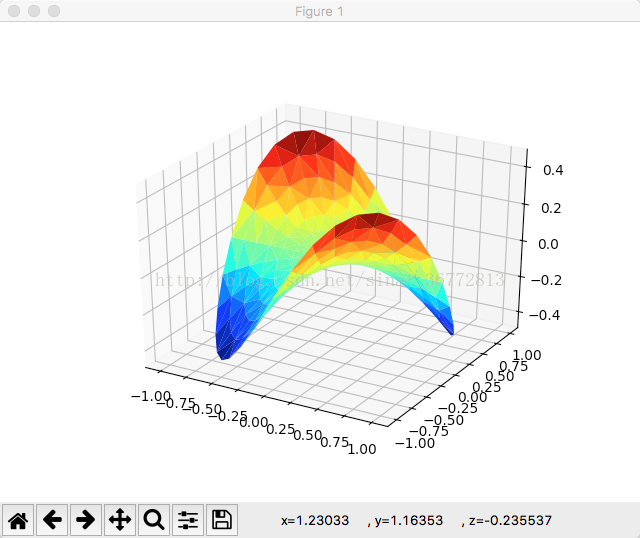
7 补充图
7.1 源码
import numpy as np
import matplotlib.pyplot as plt
from mpl_toolkits.mplot3d import Axes3D
from matplotlib import cm

n_angles = 36
n_radii = 8
# An array of radii
# Does not include radius r=0, this is to eliminate duplicate points
radii = np.linspace(0.125, 1.0, n_radii)
# An array of angles
angles = np.linspace(0, 2 * np.pi, n_angles, endpoint=False)
# Repeat all angles for each radius
angles = np.repeat(angles[..., np.newaxis], n_radii, axis=1)
# Convert polar (radii, angles) coords to cartesian (x, y) coords
# (0, 0) is added here. There are no duplicate points in the (x, y) plane
x = np.append(0, (radii * np.cos(angles)).flatten())
y = np.append(0, (radii * np.sin(angles)).flatten())
# Pringle surface
z = np.sin(-x * y)
fig = plt.figure()
ax = fig.gca(projection='3d')
ax.plot_trisurf(x, y, z, cmap=cm.jet, linewidth=0.2)
plt.show()
7.2 效果图
说明:内容太多,这里都是做了源码和效果图展示,如果有朋友不懂的,或者有我漏掉的东西,大家可以在下面留言交流,我会及时回复大家的,记得在使用中导入import matplotlib.pyplot as plt,否则会报错;对于import numpy as np模块根据实际情况导入,如果没有使用该模块构造数据的,可以不导入。


 404
404


 被折叠的 条评论
为什么被折叠?
被折叠的 条评论
为什么被折叠?
 到【灌水乐园】发言


